www.rpped.com.br
REVISTA
PAULISTA
DE
PEDIATRIA
ORIGINAL
ARTICLE
Association
between
fat
mass
index
and
fat-free
mass
index
values
and
cardiovascular
risk
in
adolescents
Patrícia
Morais
de
Oliveira,
Fabiana
Almeida
da
Silva,
Renata
Maria
Souza
Oliveira,
Larissa
Loures
Mendes,
Michele
Pereira
Netto,
Ana
Paula
Carlos
Cândido
∗UniversidadeFederaldeJuizdeFora(UFJF),JuizdeFora,MG,Brazil
Received27January2015;accepted4June2015 Availableonline22December2015
KEYWORDS
Cardiovascular diseases/riskfactors; Adolescent/growth anddevelopment; Bodycomposition; Bodyfat
Abstract
Objective: Todescribetheassociationbetweenfatmassindexandfat-freemassindexvalues andfactorsassociatedwithcardiovascularriskinadolescentsinthecityofJuizdeFora,Minas Gerais.
Methods: Cross-sectionalstudywaswith403adolescentsaged10---14years,frompublicand private schools.Anthropometric,clinical,andbiochemicalmeasurementswereobtained,as wellasself-reportedtimespentperformingphysicalexercises,sedentaryactivitiesandsexual maturationstage.
Results: Regardingthenutritionalstatus,66.5%oftheadolescentshadnormalweight,19.9% wereoverweightand10.2%wereobese.Forbothgenders,thefatmassindexwashigherin adolescentswhohadhighserumtriglycerides,bodymassindexandwaistcircumference. Conclusions: Adolescents who had anthropometric, clinical and biochemicalcharacteristics consideredtobeatrisk forthedevelopmentofcardiovasculardiseasehadhighervaluesof fatmassindex.Differentmethodologiesfortheassessmentofbodycompositionmakehealth promotionanddiseasepreventionmoreeffective.
©2015SociedadedePediatriadeSãoPaulo.PublishedbyElsevierEditoraLtda.Thisisanopen accessarticleundertheCCBYlicense(https://creativecommons.org/licenses/by/4.0/).
∗Correspondingauthor.
E-mail:[email protected](A.P.C.Cândido). http://dx.doi.org/10.1016/j.rppede.2015.06.020
PALAVRAS-CHAVE
Doenc¸as
cardiovasculares/ fatoresderisco; Adolescente/ crescimentoe desenvolvimento; Composic¸ãocorporal; Gorduracorporal
Associac¸ãoentreíndicedemassadegorduraeíndicedemassalivredegordura eriscocardiovascularemadolescentes
Resumo
Objetivo: Descreverarelac¸ãoentrevaloresdeíndicedemassadegorduraeíndicedemassa livre degorduraefatoresassociadosariscocardiovascularemadolescentesdeJuizdeFora (MG).
Métodos: Estudotransversalfeitocom403adolescentesde10-14anos,deescolaspúblicase privadas.Avaliaram-semedidasantropométricas,clínicas,bioquímicas,autorrelatodotempo dedicadoaoexercíciofísico,atividadessedentáriaseestágiodematurac¸ãosexual.
Resultados: Quantoaoestadonutricional,66,5%dosadolescentesestavameutróficos,19,9% comsobrepesoe10,2%obesos.Paraambosossexos,oíndicedemassadegordurafoimaiornos adolescentesqueestavamcomtriglicerídeosséricos,índicedemassacorporalecircunferência dacinturaelevados.
Conclusões: Osadolescentesquetinhamcaracterísticasantropométricas,clínicase bioquími-casconsideradasderiscoparaodesenvolvimentodedoenc¸ascardiovascularesapresentaram maiores valores do índice de massa de gordura. Metodologias diferenciadas para avaliac¸ão dacomposic¸ãocorporaltornamapromoc¸ãodasaúdeeaprevenc¸ãodeagravosfuturosmais eficazes.
©2015SociedadedePediatriadeSãoPaulo.PublicadoporElsevierEditoraLtda.Esteéumartigo OpenAccesssobalicençaCCBY(https://creativecommons.org/licenses/by/4.0/deed.pt).
Introduction
The increased prevalence of overweight in adolescents1
is associated with risk factors for cardiovascular disease in adulthood and results in high costs for public health.1
Currently,it is shown that body fat distributionhas more influence thantotal bodymass inthe presenceof cardio-vascularriskfactors.2---4 Theabilitytomeasureor quantify
bodyfatstoresiscentralforpreventingandtreating obesity-related diseases.2 Therefore, more accurate methods are
neededtoassessadiposityanddoproperscreeningforearly intervention.3---6
Body mass index (BMI) hasbeen the most widely used anthropometricmethodfor diagnosingoverweight, butits predictiveability toidentifyyoung peoplewithhigh body fat is open for discussionin scientific circles.5,6 It cannot
discriminate between fat mass and lean mass, does not reflect the great changes in body compositionthat occur inthisagegroupandaredifferentbetweenthesexes.5Soit
wouldbemorefeasibletodistinguishthebodycomponents throughmoreprecisemeasurementsthatconsiderthebody fatpercentage.2
VanItallieetal.7proposedtheuseoffatmassindex(FMI)
andfat-freemassindex(FFMI)foramoredetailed anthro-pometricmeasurement, accordingtobodycompartments, by calculation that considersthe amount of fat mass and fat-free mass in kg obtained by bioelectrical impedance, withtheadvantageof relatingonlyonebodyweight com-ponent to the height squared and of being expressed in unitsthatarecommontoBMI.8Withtheuseofthesetwo
indices,it becomespossible tojudgewhetheradeficit or excessofbodyweightisselectivelyduetoachangein fat-free mass, in fat mass, or both.8 Four typical situations
canbeidentified:lowFFMIandhighFMI,correspondingto
obesity;lowFFMIandlowFMI, correspondingtoleanness; highFFMI andlowFMI, correspondingtomuscle hypertro-phy;andhighFFMIandhighFMI,correspondingtocombined excessofFFMIandFMI.The referencevaluesofthesetwo indicesarenotyetaconsensusinthescientificliterature, particularly for adolescents. In the study by Nakao and Komiya,9thereferencevaluesofFFMIwere12.7---13.4kg/m2
forboysand12---13kg/m2for girls.AsforFMI,theadopted
referencevaluesadoptedwere2.8---3.6kg/m2 forboysand
3.2---3.8kg/m2forgirls.
Consideringtheneedforamoredetailedanthropometric assessment for adolescents, the aim of this study was to describethe relationship between the values of fat mass indexand fat-freemassindexandfactors associatedwith cardiovascularriskinadolescentsinthe JuizdeForacity, MG.
Method
Cross-sectionalstudywasperformedwithadolescents,aged 10---14years,attendingpublicandprivateschoolsinJuizde Fora,MG.The numberofschoolsandstudentsper institu-tion,belongingtothatagegroup,wasobtainedthroughthe SchoolCensus providedbyINEP 2009.10 Thirty-fiveschools
wereselected,basedontheproportionbycityregions.Total samplewasbasedonthreeparameters:proportionof obe-sity in the age group studied (8%)11; a desired precision
Anthropometric,clinical,andbiochemicalmeasurements were evaluated. Students also reported how much time theyspentpracticingexercises,watchingTV,playingvideo gamesandusingthecomputer.Adolescentswhoengagedin over 300minutes perweek of physical activity were con-sideredactive.12Tanner’sscale13 wasusedforadolescents’
self-assessment of their sexual maturation, and the girls indicatedthepresenceandageofmenarcheoccurrence.
Bodymass wasmeasured usingabipolar bioimpedance scale(Tanita®BC-553,Illinois,USA)withamaximum
capac-ityof136kg,alsousedtoassessbodyfatpercentage.Height wasmeasuredbyfieldstadiometer(Alturaexata®,Belo
Hori-zonte,Brazil), with scale in centimeters and accuracy of 0.01m.Thenutritionalstatusoftheadolescentswas deter-minedbyBMIforage,according totheWHO classification criteria,whereaBMIabovethe85thpercentileisclassified asoverweight.14 Waistcircumferencewasobtainedusinga
1.5msimpleandinelastictapemeasure,with0.01m inter-val.Allmeasurementsfollowedtheproceduresstandardized bytheWHO,andcircumferencevaluesabovethe85th per-centilewereconsideredhighforbothsexes.Regardingfat percentage,valuesgreater than 30% for girls and25% for boyswereconsideredhighandofrisk.15
TetrapolarbioimpedanceBiodynamics310®(Biodynamics
Corporation,Washington,USA)wasusedwithmeasurements performed according to the manufacturer’s instructions. The resistance and reactance values found were used to determinetheamount inkgoffat mass(FM) andfat-free mass (FFM). FMI wasdetermined by dividing fat mass (in kilograms)byheightsquared(inmeters).Similarly,FFMIwas calculated by dividing lean mass (in kilograms) by height squared(in meters),asproposedby VanItallie etal.7 The
averageofthetwoclosestvaluesofthebiceps,triceps, sub-scapular, and supra-iliac skinfold thickness measurements wereadded. Triceps andsubscapular meanvalues of skin foldswerealsoaddedseparately.Theanalogskinfoldcaliper Lange®(BetaTechnology,California,USA),withprecisionof
0.1mm in triplicate, wasusedto measurethe skinfold of biceps(performedwithbentelbowsat90◦,halfwaybetween thearmpitandthecubitalfossa),triceps(atmidpointofthe distancebetweentheacromionandtheolecranon, onthe backof the left arm), subscapular(in the lower angle of thescapula,at 45◦ diagonal),andsupra-iliac(onthe mid-axillaryline,betweenthelastribandtheiliaccrest).The formulaproposedbyDeurenbergetal.16 wasusedfordata
analysistopredictvaluesassociatedwithbodydensityand subsequentlythoseassociatedwithfatinrelation tobody weight.
Bloodsamples(6mL)werecollectedbyvenipuncturein theantecubitalregionof patientsafter 12-h fastto mea-sure the levels of total cholesterol, fractions (HDL-c and LDL-c), and triglycerides. The procedures were standard-izedintheBiochemistryLaboratoryoftheSchoolHospital oftheFederal UniversityofJuizdeFora(UFJF).To evalu-atelipidchanges,thereferencevaluesrecommendedbythe BrazilianSocietyofCardiologywereapplied.17Valuesabove
150mg/dL,100mg/dL,and100mg/dLfortotalcholesterol, triglycerides,andLDL-c,respectively,wereconsideredhigh riskforadolescentsofbothsexes;whereasfor HDL-c, val-uesbelow45mg/dLwereconsideredriskforbothboysand girls.Diagnosisofdiabetesmellituswasdetermined accord-ing to the Brazilian Society of Diabetes criteria (fasting
glucoseabove100mg/dL).18Theparameterswereanalyzed
byautomaticanalyzerCobasMiraPlus®(RocheDiagnostics,
Switzerland).
Bloodpressurelevelsofstudentsundergoingevaluation weremeasuredthreetimeswithdigitaloscillometricdevice OmronHEM-705CP® (OmronCorporation, Brazil).The
sub-jectswereseated(leftarm extendedat heart level),and anintervalof10---15minwasmaintainedbetweeneach mea-surement. Classification was based on the 5th Brazilian GuidelinesonHypertensionfromtheaverage ofthethree measurementsperformed (systolicbloodpressureand dia-stolicbloodpressureabovethe90thpercentile).19
The project was approved by the Federal University of Juiz de Fora Institutional Review Board, Opinion No. 09/2010,andstartedaftertheconsentofthelegalguardians ofadolescentsandschooldirectors.
Inthe statistical analysis,Student’s t-test wasusedto assessthedifferencesbetweenthemeanvaluesofeach vari-ableinrelationtosex.Theanalysisofvariance(ANOVA)was usedtocomparemeanvaluesofbodycompositionindices anditscorrespondingmasseswiththeotherstudied varia-bles.TheSPSSversion17.0softwarewasusedforstatistical analysis,anda5%significancelevelwasadmitted.
Results
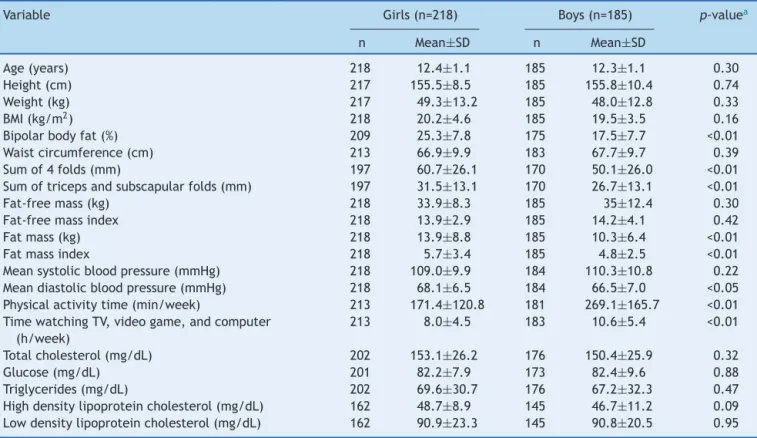
Atotalof403adolescentswereevaluated,218(54.1%)were female,meanagewas12.4±1.2years.Agegroup distribu-tion wassimilar between thesexes (p=0.30). The sample consistedof66.5%eutrophic,19.9%overweight,and10.2% obeseadolescents.Table1showsthecharacteristicsofthe studypopulationstratifiedbysex.
Regarding body composition, female adolescents had higher percentages of body fat (determined by bipolar bioimpedance and sum of skinfolds), FM and FMI. Mean diastolic blood pressurewashigher in females. Male ado-lescents spent more timeon physical activity and also in sedentary practices, such as watching TV, playing video games,andusingthecomputer,thanfemaleadolescents.
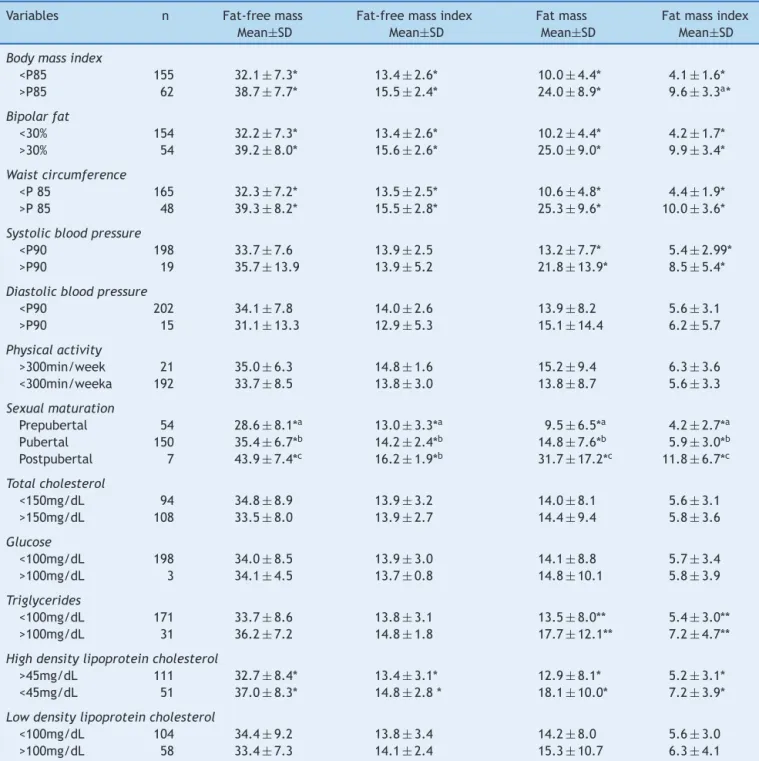
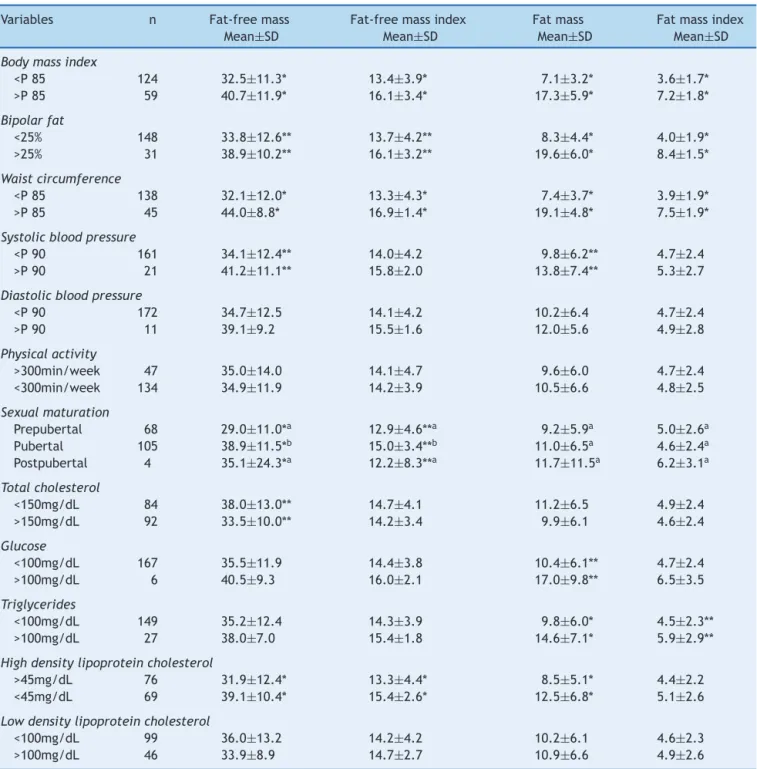
Tables2 and3 representthe meanvalue andstandard deviationofanthropometric,clinical,andbiochemical char-acteristics in relation tobody compositionindices andits correspondingmassesforbothfemaleandmaleadolescents, respectively. Forboth sexes, higher mean values of FFM, FFMI, FM and FMI were found in adolescents with excess weight,high bodyfatandwaistcircumference.Therewas asignificantdifferenceinsystolicbloodpressure.Girlswith SAP>p90hadhighermeanvaluesofFMandFMI,andboysin thesamePASclassificationhadhighermeanvaluesofFMand FFM.Regardingsexualmaturation,FFMIandFFMwerehigher inthepostpubertalstageforbothgirlsandboys.Thesame wasseen forFMandFMI infemaleadolescentsin postpu-bertalstage.Inbiochemicalevaluation,femaleadolescents withHDL-c<45mg/dL hadhighermean FFM,FFMI, FMand FMI;whereastriglyceridevalueswerehigherinfemale ado-lescentswithhighFMandFMI.
Table1 Comparisonofthemeanvaluesofdemographic,anthropometric,clinical,andbiochemicalvariables andphysical activityofthestudypopulationbysex(n=403).JuizdeFora,MG,Brazil,2014.
Variable Girls(n=218) Boys(n=185) p-valuea
n Mean±SD n Mean±SD
Age(years) 218 12.4±1.1 185 12.3±1.1 0.30
Height(cm) 217 155.5±8.5 185 155.8±10.4 0.74
Weight(kg) 217 49.3±13.2 185 48.0±12.8 0.33
BMI(kg/m2) 218 20.2±4.6 185 19.5±3.5 0.16
Bipolarbodyfat(%) 209 25.3±7.8 175 17.5±7.7 <0.01
Waistcircumference(cm) 213 66.9±9.9 183 67.7±9.7 0.39
Sumof4folds(mm) 197 60.7±26.1 170 50.1±26.0 <0.01
Sumoftricepsandsubscapularfolds(mm) 197 31.5±13.1 170 26.7±13.1 <0.01
Fat-freemass(kg) 218 33.9±8.3 185 35±12.4 0.30
Fat-freemassindex 218 13.9±2.9 185 14.2±4.1 0.42
Fatmass(kg) 218 13.9±8.8 185 10.3±6.4 <0.01
Fatmassindex 218 5.7±3.4 185 4.8±2.5 <0.01
Meansystolicbloodpressure(mmHg) 218 109.0±9.9 184 110.3±10.8 0.22 Meandiastolicbloodpressure(mmHg) 218 68.1±6.5 184 66.5±7.0 <0.05 Physicalactivitytime(min/week) 213 171.4±120.8 181 269.1±165.7 <0.01 TimewatchingTV,videogame,andcomputer
(h/week)
213 8.0±4.5 183 10.6±5.4 <0.01
Totalcholesterol(mg/dL) 202 153.1±26.2 176 150.4±25.9 0.32
Glucose(mg/dL) 201 82.2±7.9 173 82.4±9.6 0.88
Triglycerides(mg/dL) 202 69.6±30.7 176 67.2±32.3 0.47
Highdensitylipoproteincholesterol(mg/dL) 162 48.7±8.9 145 46.7±11.2 0.09 Lowdensitylipoproteincholesterol(mg/dL) 162 90.9±23.3 145 90.8±20.5 0.95
a Student’st-test.
highervaluesofFMandFMI.Itwasfoundthatadolescents withlowserumlevelsofHDL-chadhigheraveragesofFFM, FFMI,andFM.
Discussion
Obesity in adolescence is reachingincreasing proportions and results in 21.5% of Brazilian adolescents with excess weight and obesity.1 Among the students of Juiz de Fora
whoparticipatedinthestudy,theprevalencewas19.9%for overweightand10.2%forobesity.
The results for body composition showed differences betweenthesexes.Femaleadolescentsshowedhigher per-centageofbodyfatandmassandFMI,similartothestudy byEissaetal.4Forbothsexes,thehighestaveragevaluesof
FFM,FFMI,FMandFMIwererelatedtotheanthropometric variables,whichestimatetotalandcentralbodyfat(BMI,% fat,andwaistcircumference).
Bodycompositionvarieswidelyinadolescents;itdepends onage,gender, ethnicity,height,andsexualmaturation.5
Duringpuberty, forboth sexes, thereis aweightincrease inleanandfat tissueandbonemineralcontent,20 butthe
majorgrowth and developmentconditioning of this stage ofliferesultsfromsexualmaturation,whichcontributesto dimorphismbetweengirlsandboys.21
In this study, FFMI and FFM were characterized by an increaseinitsvaluesaccordingtothepubertalstage, par-ticularlyingirls.Inthesexualmaturationprocess,height, lean musclemass, and bone mineral content aredirectly
proportionaltothepeakheightvelocity20 and,therefore,
higherFFMandFFMIwerefoundinpostpubertalstage, sim-ilartothatreportedbyMirandaetal.22 Thesamewasseen
forFMandFMIinfemaleadolescents,whosehighest aver-agesoccurredinthepostpubertalstage.
Itisknownthatacertainstorageofbodyfatisneeded fortheoccurrence ofpubertal growthspurtinboth sexes and that the relative amount of fat in females increases progressivelyduringadolescence.23InthestudybyMiranda
et al.,22 the highest accumulation wasfound in the
pre-pubertal stage. However, higher body fat mass values in the postpubertal stage may be seen in adolescents who reach menarche at an early age and who need to reach a critical weight of at least 17% fat to start the growth spurtand reachmenarche. Thereis alsothe influence of highbloodconcentrationsofestradioltostimulategreater lipogenesis.24 Furthermore,mostadolescentsin thisstudy
were in puberty stage, and the small sample size of the pre-andpostpubescentstagesmayhavecontributedtothe outcomes.
As for the boys, therewas nosignificant differencein meanvaluesofFMandFMIbetweenpubertalstages,which corroborates the study by Borges et al.25 For boys, the
largestcontributortoincreaseBMIseemstobetheincrease in FFM.5 Mostof ouradolescents were in pubertal stage,
whichischaracterizedbyheightgrowthandincreasedlean mass.
According to Leccia et al.,26 sexual maturation seems
Table2 Comparison betweenanthropometric, clinical,biochemicalandphysicalactivitycharacteristicsregardingfat-free mass,fat-freemassindex,fatmassandfatmassindexoffemaleadolescents.JuizdeFora,MG,Brazil,2014.
Variables n Fat-freemass
Mean±SD
Fat-freemassindex Mean±SD
Fatmass Mean±SD
Fatmassindex Mean±SD
Bodymassindex
<P85 155 32.1±7.3* 13.4±2.6* 10.0±4.4* 4.1±1.6*
>P85 62 38.7±7.7* 15.5±2.4* 24.0±8.9* 9.6±3.3a*
Bipolarfat
<30% 154 32.2±7.3* 13.4±2.6* 10.2±4.4* 4.2±1.7*
>30% 54 39.2±8.0* 15.6±2.6* 25.0±9.0* 9.9±3.4*
Waistcircumference
<P85 165 32.3±7.2* 13.5±2.5* 10.6±4.8* 4.4±1.9*
>P85 48 39.3±8.2* 15.5±2.8* 25.3±9.6* 10.0±3.6*
Systolicbloodpressure
<P90 198 33.7±7.6 13.9±2.5 13.2±7.7* 5.4±2.99*
>P90 19 35.7±13.9 13.9±5.2 21.8±13.9* 8.5±5.4*
Diastolicbloodpressure
<P90 202 34.1±7.8 14.0±2.6 13.9±8.2 5.6±3.1
>P90 15 31.1±13.3 12.9±5.3 15.1±14.4 6.2±5.7
Physicalactivity
>300min/week 21 35.0±6.3 14.8±1.6 15.2±9.4 6.3±3.6
<300min/weeka 192 33.7±8.5 13.8±3.0 13.8±8.7 5.6±3.3
Sexualmaturation
Prepubertal 54 28.6±8.1*a 13.0
±3.3*a 9.5
±6.5*a 4.2 ±2.7*a
Pubertal 150 35.4±6.7*b 14.2±2.4*b 14.8±7.6*b 5.9±3.0*b
Postpubertal 7 43.9±7.4*c 16.2
±1.9*b 31.7
±17.2*c 11.8 ±6.7*c
Totalcholesterol
<150mg/dL 94 34.8±8.9 13.9±3.2 14.0±8.1 5.6±3.1
>150mg/dL 108 33.5±8.0 13.9±2.7 14.4±9.4 5.8±3.6
Glucose
<100mg/dL 198 34.0±8.5 13.9±3.0 14.1±8.8 5.7±3.4
>100mg/dL 3 34.1±4.5 13.7±0.8 14.8±10.1 5.8±3.9
Triglycerides
<100mg/dL 171 33.7±8.6 13.8±3.1 13.5±8.0** 5.4±3.0**
>100mg/dL 31 36.2±7.2 14.8±1.8 17.7±12.1** 7.2±4.7**
Highdensitylipoproteincholesterol
>45mg/dL 111 32.7±8.4* 13.4±3.1* 12.9±8.1* 5.2±3.1*
<45mg/dL 51 37.0±8.3* 14.8±2.8* 18.1±10.0* 7.2±3.9*
Lowdensitylipoproteincholesterol
<100mg/dL 104 34.4±9.2 13.8±3.4 14.2±8.0 5.6±3.0
>100mg/dL 58 33.4±7.3 14.1±2.4 15.3±10.7 6.3±4.1
MeanswithdifferentlettersaresignificantlydifferentaccordingtotheLeastSignificantDifferencetest(LSD).
Student’st-test.*p<0.01;**p<0.05.
bodyweight,andleanbodymasswithsystolicblood pres-sureforbothboysandgirlsandwithdiastolicbloodpressure justfor girls.In ourstudy,higherdiastolic bloodpressure wasfoundingirls,comparedtomales,andFFMwashigher among boys who had high systolic blood pressure, prob-ably because the increased muscle mass was greater in maleadolescents.Weightgainandhighbodyfatcan signifi-cantlycontributetohighbloodpressureeveninindividuals classifiedasnormotensive.27Systolicbloodpressureof
ado-lescentsinthisstudywasassociatedwithhighermeanvalues
ofFMIanditscorrespondingmassforbothsexes.According toJessupandHarrell,28systolicbloodpressureincreasesin
pubertalstage,regardlessofage,particularlyingirls.Inthis study,wefoundthatmostoftheadolescentsofbothsexes wereinthepubertalstageofmaturation.
Literatureshowsthat excessbodyfat canincrease the risk of metabolic disorders, such as dyslipidemia, insulin resistance,andimpairedglucosetolerance.29Theresultsof
Table3 Comparisonbetween anthropometric, clinical,biochemicalandphysicalactivityregardingfat-freemass, fat-free massindex,fatmassandfatmassindexofmaleadolescents.JuizdeFora,MG,Brazil,2014.
Variables n Fat-freemass
Mean±SD
Fat-freemassindex Mean±SD
Fatmass Mean±SD
Fatmassindex Mean±SD
Bodymassindex
<P85 124 32.5±11.3* 13.4±3.9* 7.1±3.2* 3.6±1.7*
>P85 59 40.7±11.9* 16.1±3.4* 17.3±5.9* 7.2±1.8*
Bipolarfat
<25% 148 33.8±12.6** 13.7±4.2** 8.3±4.4* 4.0±1.9*
>25% 31 38.9±10.2** 16.1±3.2** 19.6±6.0* 8.4±1.5*
Waistcircumference
<P85 138 32.1±12.0* 13.3±4.3* 7.4±3.7* 3.9±1.9*
>P85 45 44.0±8.8* 16.9±1.4* 19.1±4.8* 7.5±1.9*
Systolicbloodpressure
<P90 161 34.1±12.4** 14.0±4.2 9.8±6.2** 4.7±2.4
>P90 21 41.2±11.1** 15.8±2.0 13.8±7.4** 5.3±2.7
Diastolicbloodpressure
<P90 172 34.7±12.5 14.1±4.2 10.2±6.4 4.7±2.4
>P90 11 39.1±9.2 15.5±1.6 12.0±5.6 4.9±2.8
Physicalactivity
>300min/week 47 35.0±14.0 14.1±4.7 9.6±6.0 4.7±2.4
<300min/week 134 34.9±11.9 14.2±3.9 10.5±6.6 4.8±2.5
Sexualmaturation
Prepubertal 68 29.0±11.0*a 12.9
±4.6**a 9.2
±5.9a 5.0 ±2.6a Pubertal 105 38.9±11.5*b 15.0±3.4**b 11.0±6.5a 4.6±2.4a
Postpubertal 4 35.1±24.3*a 12.2
±8.3**a 11.7
±11.5a 6.2 ±3.1a
Totalcholesterol
<150mg/dL 84 38.0±13.0** 14.7±4.1 11.2±6.5 4.9±2.4
>150mg/dL 92 33.5±10.0** 14.2±3.4 9.9±6.1 4.6±2.4
Glucose
<100mg/dL 167 35.5±11.9 14.4±3.8 10.4±6.1** 4.7±2.4
>100mg/dL 6 40.5±9.3 16.0±2.1 17.0±9.8** 6.5±3.5
Triglycerides
<100mg/dL 149 35.2±12.4 14.3±3.9 9.8±6.0* 4.5±2.3**
>100mg/dL 27 38.0±7.0 15.4±1.8 14.6±7.1* 5.9±2.9**
Highdensitylipoproteincholesterol
>45mg/dL 76 31.9±12.4* 13.3±4.4* 8.5±5.1* 4.4±2.2
<45mg/dL 69 39.1±10.4* 15.4±2.6* 12.5±6.8* 5.1±2.6
Lowdensitylipoproteincholesterol
<100mg/dL 99 36.0±13.2 14.2±4.2 10.2±6.1 4.6±2.3
>100mg/dL 46 33.9±8.9 14.7±2.7 10.9±6.6 4.9±2.6
MeanswithdifferentlettersaresignificantlydifferentaccordingtotheLeastSignificantDifferencetest(LSD).
Student’st-test.*p<0.01;**p<0.05.
withimpaired fasting glucosealsohad higherFM andFMI values.
However,FFMvalueswerehigherinadolescentswithlow levels of serum HDL-c of both sexes and increased total cholesterol in maleadolescents. Changes in body compo-sitionandlipidprofileduringpubertymaybeinfluencedby reducedphysical activity and change ineating habitsand hormonal,whichiscommoninadolescence.28Althoughthis
study did notconsiderdietary and hormonalinformation, therewasa significant difference in physical activity and
sedentary activities between the sexes. Male adolescents spendmoretimedoingphysical exercisethangirls.Inthe studyby Schubertetal.,29 theincrease inFFMI was
asso-ciated with decreased HDL-c and high triglycerides. It is possiblethattheincreaseinFFM,followedbyhigher eleva-tionsofFM,mayresultinreducedconcentrationsofHDL-C andthat theFFMIeffectismaskedby thatofFMI. Pietro-bellietal.30 alsofound that therelationship ofincreased
formationofparticlessmallerthanHDLandanincreasein HDLmetabolism.
Thisstudyhassomelimitations.Althoughpressure mea-surements were standardized, they were performed in a single day, and the periods of time of physical activity were estimated by self-report of adolescents. However, theyare methodologies considered more practical, feasi-ble,andvalidatedforcross-sectional studies,liketheone performed.19 Still, the results of this study indicate that
adolescentswithanthropometric,clinical,andbiochemical characteristicsconsideredasriskfordeveloping cardiovas-cular disease had higher FMI values. Regarding FFMI, the differenceswerenotmarked.Differentmethodologiesfor assessmentofbodycompositionand,consequently, cardio-vascular risksto which adolescentsarepredisposed make healthpromotionandthepreventionoffuturedamagemore effective.
Funding
Conselho Nacional de Desenvolvimento Científico e Tec-nológico(editalMCT/CNPq,no.14/2010Universal).
Conflicts
of
interest
Theauthorsdeclarenoconflictsofinterest.
Acknowledgements
WethanktheschoolsofJuizdeFora,MG,forsupportingthe workwiththeadolescentsandforconsentingtoperformthe study;thestudentsofthe NutritionCourseof theFederal Universityof JuizdeForafortheir assistanceindata col-lection;theUniversityHospitaloftheFederalUniversityof JuizdeForaforthebiochemicalanalysisofthestudy;and theCNPqforprojectfinancing.
References
1.Brasil --- Ministério do Planejamento, Orc¸amento e Gestão; Instituto Brasileiro de Geografia e Estatística. Pesquisa de orc¸amentos familiares 2008-2009: antropometria e estado nutricionaldecrianc¸as,adolescenteseadultosnoBrasil.Rio deJaneiro:IBGE;2010.
2.PeltzG,AguirreMT,SandersonM,FaddenMK.Theroleoffat massindex indeterminingobesity. AmJHum Biol.2010;22: 639---47.
3.Bahadori B, Uitz E, Tonninger-Bahadori K, Pestemer-Lach I, Trummer M,Thonhofer R, et al. Body composition: the fat-free mass index (FFMI) and the bodyfat mass index (BFMI) distributionamongtheadultAustrianpopulation---resultsof across-sectionalpilotstudy.IJBCR.2006;4:123---8.
4.EissaMA,DaiS,MihalopoulosNL,DayRS,HarristRB,Labarthe DR.Trajectoriesof fatmass index,fat free-mass index, and waistcircumferenceinchildren:ProjectHeartBeat.AmJPrev Med.2009;37Suppl.1:S34---9.
5.VieiraAC,AlvarezMM,MarinsVM,SichieriR,VeigaGV. Desem-penho de pontos de corte do índice de massa corporal de diferentesreferênciasnapredic¸ãodegorduracorporalem ado-lescentes.CadSaudePublica.2006;22:1681---90.
6.Alvero-CruzJR,AlvarezCarneroE,Fernández-GarcíaJC, Bar-rera Expósito J, Carrillo de Albornoz Gil MC, Sardinha LB. Validityofbodymassindexand fatmassindex asindicators ofoverweightstatusinSpanishadolescents:EsccolaStudy.Med Clin(Barc).2010;135:8---14.
7.VanItallieTB,YangUM,HeymsfieldSB,FunkRC, BoileauRA. Height-normalizedindicesofthebody’sfat-freemassandfat mass:potentiallyusefulindicatorsofnutritionalstatus.AmJ ClinNutr.1990;52:953---9.
8.SchutzHR,KyleUU,PichardC.Fat-freemassindexandfatmass indexpercentilesinCaucasiansaged18---98y.IntJObesRelat MetabDisord.2002;26:953---60.
9.NakaoT,KomiyaS.Referencenormsforafat-freemassindex andfatmassindexintheJapanesechildpopulation.JPhysiol AnthropolApplHumSci.2003;22:293---8.
10.INEP. Instituto Nacional de Estudos ePesquisas Educacionais
Anísio Teixeira [página na Internet]. Matrícula no ensino
fundamental no município de Juiz de Fora, Minas Gerais
[accessed September 2009]. Available from: http://www.
edudatabrasil.inep.gov.index.htm.
11.Abrantes MM, Lamounier JA, Colosimo EA. Prevalência de sobrepesoeobesidadenasregiõesNordesteeSudestedoBrasil. RevAssocMédBras.2003;49:162---6.
12.DobbinsM,deCorbyK,RobesonP,HussonH,TirilisD. School-basedphysicalactivityprogramsforpromotingphysicalactivity andfitness inchildrenand adolescentsaged6---18. Cochrane DatabaseSystRev.2009;21:CD007651.
13.TannerJM.Growthatadolescence.Oxford:BlackwellScientific Publications;1962.
14.DeOnisM,OnyangoAW,BorghiE,SiyamA,NishidaC,Siekmann J.DevelopmentofaWHOgrowthreferenceforschool-aged chil-drenandadolescents.BullWordHealthOrgan.2007;85:660---7. 15.WorldHealth Organization.Globalstrategyondiet,physical,
activityandhealth.Geneva:WHO;1997.
16.DeurenbergP,PietersJJ,HautvastJG.Theassessmentofthe body fat percentage by skinfold thickness measurements in childhoodandyoungadolescence.BrJNutr.1990;63:293---303. 17.GiulianoIC,CaramelliB,PellandaL,DuncanB,MattosS, Fon-secaFH.Idiretrizdeprevenc¸ãodaaterosclerosenainfânciae adolescência.ArqBrasCardiol.2005;85Suppl.VI:1---36. 18.SociedadeBrasileiradeDiabetes.Atualizac¸ãoBrasileirasobre
Diabetes.RiodeJaneiro:Diagraphic;2005.
19.SociedadeBrasileiradeCardiologia.VDiretrizesBrasileirasde HipertensãoArterial.SãoPaulo:SBC;2006.
20.SiervogelRM,DemerathEW,SchubertC,RemsbergKE,Chumlea WC,SunS, etal. Pubertyand bodycomposition.Horm Res. 2003;60Suppl.1:36---45.
21.GattiRR,RibeiroRP.Prevalênciadeexcessodepesoem adoles-centessegundoamaturac¸ãosexual.RevSalus.2007;1:175---82. 22.MirandaVP,FariaFR,FariaER,PrioreSE.Maturac¸ãosomáticae composic¸ãocorporalemadolescenteseutróficosdosexo fem-inino com ou sem adequac¸ão de gordura corporal. RevPaul Pediatr.2014;32:78---84.
23.ClementeAP,SantosCD,MartinsVJ,Benedito-SilvaAA, Albu-querqueMP,SawayaAL.Mildstuntingisassociatedwithhigher bodyfat:studyofalow-incomepopulation.JPediatr(RioJ). 2011;87:138---44.
24.AdamiF,VasconcelosFA. Obesidadeematurac¸ãosexual pre-coce em escolaresde Florianópolis-SC. Rev BrasEpidemiol. 2008;11:549---60.
25.BorgesFS, MatsudoSM,Matsudo VK.Perfil antropométricoe metabólicoderapazespubertáriosdamesmaidadecronológica emdiferentesníveisdematurac¸ãosexual.RevBrasCiéncMov. 2004;12:7---12.
maturationonbloodpressureinadolescents.EurJClinNutr. 1999;53:333---7.
27.CorseuilHX,BarbosaDBM,MendesJKF,JúniorJCF,LopesAS, PetroskEL.Excessodepesoepressãoarterialemadolescentes deJoãoPessoa-PB.RevEducUEM.2009;20:273---80.
28.Jessup A, Harrell JS. The metabolic syndrome: look for it in children and adolescents, too! Clin Diabetes. 2005;23: 26---32.
29.SchubertCM,RogersNL,RemsbergKE,SunSS,ChumleaWC, DemerathEW,etal.Lipids,lipoproteins,lifestyle,adiposityand fat-freemassduringmiddleage:theFelslongitudinalstudy.Int JObes(Lond).2006;30:251---60.