RBCDH
Licence Creative Commom
CC
BY
Motor performance of elderly in a community
in southern Brazil
Desempenho motor de idosos de uma comunidade do
sul do Brasil
Susana Cararo Confortin1 Aline Rodrigues Barbosa1,2 Ana Lúcia Danielewicz2 Vandrize Meneghini3 Wagner Luiz Testa1
Abstract– he objective of this study was to present reference values and assess the motor performance of the elderly in a community in the south of Brazil, according to sex and age group. Population-based household study, conducted with 477 elderly (≥60 years) from the municipality of Antônio Carlos, Santa Catarina state. Motor performance was veriied by four tests: handgrip strength (KG), balance (four tasks), ‘chair stand’ and ‘pick up a pen’ (seconds). We use a score varying from 0 (unable) to 3 (good) in all the tests.
We assessed 270 women with a mean age of 73.2 ±8.82 years, and 207 men (73.3 ± 8.96 years). he results showed that the values (means, standard deviations and percentiles) were higher in men than those of the women in handgrip strength test and lower in the tests evaluated by time. he chi-square test showed that men had the highest prevalence of ‘good’ performance in the ‘chair stand’, balance and handgrip strength tests, when compared to the women (p≤0.01). With the advance of age there is a reduction in the prevalence (p≤0.01) of men and women with good performance and an increase in the prevalence of incapacity or poor performance in all the tests. he best motor performance is speciic to the test, sex and age group. he men and the youngest age groups exhibit the best motor performance in all the tests.
Key words: Aging; Hand strength; Time and motion studies.
Resumo – O estudo teve como objetivo apresentar valores de referência e avaliar o desem-penho motor de idosos de uma comunidade do sul do Brasil, de acordo com sexo e grupo etário. Estudo populacional, de base domiciliar, realizado com 477 idosos (≥ 60 anos) do município de Antônio Carlos, SC. O desempenho motor foi veriicado por meio de quatro testes: força de preensão manual (Kg), equilíbrio estático (quatro tarefas), “sentar e levan-tar” e “pegar o lápis” (segundos). Foi usado escore de classiicação para todos os testes que variou de 0 (incapaz) a 3 (bom). Foram avaliadas 270 mulheres (73,2 ±8,82 anos) e 207 homens (73,3 ± 8,96 anos). Os resultados mostraram que os valores (médias, desvios padrão e percentis) dos homens, no teste de força de preensão manual, foram maiores do que os das mulheres e menores no testes avaliados por tempo. O teste qui-quadrado mostrou que os homens tiveram maior prevalência de desempenho “bom” nos testes “sentar e levantar”, equilíbrio e força de preensão manual, comparados às mulheres (p≤0,01). Com avanço da idade, houve redução na prevalência (p≤0,01) de homens e mulheres com desempenho bom e aumento na prevalência de incapacidade ou desempenho fraco, em todos os testes. O melhor desempenho motor é especíico ao teste, sexo e grupo etário. Os homens e os grupos etários mais jovens apresentam melhor desempenho motor, em todos os testes realizados.
1 Universidade Federal de Santa Catarina. Programa de Pós--graduação em Educação Física. Florianópolis, SC. Brasil
2 Universidade Federal de Santa Catarina. Programa de Pós-gradu-ação em Nutrição. Florianópolis, SC. Brasil
3 Universidade Federal de Santa Catarina. Bacharelado Educação Física. Florianópolis, SC. Brasil
Motor performance of elderly Confortin et al.
INTRODUCTION
Motor performance tests are important objective measures in the assess-ment of the functional health of the elderly, as they allow the identiica-tion of physical/motor capacity involved in the performance diverse tasks related to daily living1-3. he assessment of functional limitation through
these types of tests can be indicative of the process of disabilities3, as it can
predict cognitive deicit4, risk of fractures5,6, hospitalization7, morbidities
and mortality2,8. In addition, the motor tests can characterize current health
and assist in the delivery of intervention programs9.
In Brazil, there are few studies, with probabilistic samples and home collection that verify the motor performance of the elderly and present information regarding this performance in a way that provides a reference for the assessment of health. he ‘SABE Survey’10 involved elderly residents
in the urban area of the municipality of São Paulo. he study conducted by Pinheiro et al.11 involved elderly residents in city with unfavourable
socioeconomic conditions in north eastern Brazil. No studies involving elderly residents from rural areas, as in the south of the country, were found. Brazil is a country which still has divergent socio-demographic, cultural and economic characteristics12 and these characteristics may be relected
in living conditions, access to health care, health status and diferences in the motor performance of the elderly2,9-11. herefore, it is necessary to
conduct studies in various contexts, in order to have pertinent information from this contingent of the population. he objective of this study was to present reference values and assess the motor performance of the elderly from a community in the south of Brazil, where 71.5% of the elderly live in rural area, according to sex and age group13.
METHODS
his study, both population-and household-based, is part of the epidemio-logical research ‘Saúde – AC’, conducted in the municipality of Antônio Carlos, Santa Catarina (AC-SC). his municipality, 30 km from the capital of the state of Santa Catarina, in 2010, had a population of 7,458 inhabit-ants (12.8% were 60 or over), with 68.1% of the population residing in small, rural properties13. here is a Health Service Unity in the centre of
the Antônio Carlos, in addition to three teams from the Family Health Strategy programme(FHS) which cover 100% of the municipality.
following: absence of an adequate proxy respondent; individual absent from the municipality for a period longer than the ield research or following three home visits; inability to access to the home due to the rural road conditions.
All the elderly (n=134) from the municipality that were 80 or over were assessed (February to April 2010). he elderly that were 80 years or over before 31st of May 2010 were placed in the 80 or over age group; the rest in
the 60-79 age group.
We used a questionnaire based (short version) on the ‘SABE Survey’, a multicenter study undertaken in seven Latin American and Caribbean countries(http://hygeia.fsp.usp.br/sabe/Extras/Questionário_2000.pdf)14.
Data collection was conducted by undergraduate and postgraduate students (Physical Education and Nutrition) and by the research coordi-nator. he interviewers were trained prior to testing and reinement and calibration of the instrument (questionnaire and motor tests). he research coordinator was responsible for training and check the questionnaires.
he handgrip strength test (HGS) veriied the motor performance of the superior limbs. he inferior limbs were evaluated by three tests related to the function of strength/resistance, mobility, balance and agility: ‘chair stand’15,
‘pick up the pen’16, assessed by time and balance15. Tests procedures were
the same used in the ‘SABE Survey’9,10and will now be presented concisely.
Handgrip strength – assessed by a dynamometer (TAKEI), was taken using the arm that the subject considered dominant. he assessment was conducted twice with an interval of 1 minute and the highest value was recorded (kg). To assess the performance in the test, the values (kg) were distributed in percentiles, according to sex: unable = score 0 (unable); ≤ P25 = score 1 (poor); > P25 a ≤ P75 = score 2 (average); > P75 = score 3 (good). he ‘chair stand’ test15 – the elderly began the test in the sitting
posi-tion, arms crossed over the chest, ater which they attempted to stand and sit ive times, consecutively, as quick as possible, in ≤ 60 seconds. he performance in the test was veriied by way of value distribution (seconds) in percentiles, according to sex: score 0 (unable); ≤ P25 = score 1 (poor); > P25 a ≤ P75 = score 2 (average); > P75 = score 3 (good).
he ‘pick up the pen’ test16 – the individual should crouch, pick up the
pencil on the ground and return to the start position in ≤ 30 seconds. he performance in the test was veriied by way of value distribution (seconds) in percentiles, according to sex: score 0 (unable); ≤ P25 = score 1 (poor); > P25 a ≤ P75 = score 2 (average); > P75 = score 3 (good).
Balance15 – veriied by a test composed of 4 static tasks (10 seconds
each), conducted with the individual standing, in sequence: (a) side-by-side stand; (b) full tandem stand; (c) maintain balance when standing only on the right leg (one-leg stand); (d) maintain balance when standing only on the let leg (one-leg stand). he score were the following 9,10: unable (0) =
Motor performance of elderly Confortin et al.
Before each test the interviewers explained and demonstrated the test and made sure that the task could be completed without any physical risk to the elderly. We take care in relation the footwear of individuals (tests related to the lower limbs), i.e., tests were performed with the individual barefoot or using any irm shoe.
he elderly unable of understanding the instructions due to a cogni-tive problem were excluded from the analyses. he elderly with physical limitations were included in the score tests as unable9,10.
Information about family arrangements (living alone/accompanied), literacy (knows how to write and read - yes/no) and occupation throughout life (agriculture/other professions) were used to describe the sample.
For the descriptive analyses of the variables, measures, standard de-viation, percentiles and proportion of individuals were used according to sex and age group (60-69, 70-79 and ≥80). he Kruskal-Wallis test veri-ied the efect of the age group upon motor performance and the U test (Mann-Whitney) was used in the comparisons between men and women. he distribution of the individuals, according to the motor performance test scores, sex and age group were shown in tables, using the chi-squared test. he exact Fisher test was used in the cases in which any frequency
ex-pected was less than ive. he Spearman correlation was used to verify the
relation between the test scores and the motor performance, according to sex. All the analyses were weighted using the sample weight. he level of
signiicance adopted was 5% (α = 0.05). he data were doubly tabulated
and analysed using the statistic programme SPSS® 16.0.
he ethics committee of the Universidade Federal de Santa Catarina (Protocol No. 189/09) approved the study.
RESULTS
he study involved 270 women (73.2 ± 8.82 years) and 207 men (73.3 ± 8.96 years), aged between 60 and 100 years. he majority of the elderly lived accompanied in the home (86.9%), worked in agriculture/farming throughout life (70.1%) and stated they were able to read and write (82.1%). In the evaluation of motor performance, of the total 477 elderly anal-ysed, 42 were unable to complete any test related to the performance of the inferior limbs and were included in the analyzes with score 0. Were also included with score 0, seven, 16 and 8 subjects who failed to perform the ‘chair stand’ test, ‘pick up a pen’ and balance tests, respectively. he test of handgrip strength was not realized by 17 elderly.
he data from Table 3 shows the distribution of the men and women, according to sex and performance in the tests. he male sex presented a higher prevalence of individuals with better results in the ‘chair stand’, balance and HGS tests, when compared with the female sex. he women showed a higher prevalence in incapability and poor performance in the ‘chair stand’ and balance tests, when compared with the men. he difer-ences were signiicant between the sexes, in relation to performance in the ‘chair stand’ tests (p≤0.001), balance (p≤0.001) and HGS (p≤0.021).
Table 1. Means, standard deviation (SD) and medians, from the handgrip strength test (HGS), ‘chair stand’ and ‘pick up a pen’ according to sex and age group. Antônio Carlos, SC, Brazil, 2010/2011.
Tests
Age Group
60-69 70-79 ≥ 80 All
Mean ± SD Median Mean ± SD Median Mean ± SD Median Mean ± SD Median Handgrip (kg)
Female (263) * 22.4 ± 5.8 23.0a 21.7 ± 5.8 21.0b 19.0 ± 5.2 20.0b 21.7 ± 5.8† 22.0
Male (197) * 38.1 ± 8.8 40.0a 29.2 ± 7.2 29.0b 29.9 ± 7.0 31.0b 33.5 ± 9.1† 34.0
‘Chair stand’ (s)
Female (226) 14.2 ± 6.9 13.0 14.2 ± 4.9 13.0 15.0 ± 5.7 13.5 14.3 ± 6.2† 13.0
Male (182) 12.0 ± 4.6 11.0 12.8 ± 4.6 12.0 13.0 ± 4.6 12.0 12.4 ± 4.6† 11.9
‘Pick up a pen’ (s)
Female (233) * 2.2 ± 1.5 2.0a 2.3 ± 1.9 2.0a 3.4 ± 1.9 3.0b 2.4 ± 1.7† 2.0
Male (185) * 1.9 ± 1.2 2.0a 2.0 ± 1.2 2.0a 2.7 ± 1.3 2.0b 2.0 ± 1.2† 2.0
†Signiicant diferences (p<0.05) between the sexes (Mann-Whitney).* Values in reference to the comparison between the age groups (Kruskal Wallis test).
a,b - values with diferent superscript letters were signiicantly diferent (Mann-Whitney).
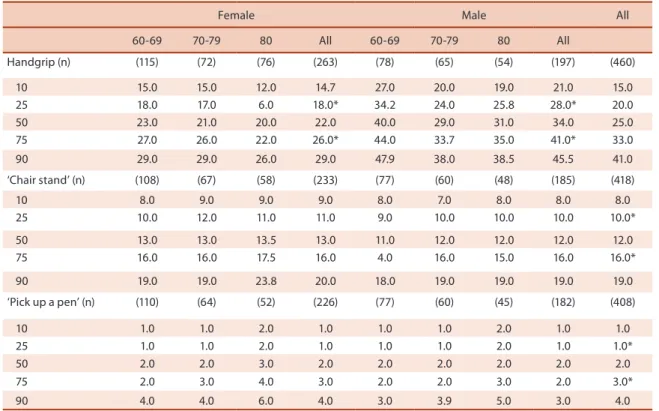
Table 2. Percentiles of time spent conducting the ‘chair stand’ test (seconds), ‘pick up a pen’ test (seconds) and handgrip strength test (kg), according to sex and age group. Antônio Carlos, SC, Brazil, 2010/ 2011.
Female Male All
60-69 70-79 80 All 60-69 70-79 80 All
Handgrip (n) (115) (72) (76) (263) (78) (65) (54) (197) (460)
10 15.0 15.0 12.0 14.7 27.0 20.0 19.0 21.0 15.0
25 18.0 17.0 6.0 18.0* 34.2 24.0 25.8 28.0* 20.0
50 23.0 21.0 20.0 22.0 40.0 29.0 31.0 34.0 25.0
75 27.0 26.0 22.0 26.0* 44.0 33.7 35.0 41.0* 33.0
90 29.0 29.0 26.0 29.0 47.9 38.0 38.5 45.5 41.0
‘Chair stand’ (n) (108) (67) (58) (233) (77) (60) (48) (185) (418)
10 8.0 9.0 9.0 9.0 8.0 7.0 8.0 8.0 8.0
25 10.0 12.0 11.0 11.0 9.0 10.0 10.0 10.0 10.0*
50 13.0 13.0 13.5 13.0 11.0 12.0 12.0 12.0 12.0
75 16.0 16.0 17.5 16.0 4.0 16.0 15.0 16.0 16.0*
90 19.0 19.0 23.8 20.0 18.0 19.0 19.0 19.0 19.0
‘Pick up a pen’ (n) (110) (64) (52) (226) (77) (60) (45) (182) (408)
10 1.0 1.0 2.0 1.0 1.0 1.0 2.0 1.0 1.0
25 1.0 1.0 2.0 1.0 1.0 1.0 2.0 1.0 1.0*
50 2.0 2.0 3.0 2.0 2.0 2.0 2.0 2.0 2.0
75 2.0 3.0 4.0 3.0 2.0 2.0 3.0 2.0 3.0*
90 4.0 4.0 6.0 4.0 3.0 3.9 5.0 3.0 4.0
Motor performance of elderly Confortin et al.
he percentile distribution shows the values employed to determine the categories of motor performance (percentiles 25 and 75).
Table 3. Distribution (%) of the elderly according to sex and performance in the tests. Antônio Carlos, SC, Brazil, 2010/11.
Unable Poor Average Good p*
‘Chair stand’
Female 10.7 19.0 50.9 19.4
≤0.001
Male 9.8 15.4 40.6 34.2
Total 10.3 17.4 46.4 25.8
‘Pick up a pen’
Female 8.7 2.8 22.4 66.1
0.465
Male 8.8 1.5 19.8 69.8
Total 8.8 2.2 21.3 67.7
Balance
Female 9.3 19.8 29.5 41.4
≤0.001
Male 8.8 8.2 17.0 66.0
Total 9.1 14.8 24.1 51.9
Handgrip
Female 1.2 15.5 46.4 37.0
≤ 0.021
Male 4.1 16.5 40.9 38.6
Total 2.4 15.9 44.0 37.7
*Chi-square Test.
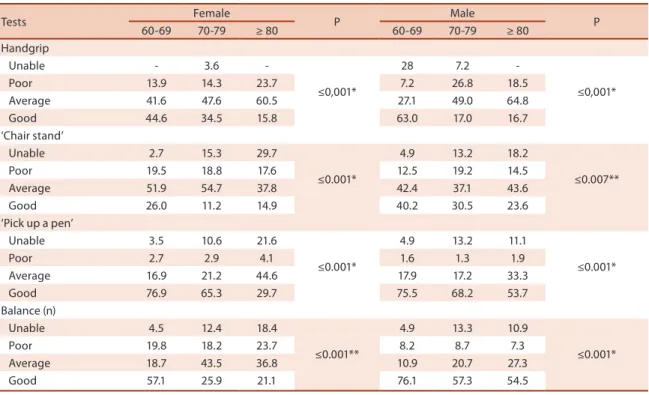
With the advance of age, women and men present signiicant difer-ences in performance in the four tests. Between the men, the prevalence of better performance reduced, in all the tests, with the advance of age. For the female sex, in the ‘chair stand’ test, the women aged 80+ exhibited better prevalence of good performance than those aged 70-79 (Table 4).
Table 4. Distribution (%) of the elderly according to age groups, sex and performance in the tests. Antônio Carlos, SC, Brazil, 2010/11.
Tests Female P Male P
60-69 70-79 ≥ 80 60-69 70-79 ≥ 80
Handgrip
Unable - 3.6
-≤0,001*
28 7.2
-≤0,001*
Poor 13.9 14.3 23.7 7.2 26.8 18.5
Average 41.6 47.6 60.5 27.1 49.0 64.8
Good 44.6 34.5 15.8 63.0 17.0 16.7
‘Chair stand’
Unable 2.7 15.3 29.7
≤0.001*
4.9 13.2 18.2
≤0.007**
Poor 19.5 18.8 17.6 12.5 19.2 14.5
Average 51.9 54.7 37.8 42.4 37.1 43.6
Good 26.0 11.2 14.9 40.2 30.5 23.6
‘Pick up a pen’
Unable 3.5 10.6 21.6
≤0.001*
4.9 13.2 11.1
≤0.001*
Poor 2.7 2.9 4.1 1.6 1.3 1.9
Average 16.9 21.2 44.6 17.9 17.2 33.3
Good 76.9 65.3 29.7 75.5 68.2 53.7
Balance (n)
Unable 4.5 12.4 18.4
≤0.001**
4.9 13.3 10.9
≤0.001*
Poor 19.8 18.2 23.7 8.2 8.7 7.3
Average 18.7 43.5 36.8 10.9 20.7 27.3
Good 57.1 25.9 21.1 76.1 57.3 54.5
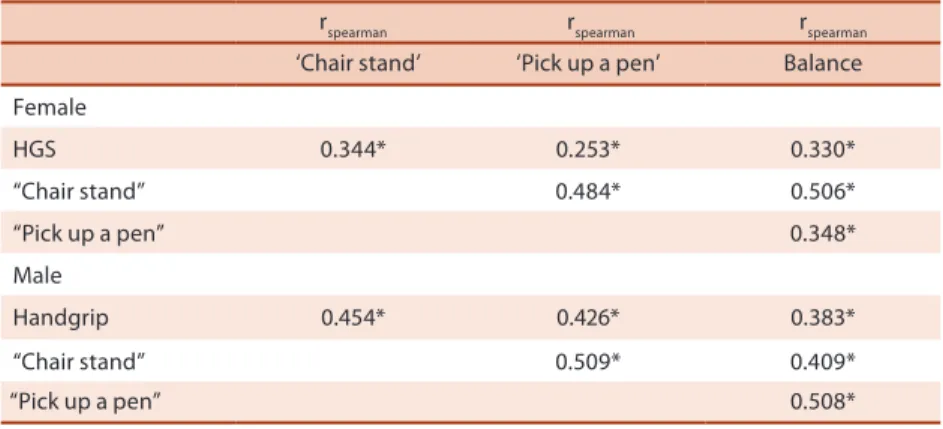
Table 5. Spearman correlation coeicient for testing motor performance in elderly. Antônio Carlos, SC, Brazil, 2010/2011.
rspearman rspearman rspearman
‘Chair stand’ ‘Pick up a pen’ Balance
Female
HGS 0.344* 0.253* 0.330*
“Chair stand” 0.484* 0.506*
“Pick up a pen” 0.348*
Male
Handgrip 0.454* 0.426* 0.383*
“Chair stand” 0.509* 0.409*
“Pick up a pen” 0.508*
* p ≤ 0.01
DISCUSSION
According to our knowledge, this is the irst home-based population study in Brazil that presents reference values and assesses the motor performance of elderly in rural and urban areas. he previous studies covered urban areas only10,11.
he results showed that the men exhibited superior values to the women in the HGS, completed the tests in less time and had a higher prevalence in good performance in all the tests, as is described in the literature9-11.
he women exhibited the higher percentage of incapability and/or poor performance in the tests. With advancing age, male and female showed a reduction in the proportion of individuals with better results in all tests.
he diferences between the sexes in motor performance may be ex-plained by the hormonal characteristics and their efects on body compo-sition17. he women exhibit a higher quantity of body fat while the men
showed higher levels of testosterone and a higher quantity of muscle mass. he women are more afected by chronic diseases that cause pain and limit joint movements18 and exhibit a higher prevalence of excess weight10, factors
that hinder mobility19 and balance2,20. It is believed that the lifestyle of men,
working in farming, could have contributed to the better performance in the tests, even at more advanced ages.
Comparing the results of the present study with other studies that used the same test protocols and instruments, can be veriied that men and women from AC-SC showed higher values of HGS, compared to the elderly from São Paulo10, Barbados and Cuba9. In São Paulo were
evalu-ated 1894 elderly aged 60 years or more, and in Barbados and Cuba9, 1508
and 1905 elderly were evaluated, respectively. he men from AC-SC, were faster than those of Cuba9 and of São Paulo10 in the ‘chair stand’ test and
Motor performance of elderly Confortin et al.
from AC-SC completed the ‘chair stand’ test in an inferior time than the women from Cuba9. In the ‘pick up a pen’ test the women from this study
were faster than the women from Cuba, Barbados9 and São Paulo10.
In relation to the percentile distribution, the values used to deine the categories of performance were equal to those observed in the ‘SABE Sur-vey’ São Paulo10 for the ‘chair stand’ test and to those from Barbados9 and
Lafaiete Coutinho-BA11 in the ‘pick up a pen’ test. In the HGS the elderly
from AC-SC exhibited higher values than those of the elderly from São Paulo10, Lafaiete Coutinho-BA11, Barbados and Cuba9. However, it is worth
noting that the study by Pinheiro et al.11 used a diferent dynamometer to
that used in AC-SC, São Paulo10, Barbados and Cuba9, which may interfere
in the identiied values.
he comparison with other populations, even using the same methodol-ogy and instruments should be viewed with caution. he diferences may be due to diferences in the criteria used for the sample selection and/or exclusion of elderly, number of participants, the better ability of individuals, ethnic diferences, environmental inluences10 and willingness to
partici-pate, besides diferences in nutritional status and physical activity level. he results showed that the prevalence of individuals with better per-formance was speciic to each test, varying between sex and age group. However, with the advance of age, men and women showed a decrease in the prevalence of good performance and the increase in the percentage of those unable or with poor performance as veriied in other studies9,10,21.
he highest prevalence of chronic disease, the reduction of physical ac-tivity, in addition to the normal physiological alterations of aging (reducing of muscle mass, the decline in the levels of determined hormones17, cognitive
decline22, alterations in the sensory systems23 and the nutritional status20,
among others), may explain the motor decline with the advance of age. he correlations between motor performance scores for both sexes were positive and signiicant between all tests, suggesting that elderly that exhibit good performance in the irst task tend to present similar performance in the second. hese indings are similar to those veriied in the ‘SABE Survey’/São Paulo10 and the study conducted in Lafaiete Coutinho-BA11.
Data from this study showed that the men and the youngest elderly exhib-ited better performance in the motor tests, compared to the women and the eldest individuals, respectively. he highest prevalence of incapability and best motor performance is speciic to the test, sex and age group.
Acknowledgments
he authors want to thank Antonio Carlos’ Board of Health and Social As-sistance, the Health Community Agents, and the oldest old attendees on this research. Our thanks also go to the National Council of Technological and Scientiic Development (CNPq- Process 478073/2009-7), for inancing the project. Meneghini V. received a scholarship grant from National Council of Technological and Scientiic Development (PIBIC); Confortin S.C. and Danielewicz A.L. received a master’s scholarship grant from Coordination of Improvement of Higher Education in Brazil (Capes-Reuni).
REFERENCES
1. Guralnick JM, Ferruci L. Assessing the building blocks of function utilizing meas-ures of functional limitation. Am J Prev Med 2003;25(3 Suppl):112-21.
2. Castaneda-Sceppa C, Price LL, Noel SE, Midle JB, Falcon LM, Tucker KL. Physical function and health status in aging Puerto Rican adults: the Boston Puerto Rican health study. J Aging Health 2010;22(5):653-72.
3. Seidel D, Brayne C, Jagger C. Limitations in physical functioning among older people as a predictor of subsequent disability in instrumental activities of daily living. Age Ageing 2011;40(4):463-9.
4. Wang L, Larson EB, Bowen JD, van Belle G. Performance-based physical function and future dementia in older people. Arch Intern Med 2006;166(10):1115-20.
5. Piirtola M, Vahlberg T, Isoaho R, Aarnio P, Kivela SL. Predictors of fractures among the aged: a population-based study with 12-year follow-up in a Finnish municipal-ity. Aging Clin Exp Res 2008;20(3):242-52.
6. Ensrud KE, Ewing SK, Cawthon PM, Fink HA, Taylor BC, Cauley JA, et al. A comparison of frailty indexes for the prediction of falls, disability, fractures, and mortality in older men. J Am Geriatr Soc 2009;57(3):492-8.
7. Cawthon PM, Fox KM, Gandra SR, Delmonico MG, Chiou C, Anthony MS, et al. Do muscle mass, muscle density, strength and physical function similarly inlu-ence risk of hospitalization in older adults? J Am Geriatr Soc 2009; 57(8):1411-9.
8. Silventoinen K, Magnusson PK, Tynelius P, Batty GD, Rasmussen F. Association of body size and muscle strength with incidence of coronary heart disease and cerebrovascular diseases: a population-based cohort study of one million Swedish men. Int J Epidemiol 2009;38(1):110-8.
9. Barbosa AR, Miranda LM, Guimarães AV, Corseuil HX, Corseuil MW. Age and gender diferences regarding physical performance in the elderly from Barbados and Cuba. Rev Saude Publica 2011;13(1):54-66.
10. Barbosa AR, Souza JMP, Lebrão ML, Marucci MFN. Functional limitations of Brazilian elderly by age and gender diferences: data from SABE Survey. Cad Saúde Pública 2005;21(4):1177-85.
Motor performance of elderly Confortin et al.
Corresponding author
Aline Rodrigues Barbosa Departamento de Educação Física – Centro de Desportos
Universidade Federal de Santa Catarina - Campus Trindade. 88940 – Florianópolis, SC. Brasil E-mail: [email protected] [email protected]
12. Massuquetti A, Franco Junior MCR. O sul e o Nordeste no Brasil: Uma análise das diferenças no desenvolvimento socioeconômico destas regiões. II Encontro de Economia Catarinense, Chapecó, SC, 2008. Available from: <http://www.apec. unesc.net/II%20EEC/sessoes_tematicas/Especiais/Artigo7.pdf> [2012 Set 15].
13. Instituto Brasileiro de Geograia e Estatística (IBGE). Censo 2010. Available from: <http://www.ibge.gov.br/censo2010/> [2012 Jun 20].
14. Lebrão ML, Laurenti R. Saúde, bem-estar e envelhecimento: o estudo SABE no município de São Paulo. Rev Bras Epidemiol 2005;8(2):127-41.
15. Guralnik JM, Simonsick EM, Ferrucci L, Glynn RJ, Berkman LF, Blazer DG, et al. A short physical performance battery assessing lower extremity function: associa-tion with self-reported disability and predicassocia-tion of mortality and nursing home admission. J Gerontol Med Sci 1994;49(2):M85-M94.
16. Reuben DB, Siu AL. An objective measure of physical function of elderly outpatients – he Physical Performance Test. J Am Geriatr Soc 1990;38:1105-12.
17. Valentine RJ, Misic MM, Rosengen KS, Woods JA, Evans EM. Sex impacts the rela-tion between body composirela-tion and physical funcrela-tion in older adults. Menopause 2012;16(3):518–23.
18. Kim IH, Chun H, Kwon JW. Gender diferences in the efect of obesity on chronic diseases among the elderly Koreans. J Korean Med Sci 2011;26(2):250-7.
19. Koster A, Penninx BWJH, Newman AB, Visser M, van Gool CH, Harris TB, et al. Lifestyle factors and incident mobility limitation in obese and non-obese older adults. Obesity 2007;15(12):3122-32.
20. Barbosa AR, Souza JMP, Lebrão ML, Marucci MDFN. Estado nutricional e desem-penho motor de idosos de São Paulo. Rev Assoc Med Bras 2007;53(1):75-9.
21. Schlüssel MM, Anjos LA, Vasconcellos MTL, Kac G. Referente values of hand-grip dynamometry of health adults: A populatin-based study. Clin Nutr 2008; 27(4):601-7.
22. Kato-Narita EM, Nitrini R, Radanovic M. Assessment of balance in mild and moderate stages of Alzheimer’s disease. Arq Neuropsiquiatr 2011;69(2-A):202-7.