Introduction
Range of motion (ROM), an important parameter used in the assessment, planning and development of physical therapy treatment,makes it possible, besides identifying joint limitations, to assess quantitatively, through instruments, the eficiency of therapeutic programs1,2. For an instrument to be employed, it is necessary that it presents reproducibility and reliability to demonstrate consistency between successive measurements of the same variable in the same subject and the same conditions3.
Among the methods most used to quantify ROM in physical therapy practice, manual goniometry, measured by the universal goniometer (UG), is considered the gold standard4. However, despite being inexpensive and easy to apply, this instrument is rater-dependent5, and therefore, its use has shown conlicting results between studies6-8. However, other studies3,9,10, showed “poor” to “excellent” reliability indices for the upper and lower limbs joints, respectively, although Aalto, Airaksinem, Harkonen, Arokoski11found low reliability in measurements of the knee joint.
More recently, following the technological evolution, the use of computerized photogrammetry has been featured in the measurement of ROM, through recording, measuring and interpreting photographic images12 using software that allows measuring angles and horizontal and vertical distances for various purposes3,14. Even when compared to goniometry, this method has shown high consistency inter- and Intra-rater14,15; however, similar to the study by Iunes, Castro, Salgado,
Moura, Oliveira, Bevilaqua-Grossi16, the repeatability of the method is also low.
Even though the manual goniometer is an old method and widely used by physiotherapists in their daily lives mainly due to its ease of use, reliable and detailed assessments of patients are essential for the clinical success of a therapeutic program. Considering the existence of different instruments for measur-ing ROM, there is still a shortage of studies ratifymeasur-ing the use of computerized photogrammetry as an alternative to manual goniometry in the recording of joint measurements, speciically in the range of active knee extension. In addition, the photo-graphic register during the physical examination can facilitate the identiication of important joint deicits, not displayed at the time of physical therapy assessment.
Thus, the hypothesis of this study was that the measurement of active knee extension ROM by photogrammetry was as ac-curate and reliable as manual goniometry. Therefore, the aim of this study was to evaluate and inter-instrument reliability for the active ROM of knee extension after stretching programs in active and uninjured individuals.
Methods
The sample consisted of 53 active and healthy male students, recruited by convenience through electronic disclosure and personal contact at the Federal University Original Article (short paper)
Intra-rater and Inter-instrument Reliability on
Range of Movement of Active Knee Extension
Germanna de Medeiros Barbosa
Universidade Federal de São Carlos, São Carlos, SP, Brasil
Heleodório Honorato dos Santos
Universidade Federal da Paraíba, João Pessoa, PB, Brasil
Glauko André de Figueirêdo Dantas Bianca Rodrigues da Silva
Scheila Marisa Pinheiro Wouber Hérickson de Brito Vieira
Universidade Federal do Rio Grande do Norte, Natal, RN, Brasil
Abstract — The objective of the present study was to evaluate the reliability of intra-rater and inter-instrument measures during two lexibility programs. Fifty-three active and healthy males, aged between 18 and 28 years old, were randomly included in three groups: control (Cg, n = 18), static stretching (SSg, n = 17), and dynamic stretching (DSg, n = 18). All participants underwent measurements of their active range of knee extension using manual goniometry and computerized photogrammetry, measured in four separated assessments and analyzed using the SPSS, with a£5%. Both methodologies presented very strong intra-rater reliability(ICC: 0.91³0.99; P<0.001) at all four assessments in all the groups, and the instruments showed weak (r: 0.31–0.6) to strong(r: 0.61–0.9) correlation, in the Cg (P<0.05) and strong (r: 0.61–0.9) in the SSg and DSg (P<0.01),although without differences between groups, indicating that the measures are equally reliable, regardless of interventions.
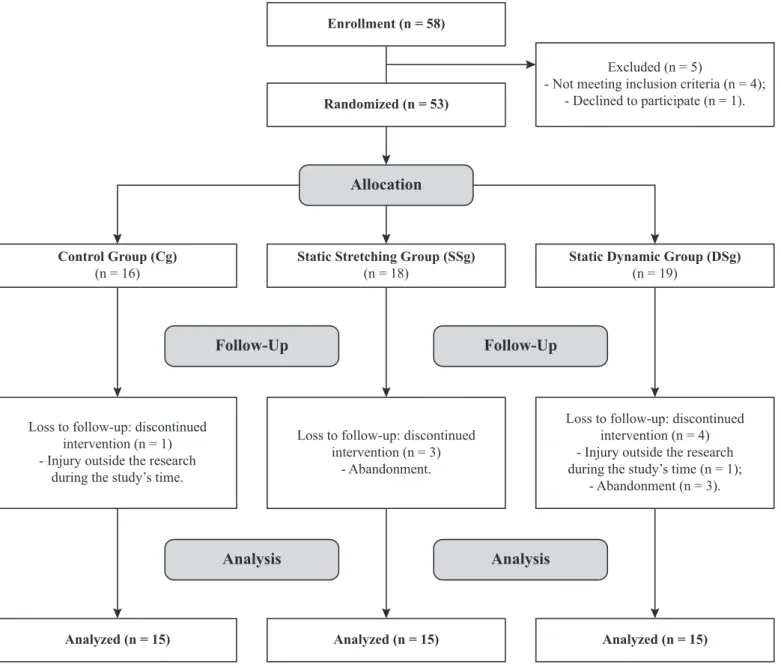
of Rio Grande do Norte (UFRN) and randomly assigned (www.randomization.com) to three groups: 1) control (Cg, n = 18; 21.27 ± 2.8 years; 74.38 ± 9.2 kg; 1.76 ± 0.1 m; BMI: 23.94 ± 1 8 kg/m2); 2) static stretching (SSg, n = 17;
23.07 ± 3.5 years; 68.07 ± 9.0 kg; 1.72 ± 0.1 m; BMI: 22.98 ± 2.7 kg/m2); and 3) dynamic stretching (DSg, n = 18; 21.47 ± 3.0 years; 72.06 ± 8.2 kg; 1.74 ± 0.1 m; BMI: 23.68 ± 1.3 kg/m2), as shown in Figure 1.
The inclusion criteria for the study were: 1) male; 2) aged between 18 and 28 years old; 3) normal weight, with body mass index (BMI) of 21–25 kg/m2; 4) no history of injury, trauma or diseases in the lower limb in the last six months; 5) do not have health limitations, according to the Readiness Physical Activity Questionnaire –PAR-Q17; 6) practice physical activity (recreational, not competitive level) at least three times a week; 7) ROM limitation of at least 15° of active knee extension18 in the assessed limb (considering 180°as full knee extension with hip positioned at 90° of lexion).
After the study was approved by the Research Ethics Committee of the Science and Health Center of the Federal
University of Rio Grande do Norte (CEP/CCS/UFRN), under the protocol n. 1132671, Presentation Certiicate for Ethics Appreciation (PCEA): 30168614.8.0000.5188, all subjects were instructed about the procedures and signed a consent form, according to the Resolution 466/2012 of the National Health Council (NHC) and Declaration of Helsinki.
Procedure and assessment measures
Active knee extension ROM measurements were carried out in four separate assessments, using universal goniometer (GU) Enrollment (n = 58)
Loss to follow-up: discontinued intervention (n = 1) - Injury outside the research
during the study’s time.
Loss to follow-up: discontinued intervention (n = 3)
- Abandonment.
Loss to follow-up: discontinued intervention (n = 4) - Injury outside the research during the study’s time (n = 1);
- Abandonment (n = 3). Excluded (n = 5)
- Not meeting inclusion criteria (n = 4); - Declined to participate (n = 1). Randomized (n = 53)
Analyzed (n = 15) Analyzed (n = 15) Analyzed (n = 15)
Analysis Analysis
Allocation
Static Stretching Group (SSg) (n = 18)
Static Dynamic Group (DSg) (n = 19)
Control Group (Cg) (n = 16)
Follow-Up Follow-Up
and computerized photogrammetry. For the Cg, evaluations were performed with the same frequency of the intervention groups, however its participants did not perform the stretching techniques. The irst researcher, who has expertise in this mea -surement technique, was responsible for the mea-surements and the second was responsible for recording the data.
For the groups that underwent the sessions of static and dy-namic stretching (SSg and DSg), the irst assessment (A1) was performed at least 48 hours before the irst stretching session, while the other assessments, (A2, A3 and A4), were performed, respectively, immediately after the irst session,tenth session and 48 hours after the third assessment.
G*Power 3.1.0 software was used for the sample calculation and all procedures were performed according to previous stud-ies19. Based on a pilot study of nine volunteers, a power of 0.95 was adopted (level of signiicance = 5%, correction coeficient = 0.5, effect size = 0.25). An “n”= 15 volunteers for each group (“n” sample = 45) were calculated in order to provide a sample size with 95.5% statistical power.
Universal goniometry
A universal goniometer (Carci®, unit = degrees) was used, as well as an examination table and a wooden device, developed for positioning and ixating the subjects legs. This wooden device consists of two vertical bars ixed on the sides of the examination table and a horizontal bar used to connect the vertical bars together20.
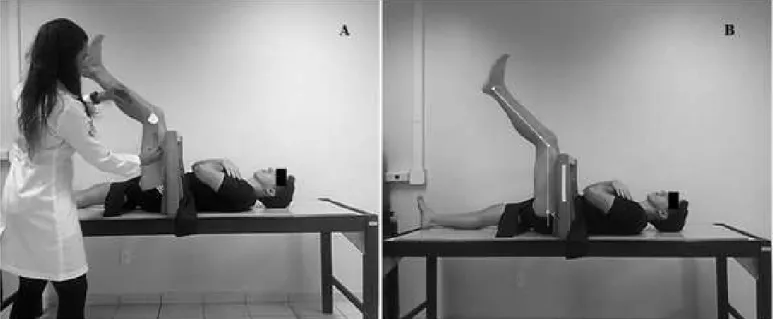
The subjects were positioned supine with their arms crossed on their chest, while the hip and knee of the non-dominant limb (NDL) were lexed at 90°, so that the ante -rior thigh remained supported on the horizontal crossbar, limiting hip lexion. A stabilization strap was used on the pelvis at the anterior superior iliac spines region (ASIS)
and another ixed the dominant lower limb at the lower third of the thigh (Figure 2A). The subjects were then in-structed to actively move their leg toward knee extension. The NDL was chosen because it is less skilled and more trainable than the dominant limb (DL). In order to identify limb dominance, the participants were asked which limb they prefer to use to kick a ball21.
The assessment using the universal goniometer was “blind” and its pivot was covered with cardboard in order to not inlu -ence subsequent measurements22. The instrument was placed on the lateral side of the knee, with the axis coinciding with the lateral epicondyle of the femur, the ixed arm was aligned with the greater trochanter of the femur and the moving arm with the lateral malleolus. Each subject had their knee extension angle measured three times, in all assessments, and the register was taken by a second examiner.
Computerized photogrammetry
After goniometric assessment, the subjects remained in the same position for image-capturing, using a digital camera (Canon® G7x- Japan) that was mounted on a tripod, positioned 2.5 me-ters away from the examination table and aligned with each subject’s knee joint.
Four passive markers were set on the following anatomical reference points: greater trochanter of the femur (GTF); lateral epicondyle of the femur (LEF); ibular head (FH); and lateral mal -leolus (LM). Image JSoftware (Bethesda, MA, USA) was used to analyze the images, which generate the active knee extension angle by matching the GTF lines with the LEF, and the FH lines with the LM (range; Gama, Dantas, Souza23), as shown in Figure 2B. Only one image was captured, however, it was analyzed three times by the irst examiner and registered on a spreadsheet by a second examiner to avoid any induction of results.
Statistical analysis
Statistical analysis was performed using the Statistical Package for Social Sciences software (SPSS 20.0). Initially, the normality of data (Shapiro-Wilk test) and homogene-ity of variances (Levene test) were observed, followed by the intra-class correlation coeficient [ICC1,1; Model1 (one way) and Forms1 (single measures),respectively]in the comparison between the ROM measures in all analyzed groups (control, static and dynamic), the Pearson test to analyze the correlation between instruments (Goniometry × Photogrammetry) and the ANOVA to compare the difference inter-group and inter-instrument, adopting a signiicance level of 5% in all comparisons.
For Pearson correlation coeficient (r) analysis, the fol -lowing classiication was considered9: null = 0.0; very weak = 0.01–0.3; weak= 0.31–0.6; strong = 0.61–0.9; very strong 0.91–0.99; and full = 1.0.
Results
According to Table 1, the results of intra-rater intra-class cor-relation coeficients (ICC1,1) found in the three measurements performed during the active knee extension movement showed very strong reliabilities (ICC
1,1: 0.91³0.99; P<0.001)in the mea-surements with UG, in each one of the four assessments, in all groups (control, static and dynamic), except for the A4_SSg, which had a strong reliability (ICC1,1: 0.815; P<0.001).
Table 1 Intra-rater intra-class correlation coeficient (ICC1,1) values for active knee extension range of motion with manual goniometry
Assessment/groups
Measurements
1 2 3 P-value ICC1,1
A1_Cg 138.9±7.8 139.9±8.0 140.4±7.8 0.0001 0.974
A2_Cg 136.2±7.9 137.7±7.4 136.8±9.0 0.0001 0.967
A3_Cg 139.3±9.8 139.5±9.2 138.9±9.6 0.0001 0.981
A4_Cg 138.4±9.4 139.2±9.7 139.4±10.8 0.0001 0.973
A1_SSg 135.9±11.5 137.1±12.0 136.9±10.7 0.0001 0.981
A2_SSg 136.2±14.6 136.4±14.4 139.4±14.1 0.0001 0.989
A3_SSg 140.4±13.8 140.9±12.9 140.9±12.6 0.0001 0.986
A4_SSg 138.0±13.9 132.9±30.2 140.0±14.5 0.0001 0.815
A1_DSg 135.6±9.8 136.4±10.1 135.9±10.1 0.0001 0.975
A2_DSg 136.5±11.4 136.4±10.8 136.4±10.2 0.0001 0.976
A3_DSg 138.9±8.9 140.8±8.2 140.8±7.7 0.0001 0.959
A4_DSg 139.1±9.0 138.9±10.4 140.4±10.5 0.0001 0.990
Measurements of groups expressed in mean±SD.
Legend: A1 = assessment 1; A2 = assessment 2; A3 = assessment 3; A4 = assessment 4; Cg = control group; SSg = static stretching group; DSg= dynamic stretching group.
Note: ICC1,1 = Model1 (one way) and Forms1(single measures) of the intra-class correlation coeficient (Cronbach’s alpha), respectively.
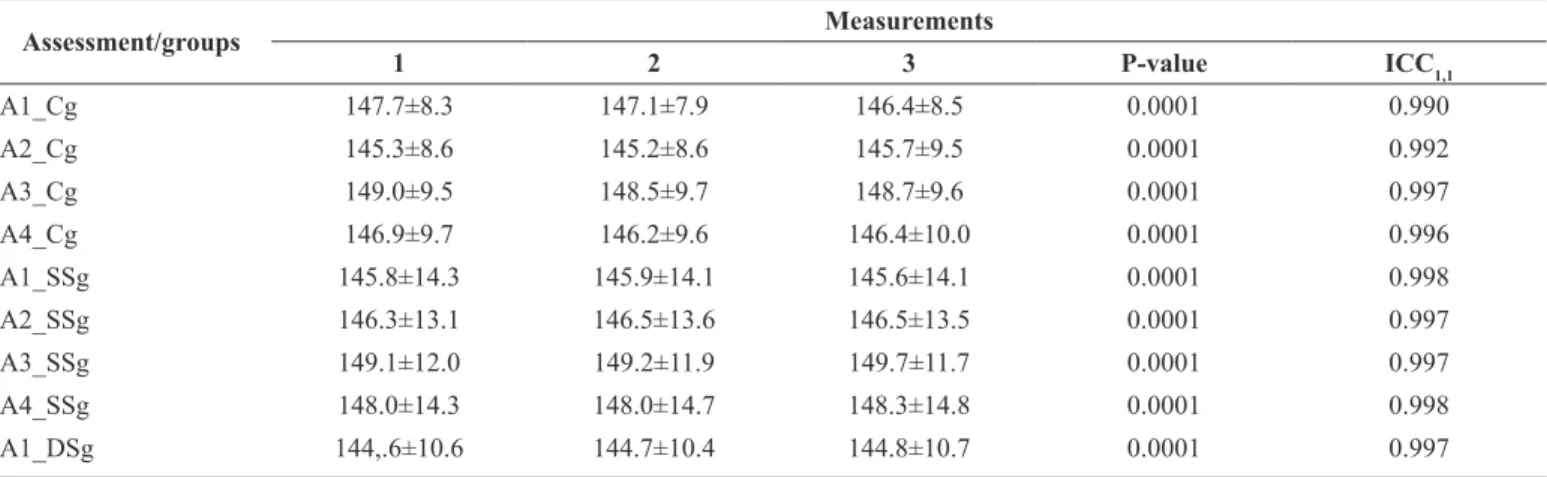
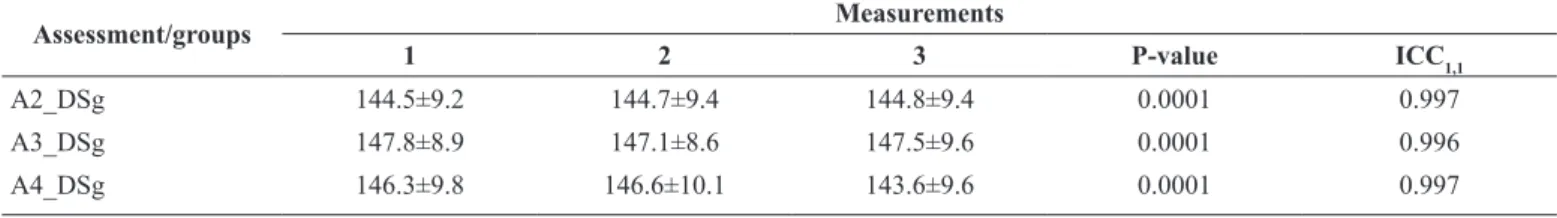
Moreover, regarding the intra-rater comparison of active knee ex-tension ROM performed with photogrammetry (Table 2), very strong
and highly signiicant intra-class correlation coeficients (ICC1,1) (ICC1,1: 0.91³0.99; P<0.001) were found in assessments of all groups.
Table 2 Intra-raterintra-class correlation coeficient (ICC1,1) values for active knee extension range of motion with computerized photogrammetry
Assessment/groups Measurements
1 2 3 P-value ICC1,1
A1_Cg 147.7±8.3 147.1±7.9 146.4±8.5 0.0001 0.990
A2_Cg 145.3±8.6 145.2±8.6 145.7±9.5 0.0001 0.992
A3_Cg 149.0±9.5 148.5±9.7 148.7±9.6 0.0001 0.997
A4_Cg 146.9±9.7 146.2±9.6 146.4±10.0 0.0001 0.996
A1_SSg 145.8±14.3 145.9±14.1 145.6±14.1 0.0001 0.998
A2_SSg 146.3±13.1 146.5±13.6 146.5±13.5 0.0001 0.997
A3_SSg 149.1±12.0 149.2±11.9 149.7±11.7 0.0001 0.997
A4_SSg 148.0±14.3 148.0±14.7 148.3±14.8 0.0001 0.998
A1_DSg 144,.6±10.6 144.7±10.4 144.8±10.7 0.0001 0.997
However,for inter-instrument comparison (Table 3),Pearson test showed weak (r: 0.31–0.6) to strong (r: 0.61–0.9) correlations, in the assessments of the Cg (P<0.05); strong (r: 0.61–0.9) in all assessments of the SSg (P<0.01); and strong (r: 0.61–0.9) to very strong (r: 0.91–0.99) in the assessments of the DSg (P<0.01).
In addition, the ANOVA test showed that there was dif-ference inter-instrument (F = 21.149; P<0.001), with higher means obtained with photogrammetry;however, no difference was found between the groups (F = 0.157; P = 0.855). ...continuation
Assessment/groups Measurements
1 2 3 P-value ICC1,1
A2_DSg 144.5±9.2 144.7±9.4 144.8±9.4 0.0001 0.997
A3_DSg 147.8±8.9 147.1±8.6 147.5±9.6 0.0001 0.996
A4_DSg 146.3±9.8 146.6±10.1 143.6±9.6 0.0001 0.997
Measures of groups expressed in mean ± SD.
Legend: A1 = assessment 1; A2 = assessment 2; A3 = assessment 3; A4 = assessment 4; Cg = control group; SSg = static stretching group; DSg = dynamic stretching group.
Note: ICC1,1 = Model1 (one way) and Forms1(single measures) of the intra-class correlation coeficient (Cronbach’s alpha), respectively.
Table 3- Measurements of correlation inter-instruments (goniometry×photogrammetry) of active knee extension movement
Measurements Instruments
Goniometry Photogrammetry P-value “r”value CI 95%
A1_Cg 139.8±7.6 147.1±7.9 0.0001 0.825 0.72-0.89
A2_Cg 136.9±7.9 145.4±8.8 0.0190 0.563 0.36-0.72
A3_Cg 139.2±9.3 148.7±9.6 0.0160 0.573 0.40-0.73
A4_Cg 139.0±9.8 146.5±9.7 0.0040 0.659 0.22-0.78
A1_SSg 136.7±11.2 145.7±13.7 0.0001 0.778 0.65-0.87
A2_SSg 137.4±14.2 146.4±13.4 0.0010 0.748 0.60-0.85
A3_SSg 140.7±12.9 149.3±11.8 0.0001 0.838 0.74-0.90
A4_SSg 138.9±14.2 148.1±14.6 0.0001 0.814 0.70-0.89
A1_DSg 135.9±9.5 144.7±7.9 0.0001 0.912 0.86-0.95
A2_DSg 136.6±10.3 145.1±9.2 0.0060 0.621 0.43-0.76
A3_DSg 140.7±8.2 148.3±9.4 0.0001 0.840 0.74-0.90
A4_DSg 140.1±9.9 147.2±10.0 0.0001 0.866 0.80-0.92
Measures of groups expressed in mean ± SD.
Legend: A1 = assessment 1; A2 = assessment 2; A3 = assessment 3; A4 = assessment 4; Cg = control group; SSg = static stretching group; DSg = dynamic stretching group. Note: r = Pearson correlation coeficient; CI = Conidence interval.
Discussion
For the present study, regardless of the instrument used, there was very strong reliability between the three measures performed by the same examiner, in each one of the four assessments, to all groups. Similarly,both goniometry and photogrammetry had strong to very strong correlations, although this methodology achieved higher values of ROM in all measures. These results conirm the hypothesis initially suggested that the measurement of active knee extension ROM through photographic analysis is as precise and trustable as the UG, and is considered gold standard for ROM assessments4.
The data demonstrated a small variability in intra-rater reliability indexes among the measures for both instruments. Previous studies24 showed that a goniometric measurement error of ± 5° can be clinically acceptable in most situations, however,
when facing deinitive clinical decisions, such as in surgery cases, it may be less appropriate. According to the results shown here and observing only the repetitiveness of the three measurements in the groups without considering the effect from the intervention, there was an average change of 4.3° (0.5–4.8°) for goniometry and 2.5° (0.2–2.7°) for photogrammetry. These indings prove that both methods were clinically consistent and reproducible by the same examiner, although the data from photogrammetry showed greater reliability and repeatability when compared to goniometry, corroborating the study of Farber, Deorio, Steel25.
Gomes, Marques, Domingos, Santos12 stated, computerized photogrammetry makes it easier to measure ROM because of the use of predetermined passive markers, which can help the accuracy of measurements with less interference of confound-ing variables.
Although both methods are shown to be reliable for the analysis of active knee extensions, all ROM values obtained by photogrammetric analysis were higher than UG, despite presenting less variability. First, it is important to highlight that both ROM readings were performed by another examiner in order to avoid induction of results, and the assessment with UG was“blind”22. Therefore, these indings can possibly be at -tributed to the identiication of anatomical reference points, as the error of a few millimeters in their identiication could com -promise the obtained angular values14. These dificulties were minimized with photogrammetry, because during registration passive markers were ixed for further image analysis, which beneited the alignment of the segments26.
It should be noted that, despite these minor changes, intra-rater reliability in this study was classiied as very strong for both instruments, regardless of group or assessment, a fact that reinforces the indings of Brosseauet al.27, who had found more reliable results for knee ROM (ICC = 0.97) when performed by the same examiner.
Regarding inter-instrument correlation, although there is variation in r values, it can be observed that both experimental groups (SSg and DSg) showed strong to very strong correlations (r: 0.62–0.91) when compared to Cg, which obtained weak to strong correlations (r: 0.56–0.82). Many authors8,14,27 empha-sized goniometry as a method widely used in physiotherapeutic clinic for ROM assessments. While photogrammetry is used as a toolfor analyzing postural asymmetries, as well as the lex -ibility of different segments10,16, Sacco et al.3,showed that both methodologies are equally reliable when analyzing other angles such as knee lexion and extension, even though computerized photogrammetry showed higher reliability values (r = 0.97) than
goniometry (r = 0.83). According to César, Gomes, Marques, DomingosSantos12,the availability of a real measure (in degrees)
in ROM facilitates its interpretation and allows the perception of subtle changes in the measurements.
Among possible limitations, there is a lack of measurement repeatability of the measurements performed by the same exam-iner (intra-rater) every other day, by entering a period between them, and also,by a second examiner for the analysis of interrater reliability. Future studies may add these analyses, as that they are relevant in far-reaching or multicentric clinical approaches. In addition, studies emphasizing other age groups, gender, and joints can also be performed.
Conclusion
The results of this study show that, for the analyzed movement, both methodologies (manual goniometry and computerized photogrammetry) showed high reliability and can be used for measuring the active range of knee extension, although photo-grammetry has reached higher values in all the measurements.
Furthermore, both instruments are correlated, indicating that, proportionally, the measurements vary similarly and are paral-lel reliable.
Protocol CEP/UFRN n 1.132.671, with Presentation Certiicate for Ethics Appreciation (PCEA) n 45188614.2.0000.5537
References
1. Wilson RW, Gansneder BM. Measures of functional limitation as predictors of disablement in athletes with acute ankle sprains. J Orthop Sports Phys Ther. 2000;30(9):528-535. doi: 10.2519/ jospt.2000.30.9.528.
2. Fernández MG, Escobar JC Z. Fiabilidad y correlación em la evaluación de la movilidad de rodilla mediante goniómetro e inclinómetro. Fisioterapia. 2012; 34(2):73-78. doi: 10.1016/j. ft.2011.12.004.
3. Sacco ICN, Aliberti S, Queiroz BWC, Pripas D, Kieling I, Kimura AA, et al. Confiabilidade da fotogrametria em relação a goniometria para avaliação postural de membros inferiores. Braz J Phys Ther. 2007; 11(5):411-417. doi: 10.1590/ S1413-35552007000500013.
4. Santos CM, Ferreira G, Malacco PL, Sabino GS, Moraes GFS, Felício DC. Intra and inter reliability and measurement error of goniometer and digital inclinometer use. Rev Bras Med Esporte. 2012; 18(1): 38-41. Retrieved from: http://dx.doi.org/10.1590/ S1517-86922012000100008.
5. Magnusson SP, Simonsen EB, Aagaard P, Boesen J, Johannsen F,
Kjaer M. Determinants of musculoskeletal lexibility: viscoelastic
properties, cross-sectional area, EMG and stretch tolerance. Scand J Med Sci Sports. 1997;7(4): 195-202. doi: 10.1111/j.1600-0838.1997.tb00139.x.
6. Cleffken B, van Breukelen G, Brink P, van Mameren H, Damink SO. Digital goniometric measurement of knee joint motion. Evaluation of usefulness for research settings and clinical practice. Knee. 2007;14(5):385-389. doi: 10.1016/j.knee.2007.07.004. 7. Lavernia C, D’Apuzzo M, Rossi MD, Lee D. Accuracy of
knee range of motion assessment after total knee arthroplasty. J Arthroplasty. 2008; 23(6 Suppl 1):85-91. doi: 10.1016/j. arth.2008.05.019.
8. Lenssen AF, van Dam EM, Crijns YH, Verhey M, Geesink RJ, van den Brandt, PA, de Bie RA. Reproducibility of goniometric measurement of the knee in the in-hospital phase following total knee arthroplasty. BMC Musculoskelet Disord. 2007;8:83-90. doi: 10.1186/1471-2474-8-83.
9. Gouveia VHO, Araújo AGF, Maciel SS, Ferreira JJA, Santos HH. Reliability of the measures inter and intra-evaluators with universal goniometer and fleximeter. Fisioter. Pesqui. 2014;21(3):229-235. doi: 0.590/1809-2950/52921032014. 10. Carvalho RMF, Mazzer N, Barbieri CH. Analysis of the reliability
and reproducibility goniometry photogrammetry regarding the hand. Acta Ortop Bras. 2012;20(3):139-149. http://dx.doi. org/10.1590/S1413-78522012000300003.
Arch Phys Med Rehabil. 2005;86(3):549-557. doi: 10.1016/j. apmr.2004.04.041.
12. César EP, Gomes PSC, Marques CL, Domingos BDP, Santos TM. Intra-rater reliability of knee lexion and extension range of motion measurement through the photogrammetry method. Fisioter. Pesqui. 2012.19(1):32-38. Retrieved from: http://dx.doi. org/10.1590/S1809-29502012000100007.
13. Naylor JM, KoV, Adie S, Gaskin C, Walker W, Harris IA, Mittal R. Validity and reliability of using photography for measuring knee range of motion: a methodological study. BMC Musculoskelet Disord. 2011;12:77-87. doi:10.1186/1471-2474-12-77.
14. Blonna D, Zarkadas PC, Fitzsimmons JS, O’’Driscoll SW. Validation of a photography-based goniometry method for measuring joint range of motion. J Shoulder Elbow Surg. 2012;21(1):29-35. doi: 10.1016/j.jse.2011.06.018.
15. Zonnenberg AJJ, Maanen V, Elvers JWH, Oostendorp RAB. Intra/interrater reliability of measurements on body posture photographs. J Craniomandibular Pract. 1996;14(4):326-331. http://www.ncbi.nlm.nih.gov/pubmed/9110628.
16. Iunes DH, Castro FA, Salgado HS, Moura IC, Oliveira AS,
Bevilaqua-Grossi D. Coniabilidade intra e interexaminadores e
repetibilidade da avaliação postural pela fotogrametria. Fisioter.
Pesqui. 2005;9(3):327-334. http://www.creito3.com.br/revista/
rbf/rbfv9n3/pdf/327_334_fotogrametria.pdf.
17. Thomas S, Reading J, Shephard RJ. Revision of the Physical Activity Readiness Questionnaire (PAR-Q). Can J Sport Sci. 1992;17(4):338-345.
18. Rosário JLP, Sousa A, Cabral CMN, João SMA, Marques AP. Global posture reeducation and static muscle stretching on
improving lexibility, muscle strength, and range of motion: a
comparative study. Fisioter. Pesqui. 2008;15(1):12-18. Retreived from http://dx.doi.org/10.1590/S1809-29502008000100003. 19. Beck TW. The importance of a priori sample size estimation
in strength and conditioning research. J Strength Cond Res. 2013;27(8):2323–2337. doi:10.1519/JSC.0b013e318278eea0. 20. Chan SP, Hong Y, Robinson PD. Flexibility and passive resistance
of the hamstrings of young adults using two different static stretching protocols. Scand J Med Sci Sports. 2001;11(2):81-86. doi: 10.1034/j.1600-0838.2001.011002081.x.
21. Marek SM, Cramer JT, Fincher AL, Massey LL, Dangelmaier SM, Purkayastha S, et al. Acute effects of static and proprioceptive neuromuscular facilitation stretching on muscle strength and power output. J Athl Train. 2005;40(2):94–103. http://www.ncbi. nlm.nih.gov/pmc/articles/PMC1150232.
22. Araújo AGF, Barbosa GM, Freire RA, Andrade PR, Ferreira JJA, Santos HH. Reliability of the intra and inter-test measures with universal goniometer and podalic arthrometer of the active range of ankle inversion and eversion. Fisioter. Pesqui. 2014;21(4):339-345. doi: 10.590/1809-2950/12452121042014.
23. Gama ZAS, Dantas AVR, Souza TO. Inluence of the time interval
between stretching sessions on increased hamstring lexibility. Rev
Bras Med Esporte. 2009;15(2):110-114. Retrieved from: http:// dx.doi.org/10.1590/S1517-86922009000200005.
24. Bruton A, Conway JH, Holgate ST. Reliability: what is it, and how is it measured? Physiotherapy. 2000;86(2):94–99. doi:10.1016/ S0031-9406(05)61211-4.
25. Farber DC, Deorio JK, Steel MW. Goniometric versus computerized angle measurement in assessing hallux valgus. Foot Ankle Int. 2005;26(3):234-238. doi:10.1177/107110070502600309. 26. Carregaro RL, Silva LCCB, Gil Coury HJC. Comparação entre
dois testes clínicos para avaliar a lexibilidade dos músculos posteriores da coxa. Braz J Phys Ther. 2007;11(2):139-145. http:// dx.doi.org/10.1590/S1413-35552007000200009.
27. Brosseau L, Balmer S, Tousignant M, O’Sullivan JP, Goudreault C, Goudreault M, Gringras S. Intra- and inter tester reliability and criterion validity of the parallelogram and universal goniometers for measuring maximum active knee flexion and extension of patients with knee restrictions. Arch Phys Med Rehabil. 2001;82(3):396-402. doi:10.1053/apmr.2001.19250.
28. Sato TO, Vieira ER, Gil Coury HJC. Análise da coniabilidade
de técnicas fotométricas para medir a lexão anterior do tronco.
Braz J Phys Ther. 2003;7(1):53-59. http://rbf-bjpt.org.br/iles/ v7n1/v7n1a08.pdf.
29. Baraúna MA, Canto RST, Schulz E, Silva RAV, Silva CDC, Veras, MTS, et al. Avaliação da amplitude de movimento do ombro em mulheres mastectomizadas pela biofotogrametria computadorizada. Rev. bras. Cancerol. 2004;50(1):27-31. http:// www.inca.gov.br/rbc/n_50/v01/pdf/ARTIGO3.pdf.
30. Tommaselli AMG, Silva JFC, Hasegawa JK, Galo M, Dal Poz AP. Fotogrametria: aplicações à curta distância. FCT 40 anos:
Peril cientíico educacional. Presidente: Meneguetti Jr. e Alves. 1999;147-159.
Acknowledgments
This work has inancial support from the Coordination for the Perfecting of Higher Level Staff (CAPES 2014-2016).
Corresponding author
Germanna de Medeiros Barbosa
Alameda dos Crisântemos, 60. Cidade Jardim, São Carlos, São Paulo, Brazil. Email: [email protected]
Manuscript received on June 08, 2016 Manuscript accepted on October 12, 2016