M a i l i n g A d d r e s s : V i r g i n i a G e n e l h u • R u a F e l i p e C a m a r ã o , 8 2 – 2 0 5 1 1 - 0 1 0 - R i o d e J a n e i r o , R J - B r a z i l
E-mail: [email protected] Received on 09/27/05 • Accepted on 12/08/05
Effects of Greater-than-5% Weight Reduction on
Hemodynamic, Metabolic and Neuroendocrine
Profiles of Grade I Obese Subjects
Kelly Biancardini Gomes Barbato, Rita de Cássia Vieira Martins, Maria de Lourdes Guimarães Rodrigues,
José Ueleres Braga, Emílio Antonio Francischetti, Virginia Genelhu
Clínica de Hipertensão do Laboratório de Fisiopatologia Clínica e Experimental – CLINEX/UERJ - Rio de Janeiro, RJ - Brazil
O
BJECTIVETo evaluate the effects of a greater-than-5% weight reduction in hemodynamic, metabolic, and neuroendocrine profi les of grade I obese subjects.
M
ETHODSObservational study with 47 grade I obese subjects, with mean age of 33 years who received monthly orientation regarding diet, physical exercises, and eating behavior for four months. Blood pressure using the auscultatory method and pulse rate were assessed monthly, whereas the following variables (and respective methods) were measured at the beginning and at the end of the study: total cholesterol, triglycerides, HDL-cholesterol (enzymatic method), LDL-cholesterol (Friedewald formula), blood glucose (hexokinase method), leptin, adiponectin, renin, aldosterone, insulin (radioimmunoassay) and insulin-resistance index (HOMA).
R
ESULTSAfter adjustment for other variables, significant reductions of 6 mmHg in diastolic blood pressure, 7 pg/ml in renin, 13 mg/dl in total cholesterol and 12 mg/dl in LDL-cholesterol were observed in the greater-than-5% weight reduction group. Also, a tendency to a higher increase in adiponectin levels by the end of the study, as well as a three-fold higher reduction in blood glucose, insulin, and HOMA levels, and a six-fold higher reduction in leptin levels were observed in this group.
C
ONCLUSIONSNon-pharmacological measures that promote a greater-than-5% weight reduction produce hemodynamic, metabolic, and neuroendocrine effects that improve the cardiovascular risk of obese subjects.
K
EY WORDSThe World Health Organization’s (WHO) estimates warn of a world prevalence of more than one billion adults with excess weight, of which at least three hundred million are obese1. In Brazil, data from the Survey on Family
Budgets conducted between 2002 and 2003 show that 40.6% of the total adult population are overweight, and 11% are considered obese, with a higher prevalence among women2.
Obesity is associated with a higher risk of type-2 diabetes mellitus3-5, dyslipidemia6,7, systemic hypertension8,9, and
overall and cardiovascular mortalities10,11. Data from
INTERHEART, a case-control study which evaluated risk factors associated with myocardial infarction showed that abdominal obesity is one of the fi ve major risk factors for myocardial infarction in 52 countries, including Brazil12.
Additionally, obesity has a positive and strong correlation with heart failure13, sudden death14, and stroke15.
Individuals who associate calorie restriction and exercises with behavioral treatment can lose 5% to 10% of their baseline weight in a period of four to six months. Although this percentage of weight loss is frequently below that desired by patients, it is enough to favorably change several conditions related to obesity16. Weight reduction
improves glucose intolerance17-19 and lipid profi le20,
in addition to reducing blood pressure levels21,22 and
symptoms associated with degenerative joint diseases, depression and sleep apnea23. Weight loss can also
improve assessment scores of quality of life24.
Obesity is known to have a signifi cant impact on lifespan25, and any initiative aiming at reducing weight
brings benefi ts which can be observed in the long term and that tend to be greater the earlier the intervention is made. This is true not only for the highest levels of obesity, but also for those who are overweight. The majority of the intervention studies promoting weight loss include patients with diseases associated with obesity, especially hypertension, dyslipidemia and glucose intolerance, in which weight loss may play a role in reversing the manifestations17,19,26. Information on the effects of lifestyle
changes in younger populations without comorbidities is not frequent in the literature. Furthermore, in a systematic review, we did not fi nd any study that had simultaneously assessed the effects of weight reduction on hemodynamic, metabolic and neuroendocrine profi les. The objective of our study was to assess possible benefi ts of greater-than-5% weight reductions on intermediate cardiometabolic risk factors in a group of young adults with grade I obesity.
M
ETHODSThe study started after approval by the Medical Ethics Committee of Hospital Universitário Pedro Ernesto and informed consent from all patients. The following inclusion criteria were observed: age between 18 and 45 years and BMI between 30 and 34.9 kg/m2. Smokers and
individuals with any other comorbidity, with the exception of glucose intolerance and stage I hypertension, were excluded. Individuals on antihypertensive medication and/or insulin sensitizers were also excluded. The patients were assessed as to their ability to lose weight during the phase I study, and only those who had achieved a 2% weight reduction in one month were included.
Study design - This is an observational prospective controlled study in which the patients were followed for a four-month period, during which they were monthly oriented in relation to diet, physical exercises and eating behavior. Patients were classifi ed into two groups according to the weight loss achieved in the period (Figure 1). Initially, history taking and physical examination were performed during the medical visit for assessment of patients’ eligibility. The baseline nutritional assessment encompassed a questionnaire on eating frequency and a 24-hour diet record on nutrient intake, in addition to an anthropometric assessment. All patients were prescribed a low-calorie diet composed of 50%-55%, 15%-25% and 25%-30% of carbohydrates, proteins and lipids, respectively, and the calorie defi cit was approximately 500 to 1000 kcal/day23. Orientation and encouragement
to participate in regular physical activity were given by professionals involved in the study, with emphasis on the recommendation of at least thirty minutes of moderate-intensity aerobic exercises most days of the week27. In the
monthly visits the patients were also given orientation to change their eating habits and were encouraged to achieve a greater-than-5% weight loss in the period.
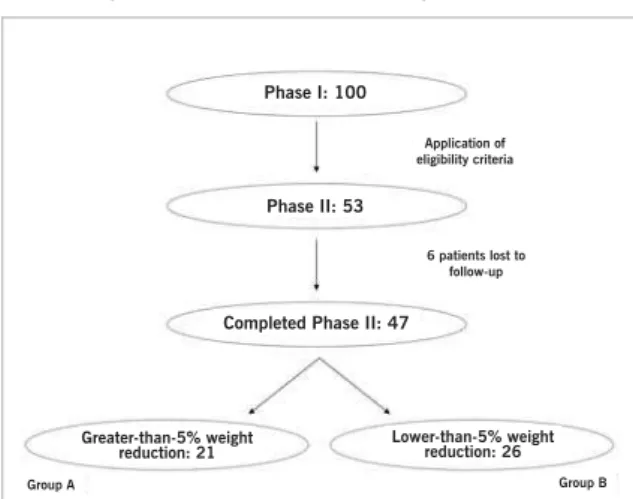
The study design comprised two phases. Phase I assessed the ability to lose 2% of the weight for one month. Those who were successful and met the other eligibility criteria were include in phase II which lasted four months. Clinical and nutritional assessment with monitoring of the hemodynamic profi le and anthropometric measurement was performed monthly, and laboratory tests to assess laboratory endpoints of the study were performed at the beginning and at the end of this phase.
Anthropometric assessment -Body Mass Index (BMI)
Phase I: 100
Phase II: 53
Completed Phase II: 47
Application of eligibility criteria
6 patients lost to follow-up
Greater-than-5% weight
reduction: 21 Lower-than-5% weight reduction: 26
Group A Group B
was calculated by dividing weight (in kg) by height (in m) square. Weight (0.1-kg precision) and height (0.5-cm precision) were measured using a Toledo™ electronic anthropometric scale calibrated by INMETRO in fasted barefoot patients wearing light clothing. Waist circumference (WC) and hip circumference (HC) were measured in centimeters, with the patients in the standing position and by means of a metallic tape measure. Waist circumference was measured midway between the iliac crest and the lower margin of the lowest rib. Hip circumference was measured at the largest circumference of the posterior portion of the gluteus. Waist-to-hip ratio (WHR) was obtained by dividing waist circumference by hip circumference.
Hemodynamic assessment - Blood pressure
was measured using the indirect method with the auscultator y technique by means of a mercur y column sphygmomanometer and a stethoscope, in the nondominant upper extremity, with the patient in the sitting position at least fi ve minutes after the beginning of the medical visit, with a cuff that fi tted the arm diameter. At each medical visit several measurements were taken at one to two-minute intervals, until a greater-than-5mmHg difference was not observed between consecutive values of systolic and diastolic pressures. The mean of the last two measurements was used. Heart rate was assessed by palpation of the radial pulse in the monthly visits.
Metabolic and neuroendocrine assessment - The
specimens were collected after a 12-hour fast. Total cholesterol was determined using the modifi ed Huang method, HDL-cholesterol using the COD-ANA Labtest™ enzyme system, and triglycerides using the modifi ed Soloni method after saponifi cation with Hantzsch reaction. LDL-cholesterol was estimated using the Friedewald formula. Fasting blood glucose was determined using the enzyme-hexokinase method. Fasting plasma insulin was determined using the radioimmunoassay technique with LINCO Research (St Louis, USA) reagents specifi c for human insulin. Insulin resistance was estimated using the Homeostatic Model of Assessment (HOMA), in which the resistance is determined by multiplying fasting plasma insulin (expressed in µU/ml) by fasting blood glucose (in mmol/l), divided by 22.5. This index has a strong correlation with the hyperinsulinemic euglycemic clamp8,29. Radioimmunoassay was used to determine
serum leptin, plasma adiponectin (both with Linco Research – St Charles, Missouri, USA – double-antibody solid-phase enzyme immunoassay), plasma renin (DSL 25100 Active kit), and serum aldosterone (DSL 8600 Active kit).
Statistical analysis - The arithmetic mean with its
respective standard deviation was used to describe continuous variables, and the absolute number and relative frequency were used for categorical variables. The non-paired Student’s t test was used for the comparison of the means of the endpoints between the groups,
and the chi-square test was used for the comparison of proportions. Following the univariate analysis of the study endpoints, the analysis of variance (ANOVA) and multiple linear regression were used to identify the associations between exposures and endpoints of interest. The difference of means and difference of mean reduction and their respective 95% confi dence intervals were also used as association measures. All statistical analyses used a signifi cance level of 5%. Data were stored in the EpiData 3.0 freeware, and the statistical analysis was performed in STATA 8.0.
R
ESULTSPatients and baseline characteristics - A total of 100
patients participated in the study phase I. Of these, 53 had at least a 2% body weight loss and were included in phase II. Forty seven patients completed this study phase (89%). Of the six patients lost to follow-up during study phase II, one was due to pregnancy, two due to clinical events diagnosed during the study, and three dropped voluntarily.
Of the 47 patients who were followed for the four months of phase II, 21 achieved the goal of a greater-than-5% weight loss, comprising group A, which was compared to group B, comprised of the remaining (26) patients who did not achieve this goal (Figure 1).
Patients’ baseline characteristics are shown in Table 1, according to the study group. When the two groups were compared, no difference was observed between them as regards gender, age, and baseline anthropometric, hemodynamic and metabolic assessments.
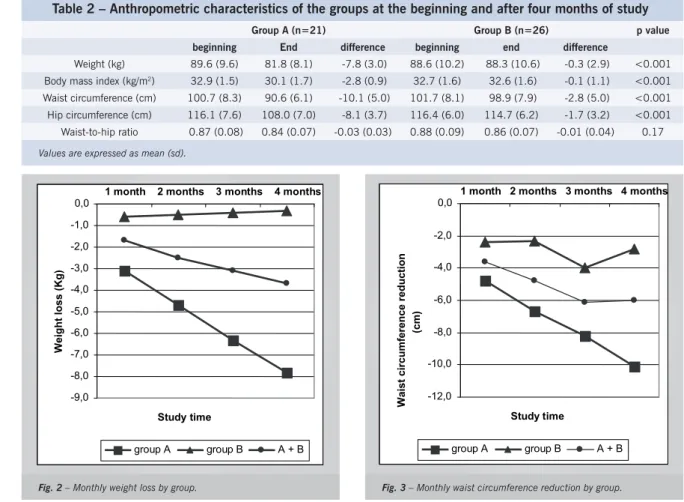
Anthropometric assessment - Group A lost 7.8 kg
during the four months of study phase II, whereas group B lost only 0.3 kg (Table 2), corresponding to a 8.5% and 0.4% reduction, respectively, in relation to baseline weight. Waist circumference reduction was also very signifi cant in group A with a mean 10.1-cm reduction in this group and 2.8 cm in group B at the end of the study. A strong correlation was found between weight loss throughout the period and waist circumference reduction (r = 0.75 and p < 0.001). Monthly weight loss and waist circumference reduction in each group are shown, respectively, in Figures 2 and 3. Hemodynamic
assessment - A non-signifi cant reduction in systolic
blood pressure was observed in both groups (Table 3). As regards diastolic blood pressure, a tendency to reduction of mean diastolic pressures was also detected at the end of the study in both groups. Mean reduction in group A was two-fold higher than that of group B: 4.0 and 1.9 mmHg, respectively.
Metabolic assessment - The characteristics of the
-9,0 -8,0 -7,0 -6,0 -5,0 -4,0 -3,0 -2,0 -1,0 0,0
Study time
Weight loss (Kg)
group A group B A + B
1 month 2 months 3 months 4 months
Table 1 – Baseline characteristics according to the study group
Group A (n=21)
Group B (n=26)
p Value
n (%) n (%)
Female gender 16 (76%) 19 (73%) 0.81
mean (sd) mean (sd)
Age (years) 33 (6.1) 32 (6.9) 0.61
Weight (kg) 89.6 (9.6) 88.6 (10.2) 0.75
Body mass index (kg/m2) 32.9 (1.5) 32.7 (1.6) 0.75
Waist circumference (cm) 100.7 (8.3) 101.7 (8.1) 0.67
Hip circumference (cm) 116.1 (7.6) 116.5 (6.0) 0.81
Waist-to-hip ratio 0.87 (0.1) 0.88 (0.1) 0.86
Systolic blood pressure (mmHg) 113 (9.0) 115 (13.4) 0.55
Diastolic blood pressure (mmHg) 80 (7.7) 82 (9.8) 0.53
Heart rate (bpm) 71 (9.2) 72 (7.8) 0.73
Glucose (mg/dl) 88 (10.9) 89 (9.8) 0.92
Cholesterol (mg/dl) 163 (27.4) 172 (31.9) 0.30
Triglycerides (mg/dl) 81 (43.9) 111 (57.3) 0.06
HDL-cholesterol (mg/dl) 41 (8.0) 41 (9.3) 0.88
LDL-cholesterol (mg/dl) 106 (22.3) 109 (31.7) 0.74
Adiponectin (µg/dl) 4.9 (3.1) 4.5 (2.3) 0.72
Renin (pg/ml) 21.4 (13.5) 19.5 (14.0) 0.65
Aldosterone (pg/ml) 131.8 (40.4) 137.7 (48.4) 0.66
Leptin (ng/ml) 41.8 (26.7) 40.0 (21.0) 0.80
Insulin (µU/ml) 22.3 (8.5) 24.0 (7.5) 0.49
HOMA (insulin resistance index) 5.1 (2.4) 5.3 (1.7) 0.81
Table 2 – Anthropometric characteristics of the groups at the beginning and after four months of study
Group A (n=21) Group B (n=26) p value
beginning End difference beginning end difference
Weight (kg) 89.6 (9.6) 81.8 (8.1) -7.8 (3.0) 88.6 (10.2) 88.3 (10.6) -0.3 (2.9) <0.001
Body mass index (kg/m2) 32.9 (1.5) 30.1 (1.7) -2.8 (0.9) 32.7 (1.6) 32.6 (1.6) -0.1 (1.1) <0.001
Waist circumference (cm) 100.7 (8.3) 90.6 (6.1) -10.1 (5.0) 101.7 (8.1) 98.9 (7.9) -2.8 (5.0) <0.001
Hip circumference (cm) 116.1 (7.6) 108.0 (7.0) -8.1 (3.7) 116.4 (6.0) 114.7 (6.2) -1.7 (3.2) <0.001
Waist-to-hip ratio 0.87 (0.08) 0.84 (0.07) -0.03 (0.03) 0.88 (0.09) 0.86 (0.07) -0.01 (0.04) 0.17
Values are expressed as mean (sd).
Fig. 2 – Monthly weight loss by group. Fig. 3 – Monthly waist circumference reduction by group. -12,0
-10,0 -8,0 -6,0 -4,0 -2,0 0,0
Studytime
Waist circumference reduction
(cm)
group A group B A + B
(Figure 4). Although all lipid profi le determinations were within the normal range, a signifi cant reduction in total cholesterol and LDL-cholesterol levels was observed in group A. At the end of the study, mean triglyceride levels decreased and mean HDL-cholesterol levels increased in both groups, however without reaching statistical signifi cance between the differences of means.
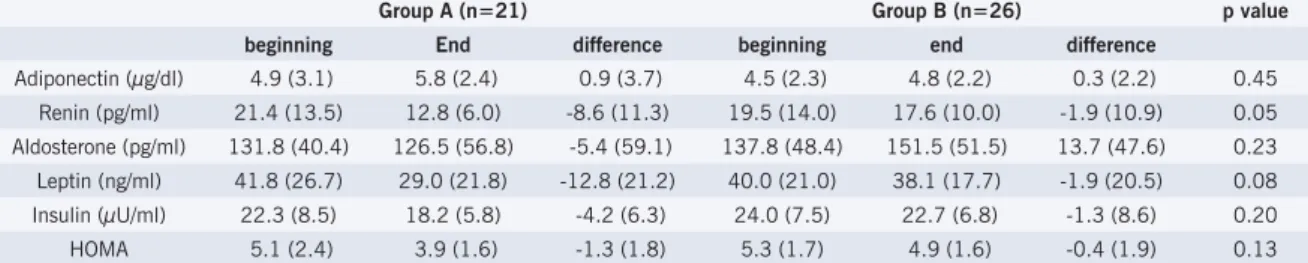
Neuroendocrine assessment - The characteristics of
the neuroendocrine profi le of the patients are shown in Table 5, according to the study group.
An increase in mean adiponectin was observed at the end of the study in both groups with a tendency of a higher effect in group A. Percentage increase at the end of the study was 18.4% and 6.7%, respectively, in groups A and B (Figure 4).
We observed a reduction in mean renin at the end of the study, that was signifi cantly higher in group A, with a difference between the beginning and end of the study of -8.6 pg/ml (-40%) in group A, and -1.9 pg/ml (-9.7%) in group B. Changes in aldosterone were different in the groups, with a 4.1% reduction in group A, and a 9.9% increase in group B, however without reaching statistical signifi cance between the groups.
A reduction in mean serum leptin was observed in both groups at the end of the study, and was six-fold higher in group A (Figure 5). Likewise, a non-signifi cant
Table 3 – Change in the hemodynamic profi le of the groups at the beginning and after four months of study
Group A (n=21) Group B (n=26)
p value
beginning end difference beginning end difference
Systolic blood pressure (mmHg) 113 (9.0) 112 (10.9) -1.1 (6.5) 115 (13.4) 114 (12.8) -0.8 (9.9) 0.91
Diastolic blood pressure (mmHg) 80 (7.7) 76 (11.1) -4.0 (7.4) 82 (9.8) 80 (10.5) -1.9 (7.5) 0.34
Heart rate (bpm) 71 (9.2) 69 (9.1) -2.4 (11.3) 72 (7.8) 72 (8.4) 0.1 (8.4) 0.38
Values are expressed as mean (sd).
Table 4 – Change in the metabolic profi le of the groups at the beginning and after four months of study
Group A (n=21) Group B (n=26) p value
beginning end difference beginning end difference
Glucose (mg/dl) 88 (10.9) 85 (10.8) -3.3 (9.5) 89 (9.8) 88 (12.2) -0.8 (6.8) 0.28
Cholesterol (mg/dl) 163 (27.4) 156 (29.5) -7.4 (18.0) 172 (31.9) 176 (31.3) 3.7 (19.6) 0.05
Triglycerides (mg/dl) 81 (43.9) 77 (31.0) -4.4 (25.6) 111 (57.3) 98 (42.6) -12.6 (27.1) 0.28
HDL-cholesterol (mg/dl) 41 (8.0) 45 (10.6) 3.9 (5.8) 41 (9.3) 47 (9.2) 6.2 (7.3) 0.25
LDL-cholesterol (mg/dl) 106 (22.3) 95 (24.9) -11.4 (16.5) 109 (31.7) 109 (31.7) 0.1 (15.8) 0.02
Values are expressed as mean (sd).
Table 5 – Change in the neuroendocrine profi le of the groups at the beginning and after four months of study
Group A (n=21) Group B (n=26) p value
beginning End difference beginning end difference
Adiponectin (µg/dl) 4.9 (3.1) 5.8 (2.4) 0.9 (3.7) 4.5 (2.3) 4.8 (2.2) 0.3 (2.2) 0.45
Renin (pg/ml) 21.4 (13.5) 12.8 (6.0) -8.6 (11.3) 19.5 (14.0) 17.6 (10.0) -1.9 (10.9) 0.05
Aldosterone (pg/ml) 131.8 (40.4) 126.5 (56.8) -5.4 (59.1) 137.8 (48.4) 151.5 (51.5) 13.7 (47.6) 0.23
Leptin (ng/ml) 41.8 (26.7) 29.0 (21.8) -12.8 (21.2) 40.0 (21.0) 38.1 (17.7) -1.9 (20.5) 0.08
Insulin (µU/ml) 22.3 (8.5) 18.2 (5.8) -4.2 (6.3) 24.0 (7.5) 22.7 (6.8) -1.3 (8.6) 0.20
HOMA 5.1 (2.4) 3.9 (1.6) -1.3 (1.8) 5.3 (1.7) 4.9 (1.6) -0.4 (1.9) 0.13
Values are expressed as mean (sd). HOMA: insulin resistance index.
reduction in mean serum insulin and HOMA was observed in both groups, although three-fold higher in group A (Fig.ure 6).
Effects of a greater-than-5% weight loss on hard
clinical and laboratory endpoints - After adjustment for
gender, age, and baseline values of body mass index, waist circumference, blood glucose, total cholesterol, triglycerides and renin, a signifi cant 6-mmHg reduction in diastolic pressure was observed in group A (Table 6). The value used for diastolic pressure was the mean of the two measurements obtained in the last two medical visits.
Serum levels of total cholesterol, LDL-cholesterol and renin had a mean 13-mg/dl, 12-mg/dl and 7-pg/ml reduction, respectively, and were higher in group A after adjustment for gender, age, baseline values of body mass index, waist circumference, mean blood pressure, blood glucose, total cholesterol and triglycerides.
D
ISCUSSIONIn both study groups a predominance of females was observed, refl ecting the higher prevalence of obesity in this gender2. The losses to follow-up were not selective,
Fig. 4 – Percentage difference of adiponectin by group at the end of the study.
Fig. 5 – Percentage difference of leptin by group at the end of the study.
patients were initially assessed, we observed that only 21% achieved the goal despite all the multidisciplinary support offered, which points out the huge diffi culty in the management of obesity when changes in lifestyle are adopted as the only intervention measure.
Group A individuals, however, achieved a mean 8.5% weight loss with no pharmacological intervention, and
only with monthly orientation regarding diet, physical activity and eating behavior. If we consider study phase I, this percentage of weight loss increases to 12% in fi ve months in group A.
The results of a multicenter study with sibutramine, one of the few drugs approved by the FDA (Food and Drug Administration – USA) for the treatment of obesity,
Table 6 – Effects of a greater-than-5% weight loss on hard clinical and laboratory endpoints – crude and adjusted association measurement with confi dence intervals
DMG 95%CI p value Adjusted DMG (1),(2) 95%CI p value
Diastolic blood pressure (mmHg; mean of last two visits) *(1)
-6.3 -11.2; -1.4 0.016 -6.2 -11.2; -1.2 0.017
Total cholesterol (mg/dl) **(2) -11.1 -21.9; -0.2 0.051 -13.1 -24.3; -1.8 0.024
LDL-cholesterol (mg/dl) **(2) -11.6 -20.8; -2.3 0.019 -12.2 -22.1; -2.2 0.018
Renin (pg/ml) **(2) -6.7 -13.0; -0.3 0.046 -7.1 -14.5; 0.2 0.059
*DMG: difference of mean between groups. **DMG: difference of mean reduction between groups. (1) adjusted for gender, age, and baseline body
mass index, waist circumference, total cholesterol, triglycerides and renin. (2) adjusted for gender, age, and baseline body mass index, waist
circumference, mean blood pressure, glucose, total cholesterol and triglycerides. 18.4%
6.7%
0.0% 2.0% 4.0% 6.0% 8.0% 10.0% 12.0% 14.0% 16.0% 18.0% 20.0%
group A group B
by group
Percentage difference
-30.6%
-4.8%
-35.0% -30.0% -25.0% -20.0% -15.0% -10.0% -5.0% 0.0%
by group
group A group B
Percenta
g
e difference
-3.4%
-1.1%
-18.4%
-5.4%
-23.5%
-7.5%
-25.0% -20.0% -15.0% -10.0% -5,0% 0.0%
by group
Glucose Insulin HOMA
group A group B
Percentage difference
were not very different from ours as regards weight loss. Weight reduction with sibutramine was dose-related and after six months of treatment the weight loss achieved was 7.4% when an initial 15mg/day dose was administered. An improvement in lipid profi le was observed, but the patients had some adverse effects, among which an elevation in blood pressure levels and heart rate should be pointed out30.
Data recently published on the use of rimonabant, an endocannabinoid receptor antagonist which has been investigated as a possible agent for the control of obesity and cardiometabolic risk factors, demonstrated that among the patients who used a low-calorie diet associated with a higher dose of the drug (20 mg/day), 51% and 27% achieved a weight loss greater than 5%, and 10% by the end of one year, respectively31. Comparing the results
of the study on rimonabant with ours, we observed that 45% and 11% of the patients of the present study had a 5% and 10% weight loss, respectively, in four months of intervention. If we include weight loss during phase I, 66% and 28% of the patients had a 5% and 10% weight loss, respectively, after fi ve months.
A retrospective analysis of the behavior of the groups in phase I of our study showed that the weight loss achieved during this initial one-month period was signifi cantly higher in group A, which had a 3.6% reduction of the baseline weight in the period, when compared to group B, which had a 2.6% reduction (p = 0.002).
Weight loss in patients of group A had a strong correlation with waist circumference reduction, suggesting that the fat loss was mostly of the visceral type. Even in group B, in which weight loss was practically insignifi cant, abdominal circumference decreased by almost 3.0 cm. Furthermore, in group B, when baseline values were compared to those of the end of the study, we observed a signifi cant reduction in waist (p = 0.009) and hip (p = 0.012) circumference, which allows us to conclude that in group B patients a total fat redistribution occurred possibly thanks to an adequate nutritional orientation, although an effective weight loss was not observed.
In this study, although pressure levels remained within a normal range from the beginning, we observed a reduction in systolic, and mainly in diastolic blood pressure in both groups, although higher and with statistical signifi cance between the measures from the beginning and end of the study (p = 0.021) in group A. The two phases of the Trial of Hypertension Prevention (TOHP) showed a quite similar effect on systolic/diastolic levels in the short term measured in the sixth month of intervention, with a 3.8/2.5-mmHg reduction in study phase I, and 3.7/2.7 mmHg in phase II. Mean weight loss at six months of both study phases was 5.7 kg32. Considering all the 47
patients of our study, reductions in systolic and diastolic blood pressure levels were 0.9/2.8 mmHg, respectively from the beginning to the end of study phase II, with a mean 3.6-Kg weight loss at four months.
Since the patients had necessarily to lose at least 2% of their baseline weight in phase I to be included in this phase, we also analyzed the difference between pressure levels at the beginning of phase I and end of phase II, and found a more signifi cant reduction in pressure levels, with a 5.1/4.3 mmHg decrease, for a mean weight reduction of 6.5 kg. According to Cook et al’s estimates33
conducted in the North American population between 35 and 64 years of age, the 4.3-mmHg reduction in diastolic blood pressure found during the fi ve months of our study (adding up phases I and II) would be able to reduce the prevalence of diastolic hypertension by more than 17%, the incidence of stroke or transitory ischemic attack by more than 15%, and coronary artery disease risk by more than 6% in these patients.
When the mean of the diastolic blood pressure taken in the last two visitsis analyzed, we fi nd a signifi cant 6.3-mmHg reduction in group A, even after adjustment for gender, age, and baseline values of body mass index, waist circumference, blood glucose, total cholesterol, triglycerides and serum renin. A plausible explanation for the more signifi cant effect of weight reduction on diastolic blood pressure was the inclusion of younger patients in our study. There are evidences that diastolic blood pressure would be a more important cardiovascular risk factor than systolic blood pressure for individuals younger than fi fty years of age34.
Although obese, patients in this study not only had a lipid profi le within a normal range in the beginning of the study, but also these values were within a desirable or optimal range20. An evaluation of 14 study trials with
lifestyle change intervention showed that in overweight individuals weight loss is effi cient in reducing triglyceride levels and increasing HDL-cholesterol levels, and that, usually, weight reduction also results in some total and LDL-cholesterol reduction23. In our study a reduction
in triglycerides and increase in HDL-cholesterol was observed in both groups, although without a signifi cant difference between them. Nonetheless, when baseline and fi nal values of each group were analyzed, we observed a signifi cant reduction of triglycerides only in group B (p = 0.025) and a signifi cant increase in HDL-cholesterol in groups A (p = 0.005) and B (p < 0.001). Triglyceride and HDL-cholesterol levels are known to be close and inversely related to each other35, and an explanation for
the inability to evidence the effect of weight reduction on these variables, as described in the literature, is the fact that both groups were given nutritional counseling regarding diet, and that even without a significant weight loss in group B, a change in food choice probably occurred, since body fat redistribution was objectively observed in this group. Deschenes et al concluded that visceral adipose tissue is the predictive factor that most strongly correlates with the lipid profi le36. Additionally,
signifi cantly lower in group A (mean of 81 mg/dl). After adjustment for gender, age and baseline body mass index, waist circumference, mean blood pressure, blood glucose, total cholesterol and triglycerides, our results demonstrated a signifi cantly higher mean reduction of total cholesterol and LDL-cholesterol in the group with a greater-than-5% weight reduction, of 13 and 12 mg/dl, respectively. The DEW-IT study showed that a 4.9-kg reduction in nine weeks thanks to changes in lifestyle, carried out under optimal conditions, resulted in a 25-mg/dl reduction in total cholesterol levels of the intervention group in relation to the control group, and in an 18-mg/dl reduction in LDL-cholesterol26.
A limitation for the comparison of our data with results of other studies such as the DEW-IT, for instance, is how weight loss is expressed, because the majority of the studies use the absolute weight lost instead of percentage loss, which seems to have a greater comparability in our opinion, considering the wide range of BMI accepted in the large studies. Additionally, when mean weight is used, this value may omit the sample heterogeneity. Finally, although mean reductions in total cholesterol and LDL-cholesterol observed in our study are apparently lower than those of the literature, the great majority of studies include patients with higher levels of lipid profi le. Most importantly, these effects, albeit small, may have a favorable impact on coronary risk in the short and long terms20,37.
In relation to glucose metabolism, no signifi cant effect of a greater-than-5% weight reduction was evidenced among the groups on any of the variables: blood glucose, fasting serum insulin, and insulin resistance index (HOMA). However, when baseline and fi nal values in group A were analyzed, we observed a signifi cant reduction in insulin (p = 0.006) and HOMA levels (p = 0.004), and when the groups are compared a clear trend of reduction in glucose metabolism variables is observed at the end of the study, approximately three-fold higher in group A. Perhaps these data are justifi ed by the fact that we chose to include obese patients with no comorbidities, with only four out of the total patients who completed the study (8.5%) showing glucose intolerance at the beginning of phase II, diagnosed by the presence of fasting plasma glucose between 100 and 125 mg/dl. Thus, we can speculate that we probably had a limited number of patients with insulin resistance in the study.
A limitation of the present study is that insulin and blood glucose were only measured in fasting. Assessments following glucose overload would certainly have increased sensitivity in the detection of alterations possibly present38. When we analyzed the patients who had a more
signifi cant weight loss within group A (greater than 8%) and compared this subgroup with group B, we observed a signifi cant effect on percentage insulin values, with a 32.8% higher reduction in the patients who had a greater weight loss when compared to group B (p = 0.045). Although this was not a long-duration study, consistent
data from the literature clearly point to a reduction of more than 50% in the cumulative incidence of diabetes in patients who achieved a 5% weight reduction after six years of follow-up39.
The occurrence of resistance to the action of leptin with hyperleptinemia in obesity is well established. Likewise, weight reduction is associated with a decrease in leptin levels40. Our data corroborate literature because
we found a tendency to a reduction in leptin levels in both groups, more signifi cant (six-fold higher) in group A. Comparing baseline and fi nal leptin levels, we observed a signifi cant reduction of these levels in group A (p = 0.012). When patients with a greater-than-8% weight reduction were analyzed and compared with those of group B, a signifi cant effect on leptin could be evidenced, with a 63.6% greater reduction of its levels at the end of the study (p = 0.008). This datum possibly translates as an increase in the sensitivity to leptin, with a reduction of the compensatory hyperleptinemia as a result of a more signifi cant weight loss. After adjustment for gender, age and baseline body mass index, waist circumference, mean blood pressure, blood glucose, total cholesterol and triglycerides, the percentage reduction in these individuals was even more signifi cant, reaching 86.4% in relation to group B (p = 0.003).
A study with obese individuals who lost weight following bariatric surgery associated the increase in adiponectin levels to the reduction in BMI and waist circumference41. In both groups of our study a
non-signifi cant increase in adiponectin levels was detected, although a 19% increase was recorded in group A. A possible explanation would be a favorable effect of weight and visceral fat reduction, which would stimulate adiponectin secretion by adipocytes.
A significant reduction in plasma levels of renin was observed in group A. This result suggests that a moderate weight reduction can bring favorable changes in the components of the renin-angiotensin system, and we could hypothesize that this would also occur in the fat tissue, thus contributing for a decrease in pressure levels. Engeli et al’s study points to a 43% reduction in renin levels following a 5% body weight reduction, which was followed by a signifi cant 7-mmHg decrease in ambulatory systolic blood pressure42. In our study we
found a similar reduction in renin levels (40%) associated with a 6-mmHg decrease in diastolic blood pressure in the group with a greater-than-5% weight loss. Regarding aldosterone, a 4.1% reduction was recorded at the end of the study in group A, but it was not signifi cant in relation to group B.
weight reduction and/or body fat redistribution, not frequently greater than that observed in the literature with pharmacological treatment. If applied to a larger part of the population, these effects, although apparently modest from an individual point of view, may create an impact in terms of reduction of cardiovascular morbidity and mortality.
Potencial Confl ict of Interest
No potential confl ict of interest relevant to this article was reported.
R
EFERENCES1. WHO, 2003. Obesity and overweight. In: http://www.who.int/ dietphysicalactivity/publications/facts/obesity/en/
2. IBGE, Diretoria de Pesquisas, Coordenação de Índice de Preços, Pesquisa de Orçamentos Familiares 2002-2003.
3. Chan JM, Rimm EB, Colditz GA, Stampfer MJ, Willett WC. Obesity, fat distribution, and weight gain as risk factors for clinical diabetes in men. Diabetes Care. 1994;17: 961-9.
4. Colditz GA, Willett WC, Rotnitzky A, Manson JE. Weight gain as a risk factor for clinical diabetes mellitus in women. Ann Intern Med. 1995; 122 (7): 481-6.
5. Mokdad AH, Bowman BA, Ford ES, Vinicor F, Marks JS, Koplan JP. The continuing epidemics of obesity and diabetes in the United States. JAMA. 2001; 286 (10): 1195-200.
6. Brown CD, Higgins M, Donato KA, et al. Body mass index and the prevalence of hypertension and dyslipidemia. Obes Res. 2000; 8 (9): 605-19.
7. Després JP, Lemieux I, Prud’homme D. Treatment of obesity: need to focus on high risk abdominally obese patients. BMJ. 2001; 322 (7288): 716-20.
8. Huang Z, Willett WC, Manson JE, et al. Body weight, weight change, and risk for hypertension in women. Ann Intern Med. 1998; 128 (2): 81-8.
9. Field AE, Coakley EH, Must A, et al. Impact of overweight on the risk of developing common chronic diseases during a 10-year period. Arch Intern Med. 2001; 161 (13): 1581-6.
10. Manson JE, Willett WC, Stampfer MJ, et al. Body weight and mortality among women. N Engl J Med. 1995; 333: 677–85.
11. Banegas JR, Lopez-Garcia E, Gutierrez-Fisac JL, Guallar-Castillon P, Rodriguez-Artalejo F. A simple estimate of mortality attributable to excess weight in the European Union. Eur J Clin Nutr. 2003; 57 (2): 201-8.
12. Yusuf S, Hawken S, Ounpuu S, et al; INTERHEART Study Investigators. Effect of potentially modifi able risk factors associated with myocardial infarction in 52 countries (the INTERHEART study): case-control study. Lancet. 2004; 364 (9438): 937-52.
13. Kenchaiah S, Evans JC, Levy D, et al. Obesity and the risk of heart failure. N Engl J Med. 2002; 347 (5): 305-13.
14. Empana JP, Ducimetiere P, Charles MA, Jouven X. Sagittal abdominal diameter and risk of sudden death in asymptomatic middle-aged men: the Paris Prospective Study I. Circulation. 2004; 110 (18): 2781-5.
15. Kurth T, Gaziano JM, Rexrode KM, et al. Prospective study of body mass index and risk of stroke in apparently healthy women. Circulation. 2005; 111 (15): 1992-8.
16. Wood AJJ. Obesity. N Engl J Med. 2002; 346 (8): 591-601.
17. Blumenthal JA, Sherwood A, Gullette EC, et al. Exercise and weight loss reduce blood pressure in men and women with mild hypertension: effects on cardiovascular, metabolic, and hemodynamic functioning. Arch Intern Med. 2000; 160 (13): 1947-58.
18. McFarlane SI, Banerji M, Sowers JR. Insulin resistance and cardiovascular disease. J Clin Endocrinol Metab. 2001; 86 (2): 713-8.
19. Knowler WC, Barrett-Connor E, Fowler SE, et al. Diabetes Prevention Program Research Group. Reduction in the incidence of type 2 diabetes with lifestyle intervention or metformin. N Engl J Med. 2002; 346: 393– 403.
20. National Cholesterol Education Program (NCEP) Expert Panel on Detection, Evaluation, and Treatment of High Blood Cholesterol in Adults (Adult Treatment Panel III). Third Report of the National Cholesterol Education Program (NCEP) Expert Panel on Detection, Evaluation, and Treatment of High Blood Cholesterol in Adults (Adult Treatment Panel III) fi nal report. Circulation. 2002;106 (25): 3143-421.
21. Hall JE. Pathophysiology of Obesity Hypertension. Curr Hypertens Rep. 2000; 2: 139-47.
22. Klein S, Burke LE, Bray GA, et al; American Heart Association Council on Nutrition, Physical Activity, and Metabolism; American College of Cardiology Foundation. Clinical implications of obesity with specifi c focus on cardiovascular disease: a statement for professionals from the American Heart Association Council on Nutrition, Physical Activity, and Metabolism: endorsed by the American College of Cardiology Foundation. Circulation. 2004;110 (18): 2952-67.
23. National Institutes of Health. Clinical Guidelines on the Identifi cation, Evaluation, and Treatment of Overweight and Obesity in Adults--The Evidence Report. Obes Res. 1998; 6 (Suppl 2): 51S-209S.
24. Plaisted CS, Lin PH, Ard JD, McClure ML, Svetkey LP. The effects of dietary patterns on quality of life: a substudy of the Dietary Approaches to Stop Hypertension trial. J Am Diet Assoc. 1999; 99: S84-9.
25. Fontaine KR, Redden DT, Wang C, Westfall AO, Allison DB. Years of Life Lost Due to Obesity. JAMA. 2003; 289: 187-93.
26. Miller ER, Erlinger TP, Young DR, et al. Results of the Diet, Exercise, and Weight Loss Intervention Trial (DEW-IT). Hypertension. 2002; 40 (5): 612-8.
27. Pate RR, Pratt M, Blair SN, et al. Physical activity and public health. A recommendation from the Centers for Disease Control and Prevention and the American College of Sports Medicine. JAMA. 1995; 273 (5): 402-7.
28. Matthews DR, Hosker JP, Rudenski AS, Naylor BA, Treacher DF, Turner RC. Homeostasis model assessment: insulin resistance and -cell function from fasting plasma glucose and insulin concentrations in man. Diabetologia. 1985; 28: 412-9.
29. Avignon A, Bœgner C, Mariano-Goulart D, Colette C, Monnier L. Assessment of insulin sensitivity from plasma insulin and glucose in the fasting or post oral glucose-load state. Int J Obes. 1999; 23: 512-7.
30. Bray, GA, Blackburn, GL, Ferguson, JM, et al. Sibutramine produces dose-related weight loss. Obes Res. 1999; 7: 189-98.
31. Van Gaal LF, Rissanen AM, Scheen AJ, Ziegler O, Rossner S; RIO-Europe Study Group.. Effects of the cannabinoid-1 receptor blocker rimonabant on weight reduction and cardiovascular risk factors in overweight patients: 1-year experience from the RIO-Europe study. Lancet. 2005; 365: 1389-97.
II. Arch Intern Med. 1997; 157 (6): 657-67.
33. Cook NR, Cohen J, Herbert PR, Taylor JO, Hennekens CH. Implications of small reductions in diastolic blood pressure for primary prevention. Arch Intern Med. 1995; 155: 701-9.
34. Franklin SS, Larson MG, Khan SA, et al. Does the Relation of Blood Pressure to Coronary Heart Disease Risk Change With Aging? : The Framingham Heart Study. Circulation. 2001; 103: 1245-9.
35. Grundy SM, Hansen B, Smith Jr SC, Cleeman JI, Kahn RA; American Heart Association; National Heart, Lung, and Blood Institute; American Diabetes Association. Clinical management of metabolic syndrome: report of the American Heart Association/National Heart, Lung, and Blood Institute/American Diabetes Association conference on scientifi c issues related to management. Circulation. 2004; 109 (4): 551-6.
36. Deschenes D, Couture P, Dupont P, Tchernof A. Subdivision of the subcutaneous adipose tissue compartment and lipid-lipoprotein levels in women. Obes Res. 2003; 11 (3): 469-76.
37. U.S. Department Of Health and Human Services. Centers for Disease Control and Prevention. Preventing Heart Disease and Stroke
Addressing the Nation’s Leading Killers. At A Glance 2004. In: http:// www.cdc.gov/nccdphp/aag/aag_cvd.htm
38. Piche ME, Arcand-Bosse JF, Despres JP, Perusse L, Lemieux S, Weisnagel SJ. What is a normal glucose value? Differences in indexes of plasma glucose homeostasis in subjects with normal fasting glucose. Diabetes Care. 2004; 27 (10): 2470-7.
39. Tuomilehto J, Lindstrom J, Eriksson JG, et al. Finnish Diabetes Prevention Study Group. Prevention of type 2 diabetes mellitus by changes in lifestyle among subjects with impaired glucose tolerance. N Engl J Med. 2001; 344 (18): 1343-50.
40. Thong FS, Hudson R, Ross R, Janssen I, Graham TE. Plasma leptin in moderately obese men: independent effects of weight loss and aerobic exercise. Am J Physiol Endocrinol Metab. 2000; 279 (2): E307-13.
41. Yang WS, Lee WJ, Funahashi T, et al. Weight reduction increases plasma levels of an adipose-derived anti-inflammatory protein, adiponectin. J Clin Endocrinol Metab. 2001; 86: 3815 –9.