Relation between Anthropometric Indicators and Risk Factors for
Cardiovascular Disease
Mirele Arruda Michelotto de Oliveira
1, Regina Lúcia Martins Fagundes
1, Emília Addison Machado Moreira
1,
Erasmo Benício Santos de Moraes Trindade
1, Tales de Carvalho
2Universidade Federal de Santa Catarina1; Universidade do Estado de Santa Catarina/Clínica Cardiosport2, Florianópolis, SC - Brazil
Mailing address: Regina Lúcia Martins Fagundes • Rua das Amendoeiras, 118 - Lagoa da Conceição - 88062-290 - Florianópolis, SC - Brazil
E-mail: [email protected]
Manuscript received July 16, 2008; revised manuscript received November 14, 2008; accepted August 13, 2009.
Abstract
Background: Studies have been carried out to identify the best anthropometric predictor of chronic diseases in different populations.
Objective: To verify the relation between anthropometric measures and risk factors (lipid profile and blood pressure) for cardiovascular diseases.
Methods: Transversal study carried out with 180 males and 120 females, with mean age 39.6±10.6 years old. Body mass index (BMI), waist circumference (WC), body fat percentage (%BF), waist-to-hip ratio (WHR), lipid profile, glycemia and blood pressure were the variables assessed.
Results: BMI, WC and WHR were higher among males, and %BF were higher among females (p<0.001). The proportion of altered cases of WHR and %BF in relation to LDL-cholesterol and total cholesterol (TC) was higher among males. The individuals considered normal for WC presented alteration in the values of LDL-c, TC and HDL-cholesterol. There was a correlation between BMI and WC (males: r=0.97 and females: r=0.95; p<0.001). Among males, the best correlation (p<0.001) was presented between WC and WHR (r=0.82) and among females, %BF and WC (r=0.80). Triglycerides (TG) presented correlation to WHR (males: r=0.992; females r=0.95; p<0.001), and to WC (males: r=0.82; females r=0.79; p<0.001). In the multiple analysis (prevalence ratio - PR, confidence interval - CI), the BMI were associated with total cholesterol (PR=1.9; 95%CI 1.01-3.69; p=0.051) among males and slightly associated with TG/HDL-cholesterol (PR=1.8; IC95% 1.01-3.45; p=0.062) among females.
Conclusion: BMI and WHR were the anthropometric indicators with strongest relation to lipid profile in both sex groups. This data support the hypothesis that BMI and WHR may be considered as risk factors for cardiovascular disease. (Arq Bras Cardiol 2010; 94(4):451-457)
Key words: Cardiovascular diseases; obesity; anthropometry/methods; risk factors.
cardiovascular disease were identified: arterial hypertension, high cholesterol levels or reduced HDL-cholesterol levels, smoking, diabetesmellitus and aging.
Yonder, the guidance from World Heart Federation4 point out other risk factors that may increase the general risk, such as: overweight/obesity, physical inactivity, atherogenic diet, stress (socioeconomic and psychosocial), family history of premature cardiovascular disease and genetic or racial factors.
Obesity and, more recently, overweight are increasing problems in many countries, including Brazil, and many attempts have been made as to identify the best anthropometric predictor of chronic diseases in different populations. Abdominal adiposity has been considered one of the best predictors for cardiovascular diseases. However, although the imaging diagnosis technique is the most effective method, it is limited when employed in epidemiological studies due to its high costs and methodological difficulties. Therefore, anthropometric markers, like waist circumference and waist-to-hip ratio, for example, have been widely used in epidemiological studies carried out in Europe5 an in the United
Introduction
The cardiovascular disease is widely considered the main death and disability cause around the world. Despite the decrease in the proportion of death occurrences due to cardiovascular disease in developed countries, in the last decades, these indexes have significantly increased in low and medium-income countries1.
States6. Notwithstanding, there are few studies available that explore the accuracy of such measures in developing countries. Besides, there is controversy with regard to the best indicator of abdominal fat7.
The objective of this paper was to verify the relation between anthropometric measures and risk factors (lipid profile and blood pressure) for cardiovascular disease.
Methods
Transversal study, carried out between August and October
2005, based on medical records of individuals admitted in a
Prevention and Rehabilitation clinic, with care characterized as Private or Supplementary Medicine System, in Florianópolis, Santa Catarina, Brazil. The sample studied (n=300) was chosen from the total of admittances (n=708). Inclusion
criteria were: adults (20-59 years old) of both sexes and
that were not under medication treatment for hypertension, diabetes and dislipidemia (undiagnosed). Exclusion criteria: pregnant (n=40) and nursing (n=37) women, athletes
(n=780) and those who were in use of medications (n=253).
Anthropometric measures and anatomical reference points were collected according to Ross and Marfell-Jones8. Weight was measured in a mechanical plataform scale with capacity
for 150 kg, 100 g scale, model 110 CH (Welmy Indústria e
Comércio Ltda., Santa Bárbara do Oeste, São Paulo, Brazil). The height was measured with a stadiometer, model Wood, with specificity of 0.001 m (WCS/CARDIOMED, Curitiba, Paraná, Brazil). Nutritional status was qualified based on body mass index (BMI) in kg/m2, according to the World Health Organization (WHO) in 19989. The body fat percentage (%BF) was obtained by means of the SIRI formula [% Fat
= (4.95/ body density) - 4.5 x 100], based on the body
density estimative determined by the equations proposed by Durnin and Wolmersley10. The measures of tricipital, biciptal, subescapular and suprailiac cutaneous fold were taken with a plicometer, model Slimguide. All instruments are Berfer (Francisco Berral de La Rosa, Córdoba University, Spain). Three measurements were taken, and the arithmetic mean was used as final value. The %BF was assessed according to Heyward and Stolarczyk11. Waist circumference was expressed in centimeters, in the iliac board with an inextensible measuring stick, model Gulick, Mabbis (CARDIOMED, Curitiba, Paraná, Brazil). The hip circumference was expressed in centimeters in the most protuberant gluteal area in a horizontal plane12. The waist-to-hip ratio was obtained from the values of waist and hip circumferences, and their classification was based on cut points recommended by WHO9. Blood pressure (BP) in mmHg was obtained by means of a sfignomanometer with mercury column; model Aneroide, Wan-Med (CARDIOMED, Curitiba, Paraná, Brazil). Blood Pressure was gauged three times, with a two-minute interval between each gauging, and the mean values were registered according to the determinations of IV
Diretrizes Brasileiras de Hipertensão Arterial13. Lipid profile was characterized based on serum levels of total cholesterol (TC) and triglycerides (TG), both in mg/dl, obtained through an automatic colorimetric enzymatic method14. The high-density lipoprotein cholesterol (HDL-cholesterol) (mg/dl) was determined by the selective precipitation method along with the dosage of automatic colorimetric enzymatic method14. The
low-density lipoprotein cholesterol (LDL-cholesterol) (mg/dl) was obtained through the Friedewals formula14, validated for values of TG till 400 mg/dl14. Glycemia (mg/dl) was determined by hexokinasis method15. Cutoff points were employed
according to Grundy et al16 and Grund et al17.
The study was approved by the Ethics Research Committee of Universidade Federal de Santa Catarina (protocol number
376/05) and is in compliance with the World Medical
Association, Declaration of Helsinki18.
The analyses were made by means of SPSS version 14.0 (SPSS Inc., Chicago, United States) and STATA (Stata Corporation, College Station, United States) software. Initially, the descriptive analysis of variables was presented by means of proportions, means and standard deviations. The non-pared t test was used for independent samples as to compare the mean results of the assessed variables. Pearson’s coefficient of linear correlation was utilized to assess the level of correlation between the tested variables.
The assembly of the logistic model had the finality of observing how the anthropometric variables (BMI, WC, WHR and %BF) can predict, in probabilistic means, the presence of the risk factor for dislipidemia. The anthropometric variables were used as predictors and indicators of the presence or not of dislipidemia: 0 (absence) and 1 (presence). The independent variables selected for the analysis were: total cholesterol (TC), LDL and HDL-cholesterol, triglycerides (TG), systolic and diastolic blood pressure (SBP and DBP) and fasting glycemia.
The association between the anthropometric variables and independent variables among males and females was carried out by means of prevalence ratios, confidence intervals, chi-square and linear tendency test. The multiple analysis was made by means of Poisson regression, presenting the
prevalence ratios and respective 95% confidence intervals. The
variables with p<0.20 at the bivariate analysis were included in the multiple analysis. The criteria of variables permanence
in the final model was p≤0.05.
Results
The sample gathered 300 patients (180 males [60%] and
120 females) with mean age 39.59 ± 10.6 years old. In
Table 1 it is observed that there was a significant diffeence
between sexes for the following variables: age (p < 0.05),
BMI (p < 0.01), and %BF, WC, WHR, HDL-cholesterol, TG and difference (p < 0.001).
In the distribution of the sample by percentage of altered values of lipid fractions, blood pressure and glycemia according to normal and altered values of anthropometric variables, it is observed that males have higher percentage of altered cases
for WC [n = 59 (32.8%)], WHR [n = 77 (42.8%)] and %BF
[n = 174 (96.7%)].
presented altered values for LDL-cholesterol and TC had also %BF altered (Table 2).
Table 3 shows the correlation of anthropometric indicators between each other, to lipid profile, glycemia and blood pressure according to sex. The most evident correlation was verified between BMI and WC for men (r=0.970; p<0.001)
as much as for women (r=0.945; p<0.001). The correlation
between indicators of abdominal fat, WC and WHR was similar in both sexes (males: r=0.821; females: r=0.801; p<0.001). Among females, %BF was more strongly related to WC (r=0.767; p<0.001) than among men. In the analysis between anthropometric variables and lipid profile, it was observed that the most evident correlation happened between WHR and TG
(males: r=0.992; females: r=0.953; p<0.001) and between WHR and TG/HDL-cholesterol (males: r=0.875; females:
0.798; p<0.001), followed by WC and TG (r=0.817; females: r=0.792; p<0.001). The remaining correlations between anthropometric variables and lipid profile, as considering TC, LDL-c and HDL-c, were slight, though significant. Glycemia was not correlated to any anthropometric indicators. Similarly, there was no correlation between anthropometric variables and diastolic blood pressure levels. On the contrary, a significant, but slight, correlation was observed between BMI and WC and the systolic blood pressure levels among females (Table 3).
In the bivariate analysis, for males, a positive linear variable of
BMI and LDL-cholesterol was found (p=0.030), TC (p=0.005).
Among females, a positive linear relation was also observed between BMI and TV (p=0.092) and TG (p=0.036) (Table 4). The variable WHR also presented a positive linear relation to HDL-cholesterol (p=0.161) among males and, among females, the relation was observed between TG and HDL-cholesterol (p=0.142). In the multivariate analysis, BMI is associated to total
cholesterol among males (PR=1.9; 95%CI 1.01-3.69; p=0.051).
Among females, we observed that BMI may relate to
TG/HDL-cholesterol (PR=1.8; 95%CI 1.01-3.45; p=0.062) (Table 4).
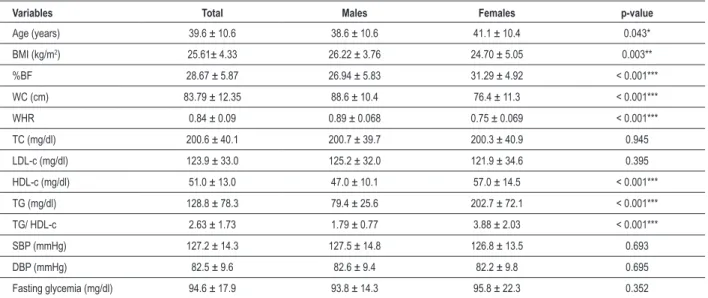
Table 1 - Anthropometric and clinical characteristics according to sex
Variables Total Males Females p-value
Age (years) 39.6 ± 10.6 38.6 ± 10.6 41.1 ± 10.4 0.043* BMI (kg/m2) 25.61± 4.33 26.22 ± 3.76 24.70 ± 5.05 0.003**
%BF 28.67 ± 5.87 26.94 ± 5.83 31.29 ± 4.92 < 0.001***
WC (cm) 83.79 ± 12.35 88.6 ± 10.4 76.4 ± 11.3 < 0.001***
WHR 0.84 ± 0.09 0.89 ± 0.068 0.75 ± 0.069 < 0.001*** TC (mg/dl) 200.6 ± 40.1 200.7 ± 39.7 200.3 ± 40.9 0.945
LDL-c (mg/dl) 123.9 ± 33.0 125.2 ± 32.0 121.9 ± 34.6 0.395
HDL-c (mg/dl) 51.0 ± 13.0 47.0 ± 10.1 57.0 ± 14.5 < 0.001***
TG (mg/dl) 128.8 ± 78.3 79.4 ± 25.6 202.7 ± 72.1 < 0.001***
TG/ HDL-c 2.63 ± 1.73 1.79 ± 0.77 3.88 ± 2.03 < 0.001***
SBP (mmHg) 127.2 ± 14.3 127.5 ± 14.8 126.8 ± 13.5 0.693 DBP (mmHg) 82.5 ± 9.6 82.6 ± 9.4 82.2 ± 9.8 0.695
Fasting glycemia (mg/dl) 94.6 ± 17.9 93.8 ± 14.3 95.8 ± 22.3 0.352
Values expressed by mean and standard deviation (X ± SD); Signiicant difference: *p<0.05; **p<0.01; ***p<0.001. BMI - body mass index; %BF - percentage of body fat;
WC - waist circumference; WHR - waist-to-hip ratio; TC - total cholesterol; TG - triglycerides; LDL-cholesterol - low-density lipoprotein cholesterol; HDL-cholesterol - high-density lipoprotein cholesterol; SBP - systolic blood pressure; DBP - diastolic blood pressure.
Discussion
Epidemiological studies have showed a clears correlation between obesity and cardiovascular risk factors19,20. In the diagnosis of the nutritional status of the studied population, assorted by BMI, overweight and obesity were prevalent. It was similar to what happened with the studied of Ribeiro et al21 that studied an adult population from Minas Gerais, Brazil, with regard to BMI, and observed 41.7% of overweight and 11.1% of obesity. The National research of Health and Nutrition (PNSN, from the Portuguese Pesquisa Nacional de Saúde e Nutrição) (1989) showed that about 40% of the adult Brazilian population presented overweight in some degree20.
However, it is emphasized that using BMI as classificatory measure of nutritional status may be useful in population studies, yet it is few accurate with regard to body fat distribution. In this manner, the measures like WHR and WC may give additional information concerning obesity nature22,23.
Dalton et al24 investigated the correlation between BMI, WC and WHR to cardiovascular diseases risk factors in an adult Australian population and also found differences in the prevalence of overweight and obesity. These authors, based on BMI, found 39% of Australian adults with overweight
and 20.8% with obesity. When WC was utilized, 30.5% of the adults were labeled as obese, while only 15.8% fit this
classification when based on WHR. Additional data proved that there were differences between sexes for WC and WHR parameters: the prevalence of overweight was higher among men, and obesity was more significant among women.
Table 2 - Percentage of altered values of lipid fractions, blood pressure and glycemia according to normal and altered values of
anthropometric variables
Anthropometric variables BMI (kg/m
2) WC (cm) WHR %BF
Normal Altered Normal Altered Normal Altered Normal Altered
Males (M)
< 25 ≥ 25 < 94 ≥ 94 < 0.9 ≥ 0.90 < 15% ≥ 15% Females (F) < 80 ≥ 80 < 0.8 ≥ 0.80 < 23% ≥ 23% n (%) M 77 (42.8) 103 (57.2) 121 (67.2) 59 (32.8) 103 (57.2) 77 (42.8) 06 (3.33) 174 (96.7) n (%) F 77 (64.2) 43 (35.8) 87 (72.5) 33 (27.5) 90 (75.0) 30 (25.0) 08 (6.67) 112 (93.3)
Lipid fractions n (%)
LDL-c ≥130mg/dl M 24 (29.3) 58 (79.7) 53 (64.6) 29 (35.4) 47 (57.3) 35 (42.9) - 82 (100.0)
F 25 (58.1) 18 (41.9) 28 (65.1) 15 (34.9) 29 (67.4) 14 (32.6) 01 (2.3) 42 (97.7)
TC ≥ 200mg/dl M 24 (26.7) 66 (73.3) 55 (61.1) 35 (38.9) 47 (52.2) 43 (47.8) - 90 (100.0)
F 31 (54.4) 26 (45.6) 37 (64.9) 20 (35.1) 38 (66.7) 19 (33.3) 01 (1.7) 56 (98.3)
TG ≥ 150 mg/dl M - - -
-F 55 (57.9) 40 (42.1) 62 (65.3) 33 (34.7) 65 (68.4) 30 (31.6) 02 (2.1) 93 (97.9)
HDL-c
< 40 mg/dl M 62 (45.9) 73 (54.1) 96 (71.1) 39 (28.9) 87 (64.4) 48 (35.6) 06 (4.4) 129 (95.6) < 50 mg/dl F 57 (68.7) 26 (31.3) 62 (74.7) 21 (25.3) 64 (77.1) 19 (22.9) 06 (7.2) 77 (92.8)
TG/ HDL-c < 3,8 M - 1 (100.0) - 1 (100.0) - 1 (100.0) - 1 (100.0)
F 21 (47.7) 23 (52.3) 21 (47.7) 23 (52.3) 19 (43.2) 25 (56.8) - 44 (100.0)
FG ≥ 100 mg/dl M 24 (43.6) 31 (56.4) 39 (70.9) 16 (29.1) 29 (52.7) 26 (47.3) 01 (1.8) 54 (98.2)
F 18 (66.7) 09 (33.3) 20 (74.1) 07 (25.9) 20 (74.1) 07 (25.9) 01 (3.7) 26 (96.3)
SBP ≥ 130 mmHg M 29 (38.2) 47 (61.9) 52 (68.4) 24 (31.6) 42 (55.3) 34 (44.7) 01 (1.3) 75 (98.7)
F 30 (57.7) 22 (42.3) 33 (63.5) 19 (36.5) 35 (67.3) 17 (32.7) 02 (3.9) 50 (96.1)
DBP ≥ 85 mmHg M 21 (35.6) 38 (64.4) 39 (66.1) 20 (33.9) 31 (52.5) 28 (47.5) - 59 (100.0)
F 24 (61.54) 15 (38.5) 26 (66.7) 13 (33.3) 28 (71.8) 11 (28.2) 02 (5.1) 37 (94.8)
Values expressed by mean and standard deviation (X ± SD); Signiicant difference: ***p < 0.001. BMI - body mass index; %BF - percentage of body fat; WC - waist
circumference; WHR - waist-to-hip ratio; TC - total cholesterol; TG - triglycerides; LDL-cholesterol - low-density lipoprotein cholesterol; HDL-cholesterol - high-density lipoprotein cholesterol; FG - fasting glycemia; SBP - systolic blood pressure; DBP - diastolic blood pressure.
which suggests and excess of intra-abdominal adipose tissue. Such data may have contributed with the alterations observed in lipid profile. Cercato et al20 obtained similar results after studying a sample of 1,213 Brazilian adults of both sexes, as men presented higher mean values of WC and WHR and lower mean values of HDL-c.
Velásquez-Meléndez et al25 assessed the predictive capacity of WC in 79 females and observed that WC ≥ 80 cm corresponded to 89.8% of females with BMI ≥ 25 kg/m2 and WC ≥ 88 cm, and 88.5% of females with BMI ≥ 30 kg/m2. These authors showed that abdominal obesity, defined as WC ≥
88 cm, was significantly associated with arterial hypertension. In the study of Pereira et al26, carried out with 3,282 adult individuals from Rio de Janeiro, Brazil, it was observed that WHR presented smaller correlation to BMI and higher capacity of predicting hypertension in comparison to other indicators of fat disposal, which allows a better discrimination of individuals with risk for chronic diseases.
In the present research, the correlation between anthropometric indicators showed that WC was more strongly
related to BMI and WHR than to %BF. This finding suggests that WHR would be less dependent on total adiposity. Such results were similar to those observed in other studies5,24,27.
Sampaio et al28, with the purpose of assessing the correlation between BMI and anthropometric indicators of fat distribution in adults and old-aged people, also observed a positive and strong correlation between BMI and WC28.
An investigation carried out with a population from Rio Grande do Sul, Brazil29, showed a prevalence of inadequate cases of 5.6% for total cholesterol and 7% for glycemia higher
than 126 mg/dl. Ribeiro et al21 observed values superior to the reference value for TC (47.2%), and inferior values for HDL-c (42.7%) and arterial hypertension in 37.2% of the sample. The prevalence of arterial hypertension observed in both sexes in the present study was elevated in comparison to the estimative of arterial hypertension in the Brazilian population, which is
of 15%, according to Ministério da Saúde in 200430.
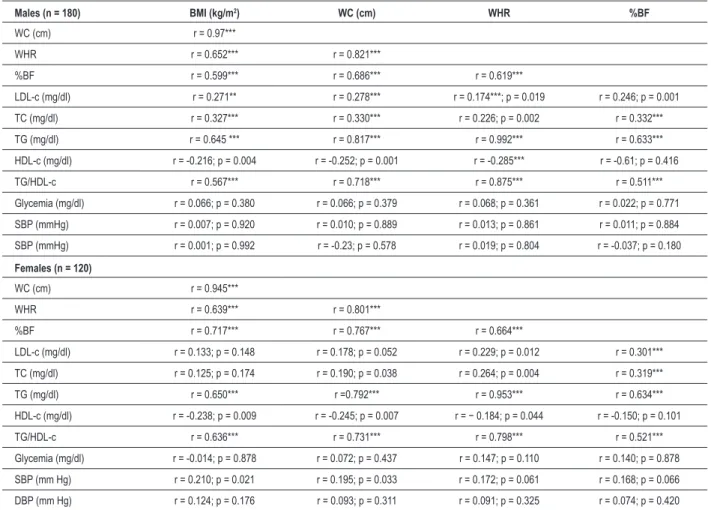
Table 3 - Correlation between anthropometric variables, lipid proile, glycemia and blood pressure according to sex
Males (n = 180) BMI (kg/m2) WC (cm) WHR %BF
WC (cm) r = 0.97***
WHR r = 0.652*** r = 0.821***
%BF r = 0.599*** r = 0.686*** r = 0.619***
LDL-c (mg/dl) r = 0.271** r = 0.278*** r = 0.174***; p = 0.019 r = 0.246; p = 0.001
TC (mg/dl) r = 0.327*** r = 0.330*** r = 0.226; p = 0.002 r = 0.332*** TG (mg/dl) r = 0.645 *** r = 0.817*** r = 0.992*** r = 0.633***
HDL-c (mg/dl) r = -0.216; p = 0.004 r = -0.252; p = 0.001 r = -0.285*** r = -0.61; p = 0.416
TG/HDL-c r = 0.567*** r = 0.718*** r = 0.875*** r = 0.511***
Glycemia (mg/dl) r = 0.066; p = 0.380 r = 0.066; p = 0.379 r = 0.068; p = 0.361 r = 0.022; p = 0.771 SBP (mmHg) r = 0.007; p = 0.920 r = 0.010; p = 0.889 r = 0.013; p = 0.861 r = 0.011; p = 0.884 SBP (mmHg) r = 0.001; p = 0.992 r = -0.23; p = 0.578 r = 0.019; p = 0.804 r = -0.037; p = 0.180
Females (n = 120)
WC (cm) r = 0.945***
WHR r = 0.639*** r = 0.801***
%BF r = 0.717*** r = 0.767*** r = 0.664***
LDL-c (mg/dl) r = 0.133; p = 0.148 r = 0.178; p = 0.052 r = 0.229; p = 0.012 r = 0.301***
TC (mg/dl) r = 0.125; p = 0.174 r = 0.190; p = 0.038 r = 0.264; p = 0.004 r = 0.319*** TG (mg/dl) r = 0.650*** r =0.792*** r = 0.953*** r = 0.634***
HDL-c (mg/dl) r = -0.238; p = 0.009 r = -0.245; p = 0.007 r = − 0.184; p = 0.044 r = -0.150; p = 0.101
TG/HDL-c r = 0.636*** r = 0.731*** r = 0.798*** r = 0.521***
Glycemia (mg/dl) r = -0.014; p = 0.878 r = 0.072; p = 0.437 r = 0.147; p = 0.110 r = 0.140; p = 0.878 SBP (mm Hg) r = 0.210; p = 0.021 r = 0.195; p = 0.033 r = 0.172; p = 0.061 r = 0.168; p = 0.066 DBP (mm Hg) r = 0.124; p = 0.176 r = 0.093; p = 0.311 r = 0.091; p = 0.325 r = 0.074; p = 0.420
Signiicant values: ***p < 0.001; BMI - body mass index; %BF - percentage of body fat; WC - waist circumference; WHR - waist-to-hip ratio; TC - total cholesterol; TG
- triglycerides; LDL-cholesterol - low-density lipoprotein cholesterol; HDL-cholesterol - high-density lipoprotein cholesterol; SBP - systolic blood pressure; DBP - diastolic blood pressure.
to LDL-c and TC among males, which appear to be in a worse situation in comparison to females with regard to cardiovascular diseases31. In the assessment of the percentage of total BF, it was observed that for the altered cases, almost all individuals presented alteration in the indicators of dislipidemia, blood pressure and glycemia in both sexes. The percentage of BF was associated with risk factors in diabetic women32.
In the present investigation, WC was not a predictor for cardiovascular diseases risk, for the majority of the individuals that presented normal WC showed altered values for LDL-c, TC, HDL, glycemia and blood pressure, similarly to the results observed by Ross et al33. These findings support the hypothesis that the disposal of relatively higher quantities of intra-abdominal fat adversely affects the concentrations of lipid and of circulating lipoproteins.
A Brazilian study that assessed 1,213 adults from São Paulo evidenced that the main dislipidemia associated with central obesity would be represented by the significant increase of triglycerides levels and/or by the decrease of HDL-c levels20. Similarly, Hu et al34 studied a sample of American Indians and verified that the main lipid/lipoprotein abnormalities related
to obesity were the decrease of HDL-c and the increase of triglycerides, mainly among men. These authors also observed that central adiposity were more frequently associated with normal lipid profiles.
In the present study, we observed that TC and LDL-c were more frequently correlated to BMI among males and to fat percentage among females. That is, were more significantly correlated to total adiposity measures, which suggests that total body fat may be more relevant in relation to these variables (TC and LDL-c) than to fat disposal in the central portion of the body. These findings were similar to those found by other researchers7,24.
In the bivariate analysis, the anthropometric indicators BMI and WHR were associated with cardiovascular disease risk factors (LDL-c and TC among males and TG and TG/ HDL-c among females). In the conjunct analysis of WHR in relation to HDL-c (males) and TG/HDL-c (females), it was verified that visceral adiposity may be considered as a cardiovascular disease risk factor35. In the multiple analysis,
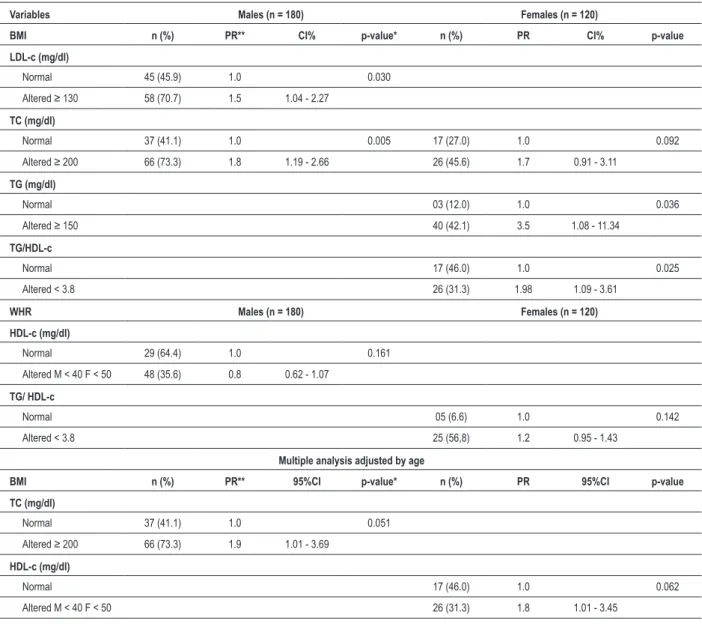
Table 4 - Bivariate analysis of anthropometric and lipid variables according to normal and altered values by sex and adjusted by age
Variables Males (n = 180) Females (n = 120)
BMI n (%) PR** CI% p-value* n (%) PR CI% p-value
LDL-c (mg/dl)
Normal 45 (45.9) 1.0 0.030
Altered ≥ 130 58 (70.7) 1.5 1.04 - 2.27
TC (mg/dl)
Normal 37 (41.1) 1.0 0.005 17 (27.0) 1.0 0.092
Altered ≥ 200 66 (73.3) 1.8 1.19 - 2.66 26 (45.6) 1.7 0.91 - 3.11
TG (mg/dl)
Normal 03 (12.0) 1.0 0.036
Altered ≥ 150 40 (42.1) 3.5 1.08 - 11.34
TG/HDL-c
Normal 17 (46.0) 1.0 0.025
Altered < 3.8 26 (31.3) 1.98 1.09 - 3.61
WHR Males (n = 180) Females (n = 120)
HDL-c (mg/dl)
Normal 29 (64.4) 1.0 0.161 Altered M < 40 F < 50 48 (35.6) 0.8 0.62 - 1.07
TG/ HDL-c
Normal 05 (6.6) 1.0 0.142
Altered < 3.8 25 (56,8) 1.2 0.95 - 1.43
Multiple analysis adjusted by age
BMI n (%) PR** 95%CI p-value* n (%) PR 95%CI p-value
TC (mg/dl)
Normal 37 (41.1) 1.0 0.051
Altered ≥ 200 66 (73.3) 1.9 1.01 - 3.69
HDL-c (mg/dl)
Normal 17 (46.0) 1.0 0.062
Altered M < 40 F < 50 26 (31.3) 1.8 1.01 - 3.45
*Pearson’s chi-square test; ** Linear tendency test; PR - prevalence ratio; 95%CI - conidence interval; BMI - body mass index; %BF - percentage of body fat; WC - waist
circumference; WHR - waist-to-hip ratio; TC - total cholesterol; TG - triglycerides; LDL-cholesterol - low-density lipoprotein cholesterol; HDL-cholesterol - high-density lipoprotein cholesterol.
may be considered a risk factor for cardiovascular diseases for males, and WHR tends to be a risk predictor of cardiovascular diseases for females.
Conclusion
BMI and WHR were the anthropometric indicators that presented higher correlation to lipid profile in both sexes. These data support the hypothesis that BMI and WHR may be considered as risk factors for cardiovascular disease.
Study limitations
As we dealt with a 300-patient sample, there might have been an elevated prevalence of normality for TG (100%)
among men.
Potential Conflict of Interest
No potential conflict of interest relevant to this article was reported.
Sources of Funding
There were no external funding sources for this study.
Study Association
References
1. Yusuf S, Hawken S, Ounpuu S, Bautista L, Franzosi MG, Commerford P, et al and the INTERHEART Study Investigators. Obesity and the risk of myocardial infarction in 27,000 participants from 52 countries: a case-control study. Lancet. 2005; 366:1640-9.
2. Castro LCV, Franceschini SCC, Priore SE, Pelúzio MCG. Nutrição e doenças cardiovasculares: os marcadores de risco em adultos. Rev Nutr. 2004; 17 (3): 369-77.
3. Wilson PWF, D’Agostinho RB, Levy D, Belanger AM, Silbershartz A, Kannel WB. Prediction of coronary heart disease using risk factor categories. Circulation. 1998; 97: 1837-47.
4. Smith SC, Rod J, Pearson TA, Fuster V, Yusuf S, Faergeman O, et al. Principles for national and regional guidelines on cardiovascular disease prevention: a scientific statement from the World Heart and Stroke Forum. Circulation. 2004; 109: 3112-21.
5. Lakka HM, Lakka TA, Tuomilehto J, Salonet JT. Abdominal obesity is associated with increased risk of acute coronary events in men. Eur Heart J. 2002; 23: 706-13.
6. Janssen I, Katzmarzyk PT, Rossi R. Waist circumference and not body mass index explains obesity-related health risk. Am J Clin Nutr. 2004; 79: 379-84.
7. Lemos-Santos MGF, Valente JG, Gonçalves-Silva RMV, Sichieri R. Waist circunference and waist-to-hip ratio as predictor of serum concentration of lipids in Brazilian men. Nutrition. 2004; 20: 857-62.
8. Ross WD, Marfell-Jones MT. Kinanthropometry. In: MacDougall JD, Wenger HA, Green HJ (eds.). Physiological testing of the high-performance athlete. 2nd ed. Champaign, Illinois: Human Kinetics; 1991. p. 233-306.
9. World Health Organization (WHO). Obesity: preventing and managing the global epidemic. Geneva: Program of Nutrition, Family and Reproductive Health; 1998 (Technical Report Series 894).
10. Durnin JV, Wolmersley S. Body fat assessed from total body density and its estimation from skinfold thickness: measurements on 481 men and women age from 16 to 72 years. Br J Nutr. 1974; 32 (1): 77-97.
11. Heyward VH, Stolarczyk LM. Avaliação da composição corporal aplicada. São Paulo: Editora Manole; 2000.
12. National Heart Lung and Blood Institute. (NHLBI) Obesity Education Initiative. The practical guide. Identification, evaluation, and treatment of overweight and obesity in adults. [Acesso em 2005 jul 27]. Disponível em: http://www.nhlbi. nih.gov/guidelines/obesity/prctgd_b.pdf
13. Sociedade Brasileira de Cardiologia. IV Diretrizes brasileiras de hipertensão arterial. Arq Bras Cardiol. 2004; 82 (supl): 1-14.
14. Sociedade Brasileira de Cardiologia. III Diretrizes brasileiras sobre dislipidemias e diretriz de prevenção da aterosclerose. Arq Bras Cardiol. 2001; 77 (supl. 3): 1-48.
15. Genuth S, Alberti KG, Bennett P, Buse J, Defronzo R, Kahn R, et al. and Expert Committee on the Diagnosis and Classification of Diabetes Mellitus. Follow-up report on the diagnosis of diabetes mellitus. Diabetes Care. 2003; 26 (11): 3160-7.
16. Grundy SM. Primary prevention of coronary heart disease: integrating risk assessment with intervention. Circulation. 1999; 100 (9): 988-98.
17. Grundy SM, Cleeman JI, Daniels SR, Donato KA, Eckel RH, Franklin BA, et al. American Heart Association; National Heart, Lung, and Blood Institute. Diagnosis and management of the metabolic syndrome: an American Heart Association/National Heart, Lung, and Blood Institute Scientific Statement. Circulation. 2005; 112 (17): 2735-52.
18. World Medical Association Declaration of Helsinki: Human subjects ethical principles for medical research involving. J Am Med Assoc. 2000; 284 (23):
3043-5.
19. Costa-Font J, Gil J. Obesity and the incidence of chronic diseases in Spain: a seemingly unrelated probit approach. Econ Hum Biol. 2005; 3 (2): 188-214.
20. Cercato C, Mancini MC, Arguell AMC, Passos Q, Villares SMF, Halpern A. Systemic hypertension, diabetes mellitus, and dyslipidemia in relation to body mass index: evaluation of a Brazilian population. Rev Hosp Clin. 2004; 59 (3): 113-8.
21. Ribeiro RCL, Rosado LEF, Carvalho CR, Ghetti FF, Nascimento MN. Importância dos fatores nutricionais no cálculo do risco cardiovascular global. Rev Med Minas Gerais. 2004; 14 (3): 157-62.
22. World Health Organization (WHO). Physical Status: the use and interpretation of anthropometry. Geneva: WHO; 1995. Technical Report Series, 854.
23. Rosa MLG, Mesquita ET, Rocha ERR, Fonseca VM. Índice de massa corporal e circunferência da cintura como marcadores de hipertensão arterial em adolescentes. Arq Bras Cardiol. 2007; 88 (5): 573-8.
24. Dalton M, Cameron AJ, Zimmet PZ, Shaw JE, Jolley D, Dunstan DW, et al. Waist circumference, waist-hip ratio and body mass index and their correlation with cardiovascular disease risk factors in Australian adults. J Inter Med. 2003; 254: 555-63.
25. Velasquez-Meléndez G, Kac G, Tavares R, Silva CQ, Garcia ES. Evaluation of waist circumference to predict general obesity and arterial hypertension in women in Greater Metropolitan Belo Horizontal, Brazil. Cad Saúde Pública. 2002; 18 (3): 765-71.
26. Pereira RA, Sichieri R, Marins VMR. Razão cintura/quadril como preditor de hipertensão arterial. Cad Saúde Pública. 1999; 15 (2): 333-44.
27. Martins IS, Marinho SP. O potencial diagnóstico dos indicadores da obesidade centralizada. Rev Saúde Pública. 2003; 37 (6): 760-7.
28. Sampaio LR, Figueiredo VC. Correlação entre o índice de massa corporal e os indicadores antropométricos de distribuição de gordura corporal em adultos e idosos. Rev Nutr. 2005; 18 (1): 53-61.
29. Gus M, Moreia MP, Gleisener LM, Moraes RS, Fuchs FD. Associação entre diferentes indicadores de obesidade e prevalência de hipertensão arterial. Arq Bras Cardiol. 1998; 70 (2): 111-4.
30. Ministério da Saúde. Vigilância alimentar e nutricional – SISVAN: orientações básicas para a coleta, o processamento, a análise de dados e a informação em serviços de saúde. Brasília; 2004. p. 120. [Acesso em 2008 mar 10]. Disponível em: http://nutricao.saude.gov.br/documentos/orientacoesbasicassisvan.pdf
31. Marcopito LF, Rodrigues SSF, Pacheco MAP, Shirassu MM, Goldfeder AJ, Moraes MA. Prevalência de alguns fatores de risco para doenças crônicas na cidade de São Paulo. Rev Saúde Pública. 2005; 39 (5): 738-45.
32. Corrêa FHS, Taboada GF, Andrade RMA Jr, Faria AM, Clemente ELS, Fuks AG, et al. Influência da gordura corporal no controle clínico e metabólico de pacientes com diabetes mellitus Tipo 2. Arq Bras Endocrinol Metab. 2003; 47: 62-8.
33. Ross R, Berentzen T, Bradshaw AJ, Janssen1 I, Kahn HS, Katzmarzyk1 PT, et al. Does the relationship between waist circumference, morbidity and mortality depend on measurement protocol for waist circumference? Obes Rev. 2008; 9: 312-25.
34. Hu FB, Stampfer MJ, Haffner SM, Solomon CG, Willett WC, Manson JE. Elevated risk of cardiovascular disease prior to clinical diagnosis of type 2 diabetes. Diabetes Care. 2002; 25: 1129-34.