Effects of open drainage ditch design on bacterial and fungal communities of cold
waterlogged paddy soils
Shanlian Qiu
1, MK Wang
2, Fei Wang
1, Jichen Chen
1, Xiaoyan Li
3, Qinghua Li
1,
Cheng Lin
1, Xinjian Lin
11
Soil and Fertilizer Institute, Fujian Academy of Agricultural Sciences, Fuzhou, China. 2
Fujian Academy of Agricultural Sciences, Fuzhou, China. 3
College of Life Sciences, Fujian Agriculture and Forestry University, Fuzhou, China.
Submitted: April 19, 2012; Approved: April 01, 2013.
Abstract
A field experiment established in 1980 was conducted to evaluate the effects of open drainage ditch applied for water removal on bacterial and fungal communities of cold waterlogged paddy soils in 2011. In this experiment, traditional plate counting and temperature gradient gel electrophoresis were employed to characterize the abundance and diversity of soil bacterial and fungal communities. Four different distances from the open drainage ditch, 5, 15, 25 and 75 m with different degrees of drainage were designed for this study. Maximum populations of culturable aerobic bacteria and fungi were at 15-m distance while minimum populations were at 75-m distance. Significant differences (p < 0.05) in fungal populations were observed at all distances from open drainage ditch. The highest diversity of the bacterial community was found at a distance of 25 m, while that of the fungal community was observed at a distance of 5 m. Sequencing of excised TGGE bands indicated that the dominant bacte-ria at 75-m distance belonged to anaerobic or microaerobic bactebacte-ria. Relationships between micro-bial characteristics and soil physicochemical properties indicated that soil pH and available nitrogen contents were key factors controlling the abundance of culturable aerobic bacteria and fungi, while soil water capacity also affected the diversity of fungal community. These findings can provide the references for better design and advanced management of the drainage ditches in cold waterlogged paddy soils.
Key words:abundance, bacterial and fungal communities, diversity, open drainage ditch.
Introduction
Cold waterlogged paddy soils (CWPS) are a type of low-yield paddy field widely distributed in southern China. In Fujian Province, CWPS occupy about 128,000 hectares (ha), accounting for 12.0% of the total area of paddy fields, and about 47.7% of the total low-yield paddy area in the whole province (Liet al., 2011). Low productivity of cold waterlogged paddy (CWP) fields is attributed to their phys-ical and chemphys-ical factors, such as high groundwater table, poor drainage conditions, low soil temperature, excessive amount of reducing substances, poor aeration conditions, and low contents of available nutrients (Cheng, 1984). Ob-viously, only through proper drainage can CWPS become favorable for rice growth. Once drained, excess water in
ag-ricultural soils is rapidly removed, the moisture in paddy soil decreases greatly, and the groundwater table is low-ered. Thus, drainage promotes cohesion of soil particles, in-creases bulk density and hardness of soil (Cheng, 1984), improves soil aeration conditions, and accelerates oxida-tion of soil organic matter (SOM) contents. Thereby, drain-age which serves as an important water mandrain-agement strat-egy, not only improves the physical properties of paddy soils, but also promotes soil fertility.
In China, most farmers have conventionally em-ployed some techniques for land drainage, such as open drainage ditch, mole drainage, tile drainage, and their com-binations. Agricultural drainage ditches are essential for re-moval of surface and ground waters to allow for crop production in poorly drained agricultural landscapes
delmanet al., 2007). Ditches range in size from small de-pressed channels designed primarily for carrying surface runoff to major channelized streams draining large water-sheds and regional groundwater (Needelmanet al., 2007). In fact, the ditches serve not only to prevent flooding so as to reduce crop stress through the rapid removal of excess water, but also to dry the soils to facilitate operation of farm machineries.
Although it is well known that drainage ditches can bring about noticeable shifts in soil quality and rice growth in poorly drained agricultural land, little is known as to their effect on soil microorganisms, which play the major role in soil ecosystems. Soil microbial function governs to mediate nutrient cycling, organic matter decomposition, and soil aggregate formation (Kamaaet al., 2011).
Good understanding of soil microbial communities will allow us to identify the relationships between ditch drainage, soil fertility and rice productivity. CWP field with an open drainage ditch was established in 1980 in the middle of paddy field in Shunchang, Fujian Province in China. Thus, this study aimed to use cultivation-dependant method and molecular techniques, including DNA-extraction and PCR/TGGE-analysis, to characterize the abundance and diversity of soil bacterial and fungal com-munities at four different distances from open drainage ditch.
Materials and Methods
Site descriptions and soil samplings
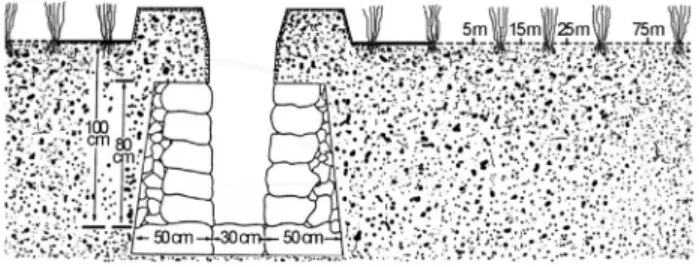
The study site is located at the Shunchang Long-Term Experimental Station (LTES, since 1980) of Cold-Waterlogged Field Improvement, Fujian Academy of Agri-cultural Sciences (26°42’N, 117°42’E), Fujian Province, China. The elevation of the LTES is 262 m above sea level. It has subtropical monsoon humid climate with annual av-erage temperature of 18.5 °C, precipitation of 1691.3 mm and sunshine of 2,292 h. The CWPS is derived from quater-nary sediment and classified as a type of gleyic paddy soil. To transport excess water from paddy soils, an open drain-age ditch (200 m in length, 300 cm in bottom width, 1.0 m in depth) was established in the middle of paddy field in 1980. Dig a trench using the shovel in the ground of cold waterlogged paddy field, filled the bottom of the trench with large stones, set large stones outside and crushed stones insides the sides of trench, laid a 40-cm layer of soil over the stones on both sides of the planned trench (Figu-re 1). Four distances we(Figu-re selected for soil samplings, which were located at 5, 15, 25 and 75 m, respectively, away from the open ditch (Figure 1). Surface soil samples (i.e., 0-20 cm) were collected from each plot in March 2011 during slack winter season. Three plots at each distance were collected and three soil cores (approx. 6 cm in diame-ter) taken from each plot were mixed to generate a compos-ite sample. A total of 12 composcompos-ite samples were obtained
for this study. They were designed as follows: 5I, 5II, 5III, 15I, 15II, 15III, 25I, 25II, 25III, 75I, 75I, and 75III, accord-ing to the samplaccord-ing distance. These soil samples were trans-ferred into ziplock plastic bags and stored at 4 °C until analyzed.
Soil analyses
Soil pH was measured with a pH meter using a soil to water of 1:2.5 suspensions (Metter-Toledo EL20K) (Th-omas, 1996). Soil organic matter (SOM) was determined by K2Cr2O7oxidation-reduction titration method (Walkley and Black, 1934). Available N (AN) and available P (AP) were determined by NaOH hydrolyzable and molybdemum methods, respectively. Available K (AK) was determined using atomic absorption spectrometer (AAS, SP-3801, Shanghai-Spectrum, Shanghai, China) (Jackson, 1979). Soil water content (SWC) was measured gravimetrically, drying soil (10 g) in an oven at 105 °C for 24 h (Zhanget al., 2011).
Plate counting of soil microorganisms
10-fold serial dilutions of soil suspensions were pre-pared for spread plate counting. 10-3-10-5 dilutions were used for bacteria counting with beef extract peptone me-dium (Jianget al., 1995), and 10-2-10-4dilutions were pre-pared for fungi counting with rose bengal medium (Smith and Dawson, 1944). Plates with 0.1 mL of inoculum were inverted and incubated at 28±2 °C for 3 d for bacteria and 5 d for fungi. After incubation, a plate with a countable number of colonies (between 30 and 300) was selected. The number of colonies was counted and the number of mi-crobes in 1 g of dry soil was calculated.
DNA extraction from soils and PCR amplification
Soil DNA was extracted using the SDS-based DNA extraction method(Zhouet al., 1996). For bacteria, the 16S rDNA V3 fragments were amplified using the fD1/rD1 (Weisburget al., 1991) and F341GC/R534 (Muyzeret al., 1993) primers with nested PCR. Amplification using primer pair fD1/rD1 was performed in 50-mL reaction mix-tures, including 5mL 10 x PCR buffer with (NH4)2SO4, 3 L 25 mM MgCl2, and 4mL 2.5 mM dNTPs. Then, 0.5mL Taq DNA polymerase (5 U mL-1, MBI Fermentas, Canada), 1mL 20mM each primer, 1mL DNA template (10-50 ng)
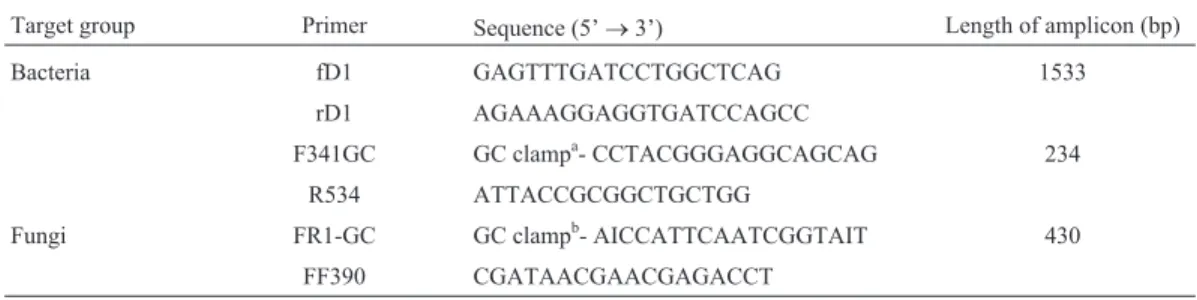
were prepared. A touchdown PCR strategy was employed as follows: 5 min at 94 °C, 20 cycles of 1 min at 94 °C, 45 s at temperatures decreasing from 65 °C to 55 °C, 2 min at 72 °C, 10 cycles of 1 min at 94 °C, 45 s at 55 °C, 2 min at 72 °C, and final extension for 5 min at 72 °C. PCR amplifi-cation of a 16S rDNA V3 fragment using primer pair F341GC/R534 was carried out in a 25mL containing 2.5mL PCR buffer, 1.5 mL MgCl2, 2.8 mL dNTPs, 0.5 mL Taq DNA polymerase, 0.5mL each primer, 1mL DNA template (Amplicons resulted from fD1/rD1 were diluted 1:100). Concentrations of PCR components and cycling conditions were the same as above. For fungi, fragments of 18S rRNA gene were amplified with primer pair FR1-GC/FF390 as described by Vainio and Hantula (2000). All PCR compo-nents (50mL) were the same as fD1/rD1 reactions except for PCR buffer (10 x buffer with KCl) and primer pair. The PCR procedure was as follows: 3 min at 95 °C, then 35 cycles of 30 s at 95 °C, 45 s at 50 °C, 1 min at 72 °C, and final exten-sion for 10 min at 72 °C (Beauregardet al., 2010). All reac-tions were carried out using a Whatman Biometra T1 96-well Thermocycler. Primer sequences are listed in Table 1.
TGGE and diversity measurements
PCR products were loaded on 0.45-mm thick 8% de-naturing gels (8% polyacrylamide gel (Acr/Bis = 37.5:1), 1 x TAE (40 mM Tris-Cl, 1 mM EDTA), 2% glycerol, and 8 M urea). TGGE was performed using a TGGE system (Whatman Biometra, Germany). All gels were run at 130 V for 3 h with 1 x TAE buffer. Temperature gradient was opti-mized at 56-69 °C for bacteria and 49-61 °C for fungi. After electrophoresis, gels were silver-stained using the proce-dures devised by Bassam and Caetano-Anollés (1993). Gel images were captured using the Cannon camera and ana-lyzed by the Bio-rad Quantity One software. The diversity indices, including richness index and Shannon index, were calculated according to TGGE patterns, respectively. Each resolved band was considered as a specific phylotype. The pixel intensity of each band detected by Quantity One soft-ware represented the abundance of a specific phylotype for diversity estimations. The Shannon-Weaver indices (H’)
(Shannon and Weaver, 1963) were calculated using the fol-lowing Eq. (1):
H’ = -Spilnpi (1)
wherepi=ni/Sn,niis the abundance of theith phylotype
per lane, andSn is the total abundance of all phylotypes per lane. In theory,H’ values range from 0 (only one species present in the sample) to 5 (all species in the sample are rep-resented by the same number of individuals), but in fact,H’ values usually lie between 1.5 and 3.5 for ecological data and rarely exceed 4.0 (Seaby and Henderson, 2006). In gen-eral, more disturbed and less stable environments have lowerH’ values.
Finally, cluster analysis according to the TGGE pat-terns was employed to produce the dendrograms by the un-weighted pair-group method with arithmetic average (UPGMA) method using Quantity One software.
16S/18S rRNA genes sequence determination
The dominant bands in the TGGE gels with the same mobility were excised, incubated overnight in 10 mM Tris-HCl (pH 8.0) to elute DNA, re-amplified as described above, and electrophoresed with TGGE. Band excision, PCR, and TGGE were repeated until a single band was present. PCR products generated from TGGE bands were amplified with primers without GC-clamp at the 5’-end. Purified PCR products were ligated into the pMD19-T vec-tor (TaKaRa Biotechnology, Dalian, China) according to the manufacturer’s instructions. Four positive clones per band were used for DNA sequencing. The obtained partial environmental 16S/18S rRNA gene sequences were depos-ited in the European Nucleotide Archive database under ac-cession numbers HE867098-HE867106 and compared to the sequences in NCBI GenBank database using the BLAST 2.2 program.
Statistical analysis
One-way ANOVA was employed to analyze the dif-ference of all indices at each distance. Post hoc tests for each variable were made using LSD comparisons. The Pearson correlation analysis was utilized to determine the correlations between all the measured parameters.
Signifi-Table 1- Primer used in this study.
Target group Primer Sequence (5’®3’) Length of amplicon (bp)
Bacteria fD1 GAGTTTGATCCTGGCTCAG 1533
rD1 AGAAAGGAGGTGATCCAGCC
F341GC GC clampa- CCTACGGGAGGCAGCAG 234
R534 ATTACCGCGGCTGCTGG
Fungi FR1-GC GC clampb- AICCATTCAATCGGTAIT 430
FF390 CGATAACGAACGAGACCT
a
cant differences for all statistical tests were evaluated at the level of p£0.05 unless noted otherwise. All data analyses were conducted with the SPSS software (SPSS for Win-dows, Version 13.0, Chicago, IL).
Results
Soil chemical properties and number of microbes in relation to distance
pH of all soils were slight acid. SWC and SOM con-tents ranged from 58.5 to 70.6% and from 3.03 to 4.64%, respectively (Table 2). From ANOVA analysis, soil pH, AN and AK contents decreased gradually with increasing distance from the open drainage ditch and were signifi-cantly greater (p < 0.05) at 5-m than that at 75-m distance. SOM contents were the lowest at 25 m distance and the highest at 75-m distance. SWC increased gradually with increasing distance and was significantly lower at 5-m than the other distances (p < 0.05). There were no signifi-cant differences (p < 0.05) in soil AP contents detected at all distances. The highest populations of culturable aero-bic bacteria and fungi were at 15-m distance and the low-est at 75-m distance. Moreover, significant differences (p < 0.05) in fungi populations were also observed at all distances.
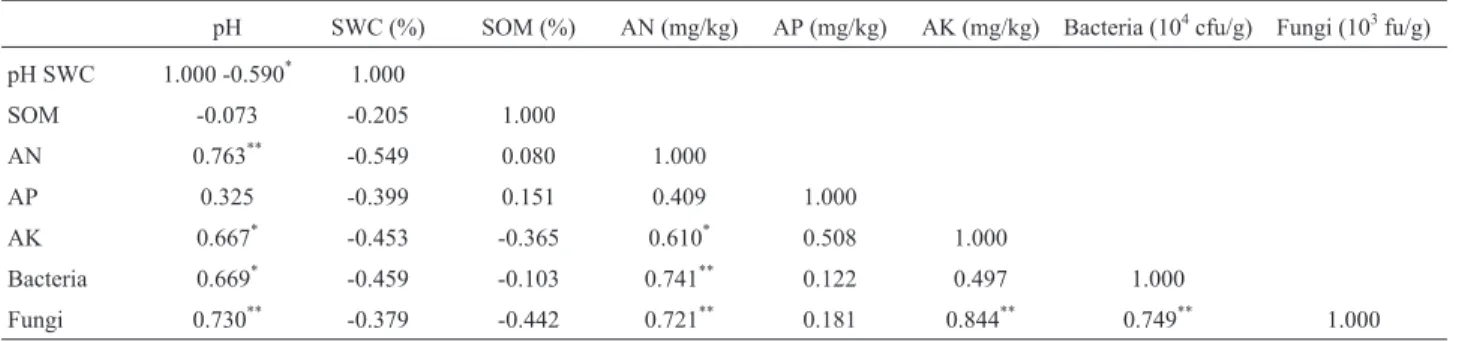
According to Pearson’s correlation analyses, the numbers of culturable aerobic bacteria and fungi showed significantly positive correlation with soil pH (i.e., R = 0.669, p < 0.05 and R = 0.730, p < 0.01, respectively) and AN contents (i.e., R = 0.741, p < 0.01, and R = 0.721, p < 0.01, respectively) but not with SWC, SOM and AP
contents (Table 3). In addition, fungi counts also showed significantly positive correlation with AK contents (i.e., R = 0.844, p < 0.01).
Microbial community structure associated with ditch distance
TGGE analysis was performed using three replicate samples from each distance in the CWP field. TGGE results demonstrated that the number of bands in eubacterial 16S rDNA amplified fragment was higher than that in fungal 18S rDNA amplified fragment from all distances except for 5-m distance (Figure 2). For bacteria, TGGE patterns showed regular changes associated with the distance from the open drainage ditch. Some bands (Figure 2a, from 1B to 7B) of 16S rRNA gene gradually became stronger with in-crease in distance, but some others gradually turned fainter such as band 1b, and even disappeared such as band 2b and 3b (Figure 2a). However, the TGGE profile of fungi showed abrupt shift from 5-m to 15-m distance. 18 rRNA gene bands were abundant at a distance of 5 m, but few at distances of 15 m, 25 m and 75 m. Moreover, there were some specific bands at a certain distance, such as 1F (Figu-re 2b) at 75 m, and 2F at 25 m (Figu(Figu-re 2b).
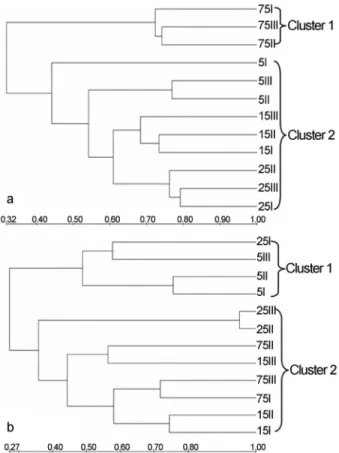
Cluster analyses of the TGGE profiles generally dis-tinguished the bacterial and fungal communities into two major clusters (Figure 3). In the bacterial community, those soils at distances of 5, 15 and 25 m with relatively similar banding patterns clustered together, but those at 75-m dis-tance formed another cluster (Figure 3a). The dendrogram of clustering for the fungal community was distinctly dif-ferent from that for the bacterial community. Those soil
Table 2- Average of soil properties, soil available nutrients and microbial populations at different sampling sites.
Site pH SWC (%) SOM (%) AN (mg/kg) AP (mg/kg) AK (mg/kg) Bacteria (104cfu/g) Fungi (103cfu/g) 5 m 6.73±0.10a* 58.5±2.2b 3.87±0.27ab 159.4±9.4a 6.72±4.06a 51.6±15.7a 10.60±1.09ab 3.94±0.82b 15 m 6.570.25ab 68.0±6.8a 3.61±1.36ab 152.821.8ab 2.95±0.41a 48.5±9.4a 13.61±4.39a 4.88±0.29a 25 m 6.12±0.21bc 69.5±4.9a 3.03±0.18b 130.2±12.4bc 3.13±0.23a 37.8±15.7a 7.98±1.75bc 2.60±0.39c 75 m 5.79±0.47c 70.6±3.7a 4.64±0.18a 111.3±13.2c 3.04±1.60a 12.7±0.0b 5.16±0.27c 0.23±0.05d *
Values are given as means±S.D. (n = 3); values within a column followed by different lowercase letters are significantly different (n = 3, LSD, p < 0.05).
Table 3- Pearson’s correlation between soil properties, soil available nutrients and microbial populations.
pH SWC (%) SOM (%) AN (mg/kg) AP (mg/kg) AK (mg/kg) Bacteria (104cfu/g) Fungi (103fu/g) pH SWC 1.000 -0.590* 1.000
SOM -0.073 -0.205 1.000
AN 0.763** -0.549 0.080 1.000
AP 0.325 -0.399 0.151 0.409 1.000
AK 0.667* -0.453 -0.365 0.610* 0.508 1.000
Bacteria 0.669* -0.459 -0.103 0.741** 0.122 0.497 1.000
Fungi 0.730** -0.379 -0.442 0.721** 0.181 0.844** 0.749** 1.000
*
samples at distances of 15, 25 and 75 m, except for sample 25I, were assigned to one cluster, while those at 5-m dis-tance and sample 25I were detected in another cluster (Fig-ure 3b). The richness and Shannon indices for bacteria and fungi both showed the minimum values at 15-m distance (Table 4). The bacterial and fungal Shannon-Weaver indi-ces (H’) at four distances ranged from 2.772 to 3.071 and from 2.055 to 3.148, respectively (Table 4). The highest di-versity (H’ = 3.071) of bacterial community was found at a distance of 25 m, while that (H’ = 3.148) of the fungal com-munity was observed at a distance of 5 m, which was signif-icantly different from the diversity at the other distances (p < 0.05, Table 4).
Nucleotide sequencing and analysis
Seven dominant bacterial bands (1B, 2B, 3B, 4B, 1b, 2b, and 3b) in Figure 2a and two specific fungal bands (1F and 2F) in Figure 2b were excised for sequence analysis. The BLAST analysis of the 16S rDNA sequences derived from TGGE gel bands classified these sequences into six main groups:Chloroflexi(1B),Deltaproteobacteria(2B),
Acidobacteria (3B and 3b), Betaproteobacteria (4B),
Gammaproteobacteria(1b) andAlphaproteobacteria(2b) (Table 5). Furthermore, band 2B was highly similar to the
Geobacteraceae (96%) which was the closest cultivated relative of hits in GenBank database, and band 4B was highly similar to the cultivated relative Curvibacter sp.
Figure 2- TGGE profiles of (a) 16S rRNA and (b) 18S rRNA gene of soil samples at different distances.
Figure 3- Cluster analysis of TGGE fingerprints from the gels in Figure 2. (a) 16S rRNA and (b) 18S rRNA gene.
Table 4- Comparison of microbial diversity indices at different sampling sites.
Treatment Richness Shannon (H)
Bacteria Fungi Bacteria Fungi
5 m 31±1a* 38±3a 2.886±0.126b 3.148±0.098a
15 m 29±3b 15±4b 2.772±0.109b 2.055±0.225b
25 m 32±1a 21±10b 3.071±0.023a 2.149±0.754b
75 m 30±1a 18±4b 2.917±0.053ab 2.244±0.113b
ATCC 700892 (98%), while other bacterial bands had no similar cultivated hits in GenBank database (Table 5). The two fungal 18S rDNA sequences fell within the phylum
Chytridiomycota(1F) andZygomycota (2F), respectively (Table 5). Base on the closest cultivated hit of GenBank da-tabase, bands 1F and 2F were similar to Chytriomyces poculatus (98%) and Lepidostroma rugaramae (89%), re-spectively (Table 5).
Noticeably, the bacterial bands (1B, 2B, 3B, and 4B) in Figure 2a getting stronger and stronger from good drain-age (5 m) to poor draindrain-age (75 m) and finally leading to dominant microorganisms at 75-m distance, were most similar to the sequences retrieved from waterlogged envi-ronments or flooding zones, like lake sediment, rice paddy soil, wetland and etc (Table 5). However, bands 1b, 2b and 3b in Figure 2a gradually turning fainter or disappeared with increase in distance started from the open drainage ditch, were most similar to the organisms found in grass-land soil and dry grass-land without water logging (Table 5). Fur-thermore, the specific 18S rDNA sequences (1F and 2F) derived from dank soils of 25-m and 75-m distances in
Fig-ure 2b were highly similar (> 96%) to microorganisms in aquatic environments like eutrophic lake, stream sediment (Table 5).
Relationships between microbial diversity indices and other parameters
The correlation analyses indicated that the richness indices and Shannon indices of fungi were negatively cor-related with SWC (i.e., R = -0.667, p < 0.05 and R = -0.655, p < 0.05, respectively, Table 6), but those of bacteria were not. In addition, the richness indices of fungi was positively correlated with AP contents (i.e., R = 0.581, p < 0.05, Ta-ble 6). The Shannon indices of both bacteria and fungi showed significant positive correlation with the TGGE’s band number (i.e., R = 0.648, p < 0.05 and R = 0.954, p < 0.01, respectively, Table 6), but not with the number of culturable cells in Table 2.
Discussion
Although many studies on the effects of agricultural management practices on soil microbial communities have
Table 5- Tentative identification of dominant TGGE bands in TGGE gels and the closet match to the sequence from GenBank database with BLAST. Clone (accession
no.)
Dominant habitat
Phylogenetic groupa
Closest relative (accession no.)b
Isolation source Identity (%)
Closest cultivated relative (accession no.)c
Identity (%)
1B (HE867098) 75-m distance Chloroflexi UB (HQ636245) Lake sediment 100 -
-2B (HE867099) 75-m distance d-Proteobacteria UB (HM487998) Lake sediment 99 Geobacteraceae (EF059536) 96
3B (HE867100) 75-m distance Acidobacteria UB (AB660646) Rice paddy soil 100 -
-4B (HE867101) 75-m distance b-Proteobacteria UB (HM535093) Wetland soil 99 Curvibactersp. ATCC 700892 (HM357758)
98
1b (HE867102) 5-m distance 25-m distance
g-Proteobacteria UB (EU298759) Prairie soil 99 -
-2b (HE867103) 5-m distance 25-m distance
a-Proteobacteria UB (JQ649765) Polluted soil 100 -
-3b (HE867104) 5-m distance Acidobacteria UB (HQ597366) Grassland soil 99 -
-1F (HE867105) 75-m distance Chytridiomycota UE (JQ689413) Eutrophic lake 99 Chytriomyces poculatus (EF443135)
98
2F (HE867106) 25-m distance Zygomycota UE (AY689723) Stream sedi-ments
99 Lepidostroma rugaramae (FJ171731)
89
a
a, alpha;b, beta;g, gamma;d, delta. bUB represents uncultured bacterium. c
“-”represents no closest cultivated hit in GenBank.
Table 6- earson’s correlation between microbial diversity indices, soil properties and soil available nutrients.
pH SWC (%) SOM (%) AN (mg/kg) AP (mg/kg) AK (mg/kg) 16S Ra 18S Ra 16S Hb 18S Hb
16S R -0.101 -0.264 -0.355 -0.123 -0.014 -0.173 1.000 - -
-18S R 0.439 -0.667* 0.096 0.432 0.581* 0.361 0.159 1.000 -
-16S H -0.333 0.033 -0.106 -0.349 0.227 -0.129 0.648* 0.021 1.000
-18S H 0.456 -0.655* 0.165 0.329 0.539 0.300 0.086 0.954** -0.033 1.000
*
Significant at the 0.05 level;**significant at the 0.01 level. arepresents Richness index.
b
focused on irrigation pattern, fertilization regime, and till-age system (Zhanget al., 2008; Beauregardet al., 2010; Ceja-Navarroet al., 2010; Islamet al., 2011; Kamaaet al., 2011; Yanget al., 2011), only few studies have been done on ditch drainage. Ditch drainage with associated changes in soil properties led to distinct shifts of abundance and structure of bacterial and fungal communities, which sig-nificantly affected the soil ecosystem. Ditch drainage caused decrease in soil pH with increasing distance away from the open ditch (Table 2). Soil pH was one of the most influential factors in soil (Rousket al., 2010), and strongly affected all chemical, physical and biological soil proper-ties (Anderssonet al., 2000; Brady and Weil, 2002; Joneset al., 2009; Rousk et al., 2009), which were further con-firmed by our studies. Soil pH was shown to have signifi-cant positive correlation with contents of soil AN (R = 0.763, p < 0.01), AK (R = 0.667, p < 0.05), and num-bers of viable bacteria and fungi cells (R = 0.669, p < 0.05 and R = 0.730, p < 0.01, respectively, Table 3).
Soil microbial abundance is strongly influenced by soil physical and chemical properties (Hrelováet al., 1999; Kobarliet al., 2010; Honget al., 2011), including soil tex-ture, soil aggregate, soil pH, and soil nutrient. However, all of these soil factors can be altered by changes of agricul-tural managements. In our study, drainage led to obvious change in all detected parameters except for AP along dis-tance from the ditch. Among the detected parameters, soil pH and AN content were significantly and positively correlated with culturable aerobic bacterial counts and fun-gal counts, suggesting that both soil pH and AN content had marked influence on the growth of bacteria and fungi. Our findings were consistent with those of Brodieet al.(2002) that soil physicochemical factors, such as soil pH or AN content were the principal determinants controlling bacte-rial community in a field situation. In addition, AK content was significantly and positively correlated with fungi counts, indicating that soil AK content had an important impact on the abundance of culturable fungi in CWPS.
TGGE analysis revealed that some bands (from 1B to 7B) of bacteria became stronger with increasing distance, but some others turned fainter or disappeared (from 1b to 3b)(Figure 2a), which implied that some bacteria prolifer-ated with increasing poor drainage, while some others were suppressed,e.g., at 75-m distance under poor drainage con-dition, minimum populations of culturable aerobic bacteria were found (Table 2). From good drainage (5 m) to poor drainage (75 m), some aerobic organisms become quies-cent or die, and new inhabitants, possibly including faculta-tive (organisms which can function under both aerobic and anaerobic environments) and obligate anaerobic bacteria, took over (Inglettet al., 2005). This was confirmed by the tentative identification of dominant TGGE bands in Table 5, for instance, the 2B band sequence was highly similar to the familyGeobacteraceae, which were the obligate anae-robes predominating sedimentary environments
(Snoeyen-bos-Westet al., 2000; Holmes et al., 2007), and the 4B band sequence was highly similar to Curvibacter sp. ATCC 700892 belonging to microaerobic bacteria (Ding and Yokota, 2010).
Eickhorstet al.(2010) mentioned soil fungal commu-nities are the most important group of organisms involved in decomposing organic matter. In paddy soils, they are predominant only after drainage and during post-harvest fallow conditions as they need oxygen which is limited un-der flooded conditions. In our study, at 5-m distance with relatively good drainage conditions, the fungal communi-ties were much more diverse than those at other distances with relatively poor drainage conditions (Figure 2b). Addi-tionally, significant differences (p < 0.05) of the diversity indices were noted between 5 m and other distances (Ta-ble 4). Furthermore, two clusters of fungal dendrogram clearly distinguished between 5-m and the other distances (Figure 3b). These results could be explained by the close relationship between SWC and ditch drainage, since the significant differences in SWC (Table 2) were identical with the fungal diversity indices (Table 4) and SWC was also significantly and positively correlated with the fungal diversity indices (Table 6).
In comparison with bacteria, fungi seemed to be more easily affected by soil factors. For instance, the fun-gal abundance was noticeably influenced not only by soil pH and AN content, but also by soil AK, and fungal diversity was significantly affected by SWC and AP con-tents, while the bacteria diversity was not correlated with SWC and AP. These results suggested that fungal commu-nities were more sensitive to soil factors than bacteria communities. Therefore, changes in fungal community structures in agricultural soil might possibly serve as a sensitive indicator for changes in soil quality due to agri-cultural management (Kennedy and Smith, 1995; Schnei-deret al., 2010).
Compared to poorly drained paddy soils at 75-m dis-tance, well drained soils at 5-m distance gave significantly higher values in soil available nutrients, culturable mi-crobes (Table 2) and fungal diversity (Table 4), indicating the improvement of soil properties. In this experiment, the lack of knowledge of rice yields at four different distances was a weak point to judge the functioning of the drainage ditch. Therefore, further study should pay more attention to rice yields, soil characteristics, anaerobic microbial com-munities, draining rate and their relationships. It will help us know how to manage the drainage ditch.
Acknowledgments
References
Andersson S, Nilsson I, Saetre P (2000) Leaching of dissolved or-ganic carbon (DOC) and dissolved oror-ganic nitrogen (DON) in mor humus as affected by temperature and pH. Soil Biol Biochem 32:1-10.
Bassam BJ, Caetano-Anollés G (1993) Silver staining of DNA in polyacrylamide gels. Appl Biochem Biotech 42:181-188. Beauregard MS, Hamel C, St-Arnaud ANM (2010) Long-term
phosphorus fertilization impacts soil fungal and bacterial di-versity but not AM fungal community in alfalfa. Microb Ecol 59:379-389.
Brady NC, Weil RR (2002) The Nature and Properties of Soil. Springer, Netherlands.
Brodie E, Edwards S, Clipson N (2002) Bacterial community dy-namics across a floristic gradient in a temperate upland grassland ecosystem. Microb Ecol 44:260-270.
Ceja-Navarro JA, Rivera FN, Patiño-Zúñiga L, Govaerts B, Marsch R, Vila-Sanjurjo A, Dendooven L (2010) Molecular characterization of soil bacterial communities in contrasting zero tillage systems. Plant Soil 329:127-137.
Cheng YS (1984) Effects of drainage on the characteristics of paddy soils in China.In: Banta, S., Mendoza, C.V.(eds). Or-ganic Matter and Rice. International Rice Research Institute (IRRI), Los Banos, Philippines, pp 417-427.
Ding L, Yokota A (2010)Curvibacter fontanasp. nov., a micro-aerobic bacteria isolated from well water. J Gen Appl Micro-biol 56:267-271.
Eickhorst T, Remesch M, Kuever J, Tippkötter R (2010) Molecu-lar characterization of soil fungal communities in paddy soils. Proceedings of the 19th World Congress of Soil Sci-ence: Soil Solutions for a Changing World. Brisbane, Aus-tralia. 1-6, August 2010, 22-24. http://www.iuss.org/ 19th%20WCSS/Symposium/pdf/1842.pdf.
Holmes DE, O’Neil RA, Vrionis HA, N’Guessan LA, Ortiz-Bernad I, Larrahondo MJ, Adams LA, Ward JA, Nicoll JS, Nevin KP, Chavan MA, Johnson JP, Long PE, Lovley DR (2007) Subsurface clade of Geobacteraceae that predomi-nates in a diversity of Fe(III)-reducing subsurface environ-ments. The ISME Journal 1:663-677.
Hong YG, Li M, Cao H, Gu JD (2011) Residence of Habi-tat-Specific Anammox Bacteria in the Deep-Sea Subsurface Sediments of the South China Sea: Analyses of Marker Gene Abundance with Physical Chemical Parameters. Microb Ecol 62:36-47.
Hrelová H, Chvátalová I, Vosátka M, Klír J, Gryndler M (1999). Correlation of abundance of arbuscular mycorrhizal fungi, bacteria and saprophytic microfungi with soil carbon, nitro-gen and phosphorus. Folia Microbiol 44:683-587.
Inglett PW, Reddy KR, Corstanje R (2005) Anaerobic Soils.In: Hillel, D. (ed).Encyclopedia of Soils in the Environment. Academic Press, London, pp 72-78.
Islam MR, Puneet R, Chauhan S, Kim Y, Kim M, Sa TM (2011) Community level functional diversity and enzyme activities in paddy soils under different long-term fertilizer manage-ment practices. Biol Fertil Soils 47:599-604.
Jackson ML (1979) Soil Chemical Analysis. Wisconsin Univer-sity, Madison, WI.
Jiang CJ, Chen PH, Shan S (1995) Total microcolony counting on the moving narrow culture band. J Microbiol Meth 23:297-300.
Jones RT, Robeson MS, Lauber CL, Hamady M, Knight R, Fierer N (2009) A comprehensive survey of soil acidobacterial di-versity using pyrosequencing and clone library analyses. ISME J 3:442-453.
Kamaa M, Mburu H, Blanchart E, Chibole L, Chotte JL, Kibunja C, Lesueur D (2011) Effects of organic and inorganic fertil-ization on soil bacterial and fungal microbial diversity in the Kabete long-term trial, Kenya. Biol Fertil Soils 47:315-321. Kennedy AC, Smith KL (1995) Soil microbial diversity and the
sustainability of agricultural soils. Plant Soil 170:75-86. Kobarli T, Fujii T, Kobari Y, Habano A (2010) Seasonal
varia-tions in abundance, growth and mortality of heterotrophic bacteria in Kagoshima Bay. J Oceanogr 66:845-853. Li QH, Wang F, He CM, Lin C, Li Y, Lin XJ (2011) Formation,
difficulties and utilization of cold water paddy fields in Fujian. Fujian J Agric Sci 26:681-685.
Muyzer G, De Waal EC, Uitterlinden AG (1993) Profiling of complex microbial populations by denaturing gradient gel electrophoresis analysis of polymerase chain reaction-am-plified genes coding for 16S rRNA. Appl Environ Microbiol 59:695-700.
Needelman BA, Kleinman PJA, Strock JS, Allen AL (2007) Im-proved management of agricultural drainage ditches for wa-ter quality protection: An overview. J Soil Wawa-ter Conserv 62:171-178.
Rousk J, Brookes PC, Bååth E (2009) Contrasting soil pH effects on fungal and bacterial growth suggests functional redun-dancy in carbon mineralisation. Appl Environ Microbiol 75:1589-1596.
Rousk J, Brookes PC, Bååth E (2010) Investigating the mecha-nisms for the opposing pH relationships of fungal and bacte-rial growth in soil. Soil Biol Biochem 42:926-934. Schneider S, Hartmann M, Enkerli J, Widmer F (2010) Fungal
community structure in soils of conventional and organic farming systems. Fungal Ecol 3:215-224.
Seaby RMH, Henderson PA (2006) Measuring and understanding biodiversity. http://www.piscesconservation.com.
Shannon C, Weaver W (1963) The Mathematical Theory of Com-munication. Illinois University Press, Urbana Champaign, IL.
Smith NR, Dawson VT (1944) The bacteriostatic action of rose Bengal in media used for the plate counts of soil fungi. Soil Sci 58:467-471.
Snoeyenbos-West OL, Nevin KP, Anderson, RT, Lovley DR (2000) Enrichment of Geobacter species in response to stim-ulation of Fe(III) reduction in sandy aquifer sediments. Mi-crobial Ecol 39:153-167.
Thomas GW (1996) Soil pH and soil acidity.In: Sparks, DL, Page, AL, Helmke, PA, Loeppert, RH (eds) Methods of Soil Analysis. Soil Science Society of America, Madison, WI, pp 475-490.
Vainio EJ, Hantula J (2000) Direct analysis of wood-inhabiting fungi using denaturing gradient gel electrophoresis of ampli-fied ribosomal DNA. Mycol Res 104:927-936.
Walkley A, Black LA (1934) An examination of the Degtjareff method of determing soil organic matter, and a proposed modification of the chromic acid titration method. Soil Sci 37:29-38.
Yang SK, Kim MK, Seo WW, Choi KJ, Lee ST, Kwak YS, Lee YH (2011) Soil microbial community analysis of between no-till and tillage in a controlled horticultural field. World J Microb Biot doi:10.1007/s11274-011-0933-x.
Zhang SH, Chen DD, Sun DH, Wang XT, Smith JL, Du GZ (2011) Impacts of altitude and position on the rates of soil ni-trogen mineralization and nitrification in alpine meadows on the eastern Qinghai-Tibetan Plateau, China. Biol Fertil Soils doi:10.1007/s00374-011-0634-5.
Zhang YL, Daib JL, Wang RQ, Zhang J (2008) Effects of long-term sewage irrigation on agricultural soil microbial struc-tural and functional characterizations in Shandong, China Eur J Soil Biol 44:84-91.
Zhou JZ, Bruns MA, Tiedje JM (1996) DNA recovery from soils and diverse composition. Appl Environ Microbiol 62:316-322.