Tandem repeat distribution of gene transcripts in three plant families
Luciano Carlos da Maia
1, Velci Queiróz de Souza
2, Mauricio Marini Kopp
3,
Fernando Irajá Félix de Carvalho
1and Antonio Costa de Oliveira
11
Centro de Genômica e Fitomelhoramento, Faculdade de Agronomia Eliseu Maciel,
Universidade Federal de Pelotas, Pelotas, RS, Brazil.
2
Departamento de Agronomia, Universidade Federal de Santa Maria, Frederico Westphalen, RS, Brazil.
3
Embrapa Gado de Leite, Juiz de Fora, MG, Brazil.
Abstract
Tandem repeats (microsatellites or SSRs) are molecular markers with great potential for plant genetic studies. Mod-ern strategies include the transfer of these markers among widely studied and orphan species.In silico analyses al-low for studying distribution patterns of microsatellites and predicting which motifs would be more amenable to interspecies transfer. Transcribed sequences (Unigene) from ten species of three plant families were surveyed for the occurrence of micro and minisatellites. Transcripts from different species displayed different rates of tandem re-peat occurrence, ranging from 1.47% to 11.28%. Both similar and different patterns were found within and among plant families. The results also indicate a lack of association between genome size and tandem repeat fractions in expressed regions. The conservation of motifs among species and its implication on genome evolution and dynam-ics are discussed.
Key words:SSR, EST, comparative genomics, molecular markers.
Received: February 27, 2009; Accepted: June 17, 2009.
Introduction
Microsatellites or SSRs (Simple sequence repeats) are DNA sequences formed by the tandem arrangement of nucleotides through the combination of one to six base pairs, being widely distributed in prokaryote and eukaryote genomes (Morgante and Olivieri, 1993; Tóthet al., 2000). Microsatellite regions tend to form loops or hairpin structures, leading to the slippage of DNA poly-merase during replication, thereby provoking the insertion or deletion of nucleotides (Iyeret al., 2000). The expan-sion and/or contraction of microsatellites may lead to a gain or loss of gene function (Liet al., 2002, 2004a). Ini-tially, it was suggested that the occurrence and distribu-tion of microsatellites could be the result of random processes. However, new evidence indicates that the genomic distribution of these repeats had its origin in non-random processes (Bell, 1996; Li et al., 2004b). Microsatellites have been reported to correspond to 0.85% of Arabidopsis (Arabidopsis thaliana), 0.37% of maize (Zea mays subsp. mays), 3.21% of fugu fish (Fugu rubripes), 0.21% of the nematodeCaenorhabditis elegans
and 0.30% of yeast (Saccharomyces cerevisae) genomes
(Morganteet al., 2002). Moreover, they constitute 3.00% of the human genome (Subramanianet al., 2003).
For microsatellites located in genic regions, 5’UTRs are hotspots for the presence of this type of repeats. It is known that the contraction and/or expansion of repeats found in 5’UTR regions alter the transcription and/or trans-lation of these genes (Liet al., 2004b; Zhanget al., 2006a). Mutations in microsatellite loci found in 3’UTR regions are associated with gene silencing, transcript-cytosol exporting and splicing mechanism changes as well as the expression levels of flanking genes (Daviset al., 1997; Thorntonet al., 1997; Philipset al., 1998; Conneet al., 2000). For coding sequences (CDS), the impact of mutations has been de-scribed as functional changes, loss of function and protein truncation (Liet al., 2004b). Although much has been re-ported on microsatellites frequencies in transcribed regions in plants (Temnykhet al., 2001; McCouchet al., 2002; Morganteet al., 2002; Thielet al., 2003, Nicotet al., 2004; Kashi and King, 2006; Lawon and Zhang, 2006; Varshney
et al., 2006; Zhanget al., 2006b), additional comparative or descriptive analysis can offer novel perspectives on their use as molecular markers. The genomic abundance of microsatellites, and their ability to associate with many phenotypes, make this class of molecular markers a power-ful tool for diverse application in plant genetics. The identi-fication of microsatellite markers derived from EST and/or cDNAs, and described as functional markers, represents an
Genetics and Molecular Biology, 32, 4, 822-833 (2009)
Copyright © 2009, Sociedade Brasileira de Genética. Printed in Brazil www.sbg.org.br
Send correspondence to Antonio Costa de Oliveira. Centro de Genômica e Fitomelhoramento, Faculdade de Agronomia Eliseu Maciel, Universidade Federal de Pelotas, Caixa Postal 354, 96001-900 Pelotas, RS, Brazil. E-mail: [email protected].
even more useful possibility for these markers when com-pared to those based on assessing anonymous regions (Varshneyet al., 2005, 2006).
In order to provide information regarding the patterns of microsatellite occurrence and distribution on transcribed genome regions, non-redundant full-length cDNAs (fl -cDNAs) and/or ESTs belonging to ten plant species from three different families (Brassicaceae, Solanaceae and Poaceae) were used.
Material and Methods
Obtaining the expressed sequence
Files containing expressed sequences were obtained for the following families/species: Brassicaceae (Arabidopsis thaliana and Brassica napus), Solanaceae (Solanum lycopersicum and Solanum tuberosum) and Poaceae (Oryza sativa, Sorghum bicolor, Triticum aestivum, Zea mays, Saccharum officinarumandHordeum vulgare), all deposited in the NCBI-Unigene data-base. Non-redundant yet representative sequences for all known genes in each species were selected. The sequences used in the present study were downloaded from the Unigene data-base in June, 2008.
Distribution of sequences in different transcribed regions
By using computer scripts developed in Perl language and based on the existing annotation for each of the cDNAs and/or ESTs sequences, the sequences were categorized as CDS, upstream and downstream regions, partitioned into fasta files and denominated CDS, 5’ UTR and 3’ UTR for each species. Since the annotation of introns was not part of the database, the repeats present in intronic regions were not considered in this study.
Location of tandem repeats
SSRLocatorsoftware was used (Maiaet al., 2008) for the location of tandem repeats. Software options were ad-justed to locate monomers, dimers, trimers, pentamers and hexamers containing a minimum of 10, 7, 5, 4 and 4 re-peats, respectively. For mini-satellites, heptamer, octamer, nonamer and decamers containing a minimum of 3, 3, 3 and 2 repeats, respectively, were selected.
Results and Discussion
Distribution of sequences in UTRs and CDSs
The sequences, separated into coding (CDS) and un-translated (5’UTR and 3’UTR) regions, and distributed by number of sequences, amount (Mb) and average size (bp) for all the ten species, are shown in Table 1. On an average and in all of these, there were sequence fragments between 560 and 893 bp long, except for the A. thalianaand O. sativadatabases,where they were longer, reaching aver- Table
ages of 1,447 and 1,490 bp, respectively. The number of se-quences deposited in Unigene was the largest for both of the Poaceae speciesZ. maysandO. sativa, with 57,447 and 40,259, respectively. It is worthy of note that not all se-quences deposited in this database contain 5’UTR and 3’UTR regions, for in some both types are found, whereas in others only one is (i.e., 5’ or 3’UTR). The overall average sizes were found to be 130 bp for 5’UTR, 873 bp for CDS and 270 bp for 3’UTR regions. The total nucleotides allo-cated to each were, on an average, 0.9% for 5’UTR, 97.5% for CDS and 1.6% for 3’UTR. The only species with con-trasting values was Arabidopsis, where 6.8%, 82.6% and 10.7% of total nucleotides were allocated to 5’UTR, CDS and 3’UTR regions, respectively.
Percentage of expressed sequences with tandem repeats
On an average, 3.55% of analyzed sequences contain one or more loci with tandem repeats. The respective per-centages for each species are shown in Figure 1. The high-est were for rice (11.28%), and the lowhigh-est for the Solanaceae speciesS. lycopersicumandS. tuberosum,i.e., 1,47% and 1,76%, respectively. The percentage found for
Arabidopsis(3.88%) is in agreement with other reports of between 3% and 5% (Cardle et al., 2000; Kumpatla and Mukhopadhyay, 2005). ForB. napus,S. lycopersiconand
S. tuberosum2.42%, 1.47% and 1.76% of these sequences were found, respectively. However, different values (6.9%, 4.7% and 2.65%, respectively) have been reported (Kum-patla and Mukhopadhyay, 2005). For the Poaceae, a com-parison of present results with former reports forH. vulgare
(4.25%vs. 8.11%), Z. mays (2.14%vs. 1.5%),O. sativa
(11.28%vs.4.7%),S. officinarum(2.13%vs.2.9%) andT. aestivum(2.38%vs.7.5%) show a different range of values (Cordeiroet al., 2001; Kantety et al., 2002; Thielet al., 2003; Nicotet al., 2004; Aspet al., 2007). Nevertheless, all differences are within the 2-3 fold range.
The variations encountered in different reports are lated to the strategy employed by the authors (software, re-peat number and type defined for the search). However, by common agreement, microsatellite stretches with mini-mum sizes of 20 bp are present in approximately 2%-5% of cereal EST sequences (Varshneyet al., 2005).
Frequency of tandem repeats in UTR and CDS regions
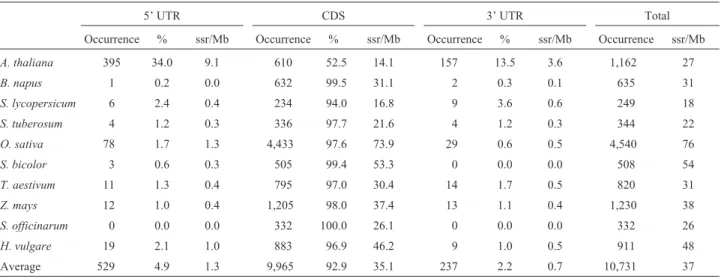
Results for total occurrence (total loci), percentage per region (the amount of loci per region divided by their total number) and frequencies (amount of loci per megabase) are shown separately for each species and by genic region (5’UTR, CDS and 3’UTR) in Table 2. In the 5’UTR and 3’UTR regions, 4.92% (529 loci) and 2.21% (237 loci), respectively, of all repeats were found in all the surveyed species (10,731 loci), with an average frequency of 1.3 and 0.7 loci/Mb, respectively. In coding regions (CDS), a higher occurrence of micro and minisatellites was detected, this reaching 92.86% of the total loci found (9,965
824 Gene transcripts in three plant families
Table 2- Overall distribution of tandem repeat occurrences in translated and non-translated transcripts.
5’ UTR CDS 3’ UTR Total
Occurrence % ssr/Mb Occurrence % ssr/Mb Occurrence % ssr/Mb Occurrence ssr/Mb
A. thaliana 395 34.0 9.1 610 52.5 14.1 157 13.5 3.6 1,162 27
B. napus 1 0.2 0.0 632 99.5 31.1 2 0.3 0.1 635 31
S. lycopersicum 6 2.4 0.4 234 94.0 16.8 9 3.6 0.6 249 18
S. tuberosum 4 1.2 0.3 336 97.7 21.6 4 1.2 0.3 344 22
O. sativa 78 1.7 1.3 4,433 97.6 73.9 29 0.6 0.5 4,540 76
S. bicolor 3 0.6 0.3 505 99.4 53.3 0 0.0 0.0 508 54
T. aestivum 11 1.3 0.4 795 97.0 30.4 14 1.7 0.5 820 31
Z. mays 12 1.0 0.4 1,205 98.0 37.4 13 1.1 0.4 1,230 38
S. officinarum 0 0.0 0.0 332 100.0 26.1 0 0.0 0.0 332 26
H. vulgare 19 2.1 1.0 883 96.9 46.2 9 1.0 0.5 911 48
Average 529 4.9 1.3 9,965 92.9 35.1 237 2.2 0.7 10,731 37
occurrences) with an average frequency of 35.1 loci/Mb. The higher percentage of repeats occurred in CDS regions as a consequence of the trimers present in this region. How-ever, forArabidopsis, high percentages of dimer (17.9%), trimer (19.3%) and total (44.5%) microsatellites were found in UTR regions, thus contrasting with the other spe-cies (Table 3). For the Rosaceae, between 44.3% and 53.2% of the microsatellites were found in UTR regions (Junget al., 2005). ForArabidopsis, 81% and 26%, respec-tively, of dimers and trimers were found in UTR regions (Yuet al., 2004).
In the present study, a very high percentage of micro-satellites in 5’UTRs were detected inArabidopsis,with a frequency of 9.1 loci/Mb. These repeats represented 34% of all the 1,162 found in the 29,918 sequences analyzed in this species. The second and third highest frequencies of re-peats in these regions were encountered in the speciesO. sativaandH. vulgare, with an average 1.3 and 1.0 loci/Mb, respectively (Table 2).
Many studies indicate the UTR regions as being more abundant in microsatellites than CDS regions (Morganteet al., 2002). In the present work, 92.86% of microsatellite loci in CDS regions are due to a deficiency in annotation when separating translated from non-translated fractions in the Unigene transcript database.
As observed for 5’UTRs, contrasting values were also found in 3’UTR regions. Much higher values were en-countered inArabidopsis(an average of 3.6 loci/Mb) when compared to those below 0.6 loci/Mb in the remaining spe-cies (Table 2).
On considering the overall occurrence of 5’UTRs, 3’UTRs and CDSs in all species, the average frequency ob-served is 37 loci/Mb. Values normally range from 18 loci/Mb in tomato to 76 in rice. Average frequency val-ues per family are 29.0 loci/Mb in the Brassicaceae, 19.9 in the Solanaceae and 45.4 in the Poaceae (Table 2).
Several reports have indicated values higher than those found in this study,i.e., 112-133 loci/Mb in barley, 133 loci/Mb in maize, 94-161 loci/Mb in wheat, 158-169 loci/Mb in sorghum, 161 loci/Mb in rye, 256-277 loci/Mb in rice and 133 loci/Mb inArabidopsis
(Varshney et al., 2002; Thiel et al., 2003; Parida et al., 2006). In Citrus species, values as high as 507 loci/Mb have been described in EST sequences (Palmieriet al., 2007). Values as high as 125 loci/Mb were also noted inBrassica rapa(Hong et al., 2007). Frequency values closer to our study have been reported for the CDS regions in Rosa chinensis(Rose),Prunus dulcis(Almond),Prunus persica
(Peach) andArabidopsis, with values ranging from 39 to 78 loci/Mb (Junget al., 2005).
Percentage occurrence of different microsatellite types in the UTR and CDS regions
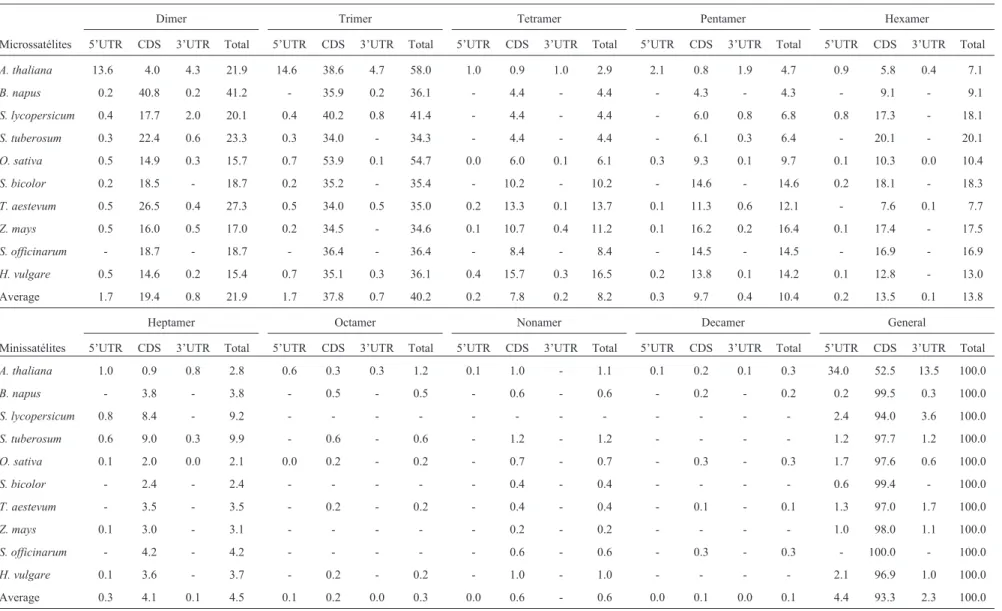
The detailed percentage values for each repeat type in the diverse sections of a genic region are listed for each
spe-cies in Table 3. The average occurrence of dimer micro-satellites in all the species was 21.9%, the majority of these loci being present in the CDS regions. The average percent-age of dimer occurrence for each family was 31.5% in Brassicaceae, 21.7% in Solanaceae and 18.8% in Poaceae species. The percentage values for dimer microsatellites in CDS regions ranged from 4.0% inArabidopsisto 40.8% in
B. napus.An interesting feature which seems to be specific for theArabidopsisgenome is the high occurrence of dimer microsatellites in the 5’ and 3’ UTR regions (13,6% and 4,3%, respectively). In the Poaceae, dimer microsatellites ranged from 15.4% in barley to 27.3% in wheat (Table 3). Other studies indicated that the highest dimer occurrence rates are generally associated with 5’UTR regions (Mor-ganteet al., 2002; Lawson and Zhang, 2006; Honget al., 2007), but one should bear in mind that this prevalence in CDS regions may be a consequence of deficient database annotation. Trimer microsatellites were found in 40.2% of the sequences, with a high predominance in CDS regions. The species with higher trimer values wereArabidopsis, rice and tomato, with 58.0%, 54.7% and 41.4% of occur-rence, respectively. The average percentage of trimers within each family was 47.0% in the Brassicaceae, 37.8% in the Solanaceae and 38.7% in the Poaceae. Among Poaceae species, the highest percentage of trimer occur-rence was found in rice (54.7%) and the lowest in maize (34.6%). In Brassicaceae, trimers were found more fre-quently in Arabidopsis(58.0%) and less so in B. napus
(36.1%) (Table 3).
On an average, tetramers represented 8.2% of the mi-crosatellites, with average frequencies of 3.4%, 4.4% and 11.0% in Brassicaceae, Solanaceae and Poaceae, respec-tively. Among the Brassicaceae, a less than one-fold differ-ence in frequencies was observed between Arabidopsis
(2.9%) andB. napus(4.4%). In Poaceae, a 2.7-fold differ-ence was found between rice (6.1%) and barley (16.5%).
On an average, pentamers represented 10.36% of the microsatellites, with average frequencies of 4.5%, 6.6% and 13.6% in the Brassicaceae, Solanaceae and Poaceae, respectively (Table 3). Less than one-fold differences were found between Brassicaceae and Solanaceae species. Nev-ertheless, in the Poaceae a 1.7-fold difference was found between rice (9.7%) and maize (16.5%).
On an average, hexamers represented 13.8% of the microsatellites, with average frequencies of 8.1%, 19.1% and 13% in the Brassicaceae, Solanaceae and Poaceae, re-spectively. In the Poaceae, a 2.4-fold difference was found between wheat (7.7%) and sorghum (18.3%).
826
Gene
transcripts
in
three
plant
families
Table 3- Overall occurrence, in percentage, of microsatellite and minisatellite motifs in different sections of genic regions of ten plant species.
Dimer Trimer Tetramer Pentamer Hexamer
Microssatélites 5’UTR CDS 3’UTR Total 5’UTR CDS 3’UTR Total 5’UTR CDS 3’UTR Total 5’UTR CDS 3’UTR Total 5’UTR CDS 3’UTR Total
A. thaliana 13.6 4.0 4.3 21.9 14.6 38.6 4.7 58.0 1.0 0.9 1.0 2.9 2.1 0.8 1.9 4.7 0.9 5.8 0.4 7.1
B. napus 0.2 40.8 0.2 41.2 - 35.9 0.2 36.1 - 4.4 - 4.4 - 4.3 - 4.3 - 9.1 - 9.1
S. lycopersicum 0.4 17.7 2.0 20.1 0.4 40.2 0.8 41.4 - 4.4 - 4.4 - 6.0 0.8 6.8 0.8 17.3 - 18.1
S. tuberosum 0.3 22.4 0.6 23.3 0.3 34.0 - 34.3 - 4.4 - 4.4 - 6.1 0.3 6.4 - 20.1 - 20.1
O. sativa 0.5 14.9 0.3 15.7 0.7 53.9 0.1 54.7 0.0 6.0 0.1 6.1 0.3 9.3 0.1 9.7 0.1 10.3 0.0 10.4
S. bicolor 0.2 18.5 - 18.7 0.2 35.2 - 35.4 - 10.2 - 10.2 - 14.6 - 14.6 0.2 18.1 - 18.3
T. aestevum 0.5 26.5 0.4 27.3 0.5 34.0 0.5 35.0 0.2 13.3 0.1 13.7 0.1 11.3 0.6 12.1 - 7.6 0.1 7.7
Z. mays 0.5 16.0 0.5 17.0 0.2 34.5 - 34.6 0.1 10.7 0.4 11.2 0.1 16.2 0.2 16.4 0.1 17.4 - 17.5
S. officinarum - 18.7 - 18.7 - 36.4 - 36.4 - 8.4 - 8.4 - 14.5 - 14.5 - 16.9 - 16.9
H. vulgare 0.5 14.6 0.2 15.4 0.7 35.1 0.3 36.1 0.4 15.7 0.3 16.5 0.2 13.8 0.1 14.2 0.1 12.8 - 13.0
Average 1.7 19.4 0.8 21.9 1.7 37.8 0.7 40.2 0.2 7.8 0.2 8.2 0.3 9.7 0.4 10.4 0.2 13.5 0.1 13.8
Heptamer Octamer Nonamer Decamer General
Minissatélites 5’UTR CDS 3’UTR Total 5’UTR CDS 3’UTR Total 5’UTR CDS 3’UTR Total 5’UTR CDS 3’UTR Total 5’UTR CDS 3’UTR Total
A. thaliana 1.0 0.9 0.8 2.8 0.6 0.3 0.3 1.2 0.1 1.0 - 1.1 0.1 0.2 0.1 0.3 34.0 52.5 13.5 100.0
B. napus - 3.8 - 3.8 - 0.5 - 0.5 - 0.6 - 0.6 - 0.2 - 0.2 0.2 99.5 0.3 100.0
S. lycopersicum 0.8 8.4 - 9.2 - - - 2.4 94.0 3.6 100.0
S. tuberosum 0.6 9.0 0.3 9.9 - 0.6 - 0.6 - 1.2 - 1.2 - - - - 1.2 97.7 1.2 100.0
O. sativa 0.1 2.0 0.0 2.1 0.0 0.2 - 0.2 - 0.7 - 0.7 - 0.3 - 0.3 1.7 97.6 0.6 100.0
S. bicolor - 2.4 - 2.4 - - - 0.4 - 0.4 - - - - 0.6 99.4 - 100.0
T. aestevum - 3.5 - 3.5 - 0.2 - 0.2 - 0.4 - 0.4 - 0.1 - 0.1 1.3 97.0 1.7 100.0
Z. mays 0.1 3.0 - 3.1 - - - 0.2 - 0.2 - - - - 1.0 98.0 1.1 100.0
S. officinarum - 4.2 - 4.2 - - - 0.6 - 0.6 - 0.3 - 0.3 - 100.0 - 100.0
H. vulgare 0.1 3.6 - 3.7 - 0.2 - 0.2 - 1.0 - 1.0 - - - - 2.1 96.9 1.0 100.0
in the Brassicaceae (0.8%), when compared to the Sola-naceae (0.3%) and Poaceae (0.1%). Nonamers were also more frequent in the Brassicaceae (0.9%), when compared to the Solanaceae (0.6%) and Poaceae (0.5%). Decamers were comparatively less frequent than other mini-satellites, reaching frequencies of 0.2%, 0.1% and zero in the Brassi-caceae, Poaceae and Solanaceae, respectively (Table 3).
There are several studies proclaiming EST sequences containing microsatellites. For the Poaceae (rice, maize, sorghum, barley and wheat), frequencies ranging from 16.6 to 40% for dimers, 41 to 78% for trimers, 2.6 to 14% for tetramers, 0.4 to 18.9% for pentamers and below 1% for hexamers (Varshneyet al.,2002; Thielet al., 2003; La Rota
et al., 2005; Paridaet al., 2006) have been reported. In the case ofArabidopsis, frequencies of dimers (36.5%), trimers (62.1%), tetramers (1.1%), pentamers (0.15%) and hexamers (0.13%) have been noted (Paridaet al., 2006).
Most frequent motifs
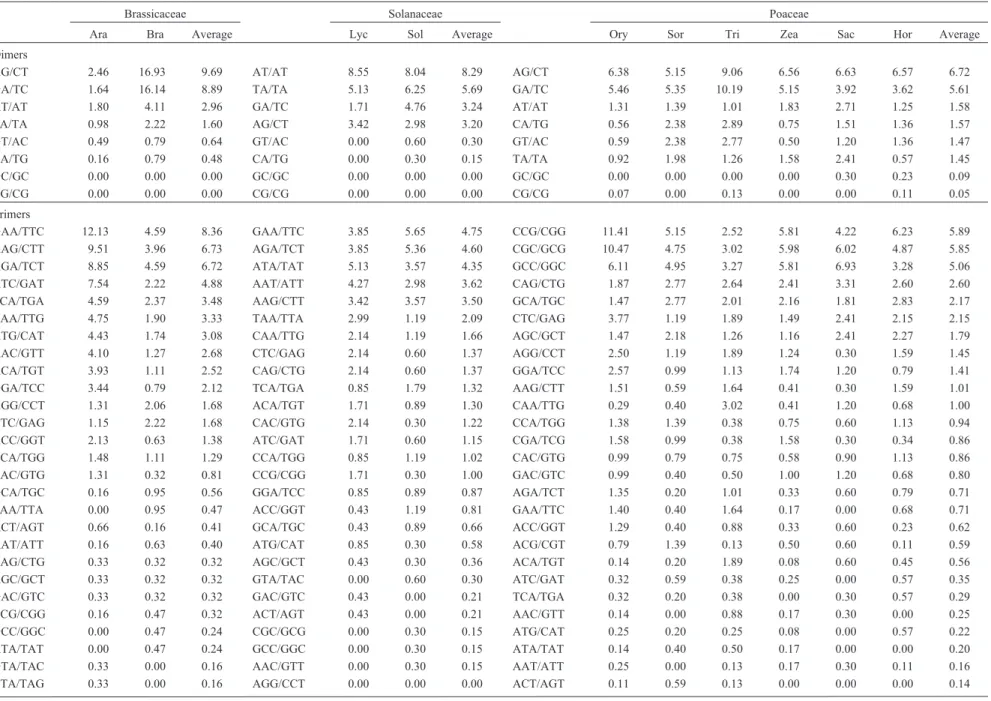
Dimers and trimers
Motif frequencies per species and average frequency per family are listed in Tables 4 and 5. For dimers, differ-ences were observed within and between families. As re-gards the Brassicaceae, AG/CT and GA/TC dimer motifs were the most frequent, reaching 9.69% and 8.89% of ob-servations within the family. A 6.9-fold difference was the case for AG/CT between Arabidopsis (2.46%) and B. napus(16.93%). Moreover, as to the GA/TC motif, an al-most 10-fold difference was found between Arabidopsis
(1.64%) andB. napus(16.14%). Other reports have shown that AG/GA motifs were the most frequent inArabidopsis
(Cardleet al., 2000; Morgante et al., 2002; Lawson and Zhang, 2006; Paridaet al., 2006) and AT/TA in B. rapa
(Honget al., 2007). Among the Solanaceae, AT/AT and TA/TA motifs were the most frequent, with frequencies of 8.29% and 5.69%, respectively. In Solanaceae ESTs, fre-quencies between 20%-25% and 15%-20% were found for AG and AT dimers, respectively (Kumptla and Mukho-padhyay, 2005). In the Poaceae, the most frequent motifs were AG/CT and GA/TC, with average percentages of 6.72% and 5.61%, respectively. In still other studies, fre-quencies ranging from 38%-50% were the rule for the AG motif in maize, barley, rice, sorghum and wheat (Kantetyet al., 2002; Morgante et al., 2002; Varshneyet al., 2002; Thielet al., 2003; Yuet al., 2004; La Rotaet al., 2005) and frequencies of 50% for the AC motif in barley (Varshneyet al., 2002). GA has also been shown to be the most abundant motif in grasses (Temnykh et al., 2001; Kantety et al., 2002; Nicotet al., 2004; Paridaet al., 2006). In all the spe-cies that were analyzed in the present study, the lowest fre-quencies were found for those motifs formed by guanine and cytosine (CG/GC), which were even absent in Bras-sicaceae and Solanaceae species.
As was the case for dimers, in trimer frequencies mo-tif patterns are different within as well as between families
(Table 4). Among the Brassicaceae, GAA/TTC and AAG/CTT motifs were the most abundant, reaching fre-quencies of 8.36% and 6.73%, respectively. Contrasting values were verified for GAA/TTC betweenArabidopsis
(12.13%) and B. napus (4.59%), also the case for AAG/CTT between Arabidopsis (9.51%) and B. napus
(3.96%). Some reports have claimed that AAG is the most frequent for Arabidopsis and B. rapa (Morgante et al., 2002; Honget al., 2007). In the Solanaceae,GAA/TCC and AGA/TCT were the most frequent, with values of 4.75% and 4.60%, respectively. For both, frequency values were higher inS. tuberosum. Similar results were obtained in
Arabidopsis, B. napus, B.rapa, S. Lycopersicum and S. tuberosum(Kumptla and Mukhopadhyay, 2005), as well as inCitrus(Jianget al., 2006) where AAG/AGA/GAA mo-tifs were the most frequent. In the Poaceae, the trimers CCG/CGG, CGC/GCG and GCC/GGC were the most fre-quent, corresponding to 5.89%, 5.85% and 5.06%, respec-tively, a total of 16.80% of all the microsatellites found. Within the family, different motifs were the most common,
i.e., forO. sativa, S. bicolorandH. vulgare, CCG/CGG were predominant, for T. aestivum and S. officinarum
GCC/GGC and forZ. maysCGC/GCG. Other studies have shown a predominance of CCG in the grass species Z. mays, H. vulgare, O. sativa, S. bicolor, T. aestivum, S. cerealeandS. officinarum(Cordeiroet al., 2001; Kantety
et al., 2002; Morganteet al., 2002; Varshneyet al., 2002; Thielet al., 2003; Nicotet al., 2004; Yuet al., 2004; La Rotaet al., 2005; Peng and Lapitan,2005). These motifs (CCG/CGG, CGC/GCG and GCC/GGC) seem to be less common in other families, where instead of values of around 16.8% (found for grasses), frequency was 0.56% in Brassicaceae and 0.36% in the Solanaceae.
Tetramers, pentamers and hexamers
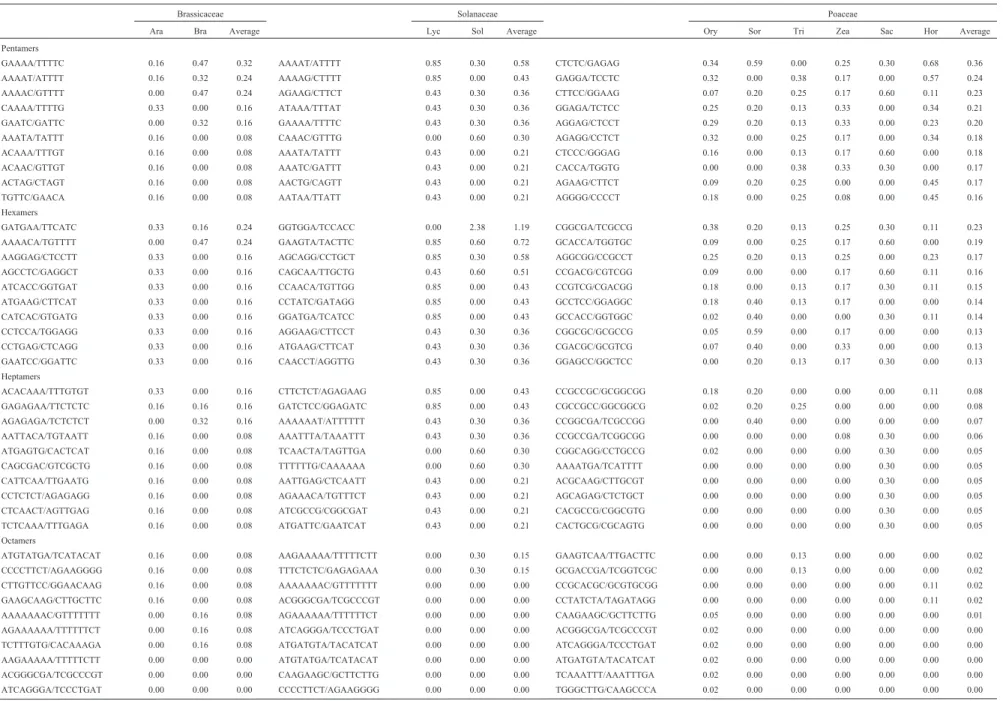
For the loci formed by motifs longer than three nu-cleotides, only the ten highest average percentages for each family are shown (Tables 4 and 5).
In Brassicaceae, tetramer motifs occurring at higher frequencies were AAGA/TCTT, AAAC/GTTT or GAAA/TTTC adding to 1.04% of all motifs found. Other reports indicate that motifs AAAG/AAAT were predomi-nant inArabidopsisand AAAT inB. rapa (Cardleet al., 2000; Hong et al., 2007). For 5’UTR/CDS and 3’UTR
Arabidopsisregions, the predominant motifs reported were AAAG/CTTT and AAAC/GTTT, respectively (Morgante
828
Gene
transcripts
in
three
plant
families
Table 4- Distribution of di-, tri- and tetramer motifs, percentage occurrence per species and average occurrence per family.
Brassicaceae Solanaceae Poaceae
Ara Bra Average Lyc Sol Average Ory Sor Tri Zea Sac Hor Average
Dimers
AG/CT 2.46 16.93 9.69 AT/AT 8.55 8.04 8.29 AG/CT 6.38 5.15 9.06 6.56 6.63 6.57 6.72 GA/TC 1.64 16.14 8.89 TA/TA 5.13 6.25 5.69 GA/TC 5.46 5.35 10.19 5.15 3.92 3.62 5.61 AT/AT 1.80 4.11 2.96 GA/TC 1.71 4.76 3.24 AT/AT 1.31 1.39 1.01 1.83 2.71 1.25 1.58 TA/TA 0.98 2.22 1.60 AG/CT 3.42 2.98 3.20 CA/TG 0.56 2.38 2.89 0.75 1.51 1.36 1.57 GT/AC 0.49 0.79 0.64 GT/AC 0.00 0.60 0.30 GT/AC 0.59 2.38 2.77 0.50 1.20 1.36 1.47 CA/TG 0.16 0.79 0.48 CA/TG 0.00 0.30 0.15 TA/TA 0.92 1.98 1.26 1.58 2.41 0.57 1.45 GC/GC 0.00 0.00 0.00 GC/GC 0.00 0.00 0.00 GC/GC 0.00 0.00 0.00 0.00 0.30 0.23 0.09 CG/CG 0.00 0.00 0.00 CG/CG 0.00 0.00 0.00 CG/CG 0.07 0.00 0.13 0.00 0.00 0.11 0.05 Trimers
al., 2002; Thiel et al., 2003), AAAG/CTTT and AAGG/CCTT in perennial ryegrass (Aspet al.2007) and AAAG as the most frequent motif in rice BACs (McCouch
et al., 2002).
For pentamers, 0.80% (GAAAA/TTTTC, AAAAT/ ATTTT and AAAAC/GTTTT), 1.37% (AAAAT/ATTTT, AAAAG/CTTTT and AGAAG/CTTCT) and 0.83% (CTCTC/GAGAG, GAGGA/TCCTC and CTTCC/ GGAAG) were predominant in the Brassicaceae, Sola-naceae and Poaceae, respectively. The major difference among plant families is the predominance of A/T in the Brassicaceae and Solanaceae. Also, reports on CDS regions inArabidopsis, S. cerevisaeandC.elegans, indicated the predominance of ACCCG and AAAAG (Tothet al.2000). For eukaryotes in general, AAAAT, AAAAC and AAAAG are revealed as the most predominant (Liet al.,2004a). On the other hand, 5’UTR and 3’UTR regions ofArabidopsis
were shown to be rich in AAGAG and AAAAC, respec-tively (Zhanget al., 2004). AAAAT (Honget al., 2007) and AAAAT /AAAAG (Jianget al., 2006) were described as being frequently found in the Rosaceae and Citrus, respec-tively. In transcripts from the TIGR database, the AGAGG motif was predominant in rice, AGGGG in barley and ACGAT in wheat (La Rotaet al., 2005). Very little infor-mation was encountered on the preferential occurrence of pentamers in grasses, whereas that on eukaryotes (Tothet al., 2000; Li et al., 2004a),Citrus(Palmieriet al., 2007; Jiang etal., 2006),Arabidopsis(Zhang et al., 2004) and Rosaceae (Honget al., 2007) offered variable results.
Hexamer patterns occurred among and within the three analyzed plant families (Table 5). To date, the pre-dominance of AAGGAG hexamers in Arabidopsis, has been confirmed by only one other study (Tothet al., 2000). Other reports indicated the most encountered hexamers to be AAGATG, AAAGAG and AAAAAT in Arabidopsis
(Zhang et al., 2004), AAAAAG in Citrus (Jiang et al., 2006), AACACG inS. cerevisae,ACCAGG inC. elegans, AAGGCC in mammals and CCCCGG in primates (Tothet al., 2000). The ten major occurrences for heptamers, octa-mers, nonamers and decamers are presented in Table 5. Oc-currences are widely variable within and among families, making it difficult to establish either a pattern or discussion based on similarities.
Genome dynamics is very complex regarding micro-satellite motifs in plants. The higher conservation of dimer motifs (AG/TC and GA/TC) seems to overcome evolution-ary barriers distances such as those found between monocot and dicot plants. However, in the dicots, this conservation may not hold. Unexpectedly, Poaceae and Brassicaceae were closer when these motifs were analyzed. On the other hand, trimer microsatellites that are known to be predomi-nant in coding regions followed the expected conservation pattern, with similar rates and predominant motifs (GAA/TTC) between the two dicot families. Trimers pres-ent at higher frequencies in the grasses tend to be formed by
830
Gene
transcripts
in
three
plant
families
Table 5- Distribution of penta- to decamers motifs, percentage occurrence per species and average occurrence per family.
Brassicaceae Solanaceae Poaceae
Ara Bra Average Lyc Sol Average Ory Sor Tri Zea Sac Hor Average
Pentamers
GAAAA/TTTTC 0.16 0.47 0.32 AAAAT/ATTTT 0.85 0.30 0.58 CTCTC/GAGAG 0.34 0.59 0.00 0.25 0.30 0.68 0.36
AAAAT/ATTTT 0.16 0.32 0.24 AAAAG/CTTTT 0.85 0.00 0.43 GAGGA/TCCTC 0.32 0.00 0.38 0.17 0.00 0.57 0.24
AAAAC/GTTTT 0.00 0.47 0.24 AGAAG/CTTCT 0.43 0.30 0.36 CTTCC/GGAAG 0.07 0.20 0.25 0.17 0.60 0.11 0.23
CAAAA/TTTTG 0.33 0.00 0.16 ATAAA/TTTAT 0.43 0.30 0.36 GGAGA/TCTCC 0.25 0.20 0.13 0.33 0.00 0.34 0.21
GAATC/GATTC 0.00 0.32 0.16 GAAAA/TTTTC 0.43 0.30 0.36 AGGAG/CTCCT 0.29 0.20 0.13 0.33 0.00 0.23 0.20
AAATA/TATTT 0.16 0.00 0.08 CAAAC/GTTTG 0.00 0.60 0.30 AGAGG/CCTCT 0.32 0.00 0.25 0.17 0.00 0.34 0.18
ACAAA/TTTGT 0.16 0.00 0.08 AAATA/TATTT 0.43 0.00 0.21 CTCCC/GGGAG 0.16 0.00 0.13 0.17 0.60 0.00 0.18
ACAAC/GTTGT 0.16 0.00 0.08 AAATC/GATTT 0.43 0.00 0.21 CACCA/TGGTG 0.00 0.00 0.38 0.33 0.30 0.00 0.17
ACTAG/CTAGT 0.16 0.00 0.08 AACTG/CAGTT 0.43 0.00 0.21 AGAAG/CTTCT 0.09 0.20 0.25 0.00 0.00 0.45 0.17
TGTTC/GAACA 0.16 0.00 0.08 AATAA/TTATT 0.43 0.00 0.21 AGGGG/CCCCT 0.18 0.00 0.25 0.08 0.00 0.45 0.16
Hexamers
GATGAA/TTCATC 0.33 0.16 0.24 GGTGGA/TCCACC 0.00 2.38 1.19 CGGCGA/TCGCCG 0.38 0.20 0.13 0.25 0.30 0.11 0.23
AAAACA/TGTTTT 0.00 0.47 0.24 GAAGTA/TACTTC 0.85 0.60 0.72 GCACCA/TGGTGC 0.09 0.00 0.25 0.17 0.60 0.00 0.19
AAGGAG/CTCCTT 0.33 0.00 0.16 AGCAGG/CCTGCT 0.85 0.30 0.58 AGGCGG/CCGCCT 0.25 0.20 0.13 0.25 0.00 0.23 0.17
AGCCTC/GAGGCT 0.33 0.00 0.16 CAGCAA/TTGCTG 0.43 0.60 0.51 CCGACG/CGTCGG 0.09 0.00 0.00 0.17 0.60 0.11 0.16
ATCACC/GGTGAT 0.33 0.00 0.16 CCAACA/TGTTGG 0.85 0.00 0.43 CCGTCG/CGACGG 0.18 0.00 0.13 0.17 0.30 0.11 0.15
ATGAAG/CTTCAT 0.33 0.00 0.16 CCTATC/GATAGG 0.85 0.00 0.43 GCCTCC/GGAGGC 0.18 0.40 0.13 0.17 0.00 0.00 0.14
CATCAC/GTGATG 0.33 0.00 0.16 GGATGA/TCATCC 0.85 0.00 0.43 GCCACC/GGTGGC 0.02 0.40 0.00 0.00 0.30 0.11 0.14
CCTCCA/TGGAGG 0.33 0.00 0.16 AGGAAG/CTTCCT 0.43 0.30 0.36 CGGCGC/GCGCCG 0.05 0.59 0.00 0.17 0.00 0.00 0.13
CCTGAG/CTCAGG 0.33 0.00 0.16 ATGAAG/CTTCAT 0.43 0.30 0.36 CGACGC/GCGTCG 0.07 0.40 0.00 0.33 0.00 0.00 0.13
GAATCC/GGATTC 0.33 0.00 0.16 CAACCT/AGGTTG 0.43 0.30 0.36 GGAGCC/GGCTCC 0.00 0.20 0.13 0.17 0.30 0.00 0.13
Heptamers
ACACAAA/TTTGTGT 0.33 0.00 0.16 CTTCTCT/AGAGAAG 0.85 0.00 0.43 CCGCCGC/GCGGCGG 0.18 0.20 0.00 0.00 0.00 0.11 0.08
GAGAGAA/TTCTCTC 0.16 0.16 0.16 GATCTCC/GGAGATC 0.85 0.00 0.43 CGCCGCC/GGCGGCG 0.02 0.20 0.25 0.00 0.00 0.00 0.08
AGAGAGA/TCTCTCT 0.00 0.32 0.16 AAAAAAT/ATTTTTT 0.43 0.30 0.36 CCGGCGA/TCGCCGG 0.00 0.40 0.00 0.00 0.00 0.00 0.07
AATTACA/TGTAATT 0.16 0.00 0.08 AAATTTA/TAAATTT 0.43 0.30 0.36 CCGCCGA/TCGGCGG 0.00 0.00 0.00 0.08 0.30 0.00 0.06
ATGAGTG/CACTCAT 0.16 0.00 0.08 TCAACTA/TAGTTGA 0.00 0.60 0.30 CGGCAGG/CCTGCCG 0.02 0.00 0.00 0.00 0.30 0.00 0.05
CAGCGAC/GTCGCTG 0.16 0.00 0.08 TTTTTTG/CAAAAAA 0.00 0.60 0.30 AAAATGA/TCATTTT 0.00 0.00 0.00 0.00 0.30 0.00 0.05
CATTCAA/TTGAATG 0.16 0.00 0.08 AATTGAG/CTCAATT 0.43 0.00 0.21 ACGCAAG/CTTGCGT 0.00 0.00 0.00 0.00 0.30 0.00 0.05
CCTCTCT/AGAGAGG 0.16 0.00 0.08 AGAAACA/TGTTTCT 0.43 0.00 0.21 AGCAGAG/CTCTGCT 0.00 0.00 0.00 0.00 0.30 0.00 0.05
CTCAACT/AGTTGAG 0.16 0.00 0.08 ATCGCCG/CGGCGAT 0.43 0.00 0.21 CACGCCG/CGGCGTG 0.00 0.00 0.00 0.00 0.30 0.00 0.05
TCTCAAA/TTTGAGA 0.16 0.00 0.08 ATGATTC/GAATCAT 0.43 0.00 0.21 CACTGCG/CGCAGTG 0.00 0.00 0.00 0.00 0.30 0.00 0.05
Octamers
ATGTATGA/TCATACAT 0.16 0.00 0.08 AAGAAAAA/TTTTTCTT 0.00 0.30 0.15 GAAGTCAA/TTGACTTC 0.00 0.00 0.13 0.00 0.00 0.00 0.02
CCCCTTCT/AGAAGGGG 0.16 0.00 0.08 TTTCTCTC/GAGAGAAA 0.00 0.30 0.15 GCGACCGA/TCGGTCGC 0.00 0.00 0.13 0.00 0.00 0.00 0.02
CTTGTTCC/GGAACAAG 0.16 0.00 0.08 AAAAAAAC/GTTTTTTT 0.00 0.00 0.00 CCGCACGC/GCGTGCGG 0.00 0.00 0.00 0.00 0.00 0.11 0.02
GAAGCAAG/CTTGCTTC 0.16 0.00 0.08 ACGGGCGA/TCGCCCGT 0.00 0.00 0.00 CCTATCTA/TAGATAGG 0.00 0.00 0.00 0.00 0.00 0.11 0.02
AAAAAAAC/GTTTTTTT 0.00 0.16 0.08 AGAAAAAA/TTTTTTCT 0.00 0.00 0.00 CAAGAAGC/GCTTCTTG 0.05 0.00 0.00 0.00 0.00 0.00 0.01
AGAAAAAA/TTTTTTCT 0.00 0.16 0.08 ATCAGGGA/TCCCTGAT 0.00 0.00 0.00 ACGGGCGA/TCGCCCGT 0.02 0.00 0.00 0.00 0.00 0.00 0.00
TCTTTGTG/CACAAAGA 0.00 0.16 0.08 ATGATGTA/TACATCAT 0.00 0.00 0.00 ATCAGGGA/TCCCTGAT 0.02 0.00 0.00 0.00 0.00 0.00 0.00
AAGAAAAA/TTTTTCTT 0.00 0.00 0.00 ATGTATGA/TCATACAT 0.00 0.00 0.00 ATGATGTA/TACATCAT 0.02 0.00 0.00 0.00 0.00 0.00 0.00
ACGGGCGA/TCGCCCGT 0.00 0.00 0.00 CAAGAAGC/GCTTCTTG 0.00 0.00 0.00 TCAAATTT/AAATTTGA 0.02 0.00 0.00 0.00 0.00 0.00 0.00
G/C arrangements, in contrast to dicot plants where G/A/T/C combinations are more frequent. The higher fre-quency of A/T- rich repeats is also found in pentamer mo-tifs in the dicot families. Repeats of higher complexity did not reveal detectable conserved patterns in this study.
Conclusions
The occurrence of micro and minisatellites in rice se-quences (11.28%) is higher than in other species, ranging from 2.5 to 5 times more sequences containing these repeti-tive DNA loci. The fact that species having larger genomes (T. aestivum,H. vulgareandS. officinarum) do not present a correspondingly higher frequency of repetitive loci im-plies there is no relationship between genome size and rates of tandem repeat occurrence in functional regions. How-ever, the lower coverage of sequences present in databases for these species could also be a reason for the low rates found in some species. ForArabidopsisand rice, the results obtained are closer to reality, since both are considered model species and have been intensely studied.
The distribution of micro- and minisatellites was higher in CDS regions for all the studied species. Also, microsatellites (97%) were more common than mini-satellites (3%). Per family, the predominant dimer motifs were the same for Brassicaceae and Poaceae (AG/CT) and different for the Solanaceae (AT/AT). Trimers were the predominant repeats, ranging between 34.3% and 58.0%, with different rates depending on the family or species. For the Solanaceae, the predominant trimer motifs were not the same forS. lycopersicum(ATA/TAT and AAT/TTA) and
S. tuberosum(GAA/TTC and AGA/TCT). This could be due to selection. Among the grasses, trimers formed by C/G were the most abundant. Nevertheless, specific motifs were variable between species.
Disagreements between earlier reports and the results obtained in the present work, where dimers were also fre-quent in CDS regions, could be due to the fact that the Unigene database contains predominantly EST clusters. Therefore, there is a tendency for under-representing the UTR regions in the annotated sequences. This is true for all species, exceptArabidopsis.This could be solved by manu-ally curating the genes, thereby defining the different re-gions. Achievement, however, would require a community effort.
The obtained results shed light on the patterns of tan-dem repeat occurrence within and between different plant families, thereby facilitating the use of plant-breeding strat-egies based on the transfer of markers from model to or-phan species.
Acknowledgments
The authors thank CNPq for fellowships and grants, as well as Dr. Dario Abel Palmieri (UNESP/Assis-SP) and
Dr. Olivier Panaud (University of Perpignan) for fruitful discussions.
References
Asp T, Frei UK, Didion T, Nielsen KK and Lübberstedt T (2007) Frequency, type, and distribution of EST-SSRs from three genotypes ofLolium perenne, and their conservation across orthologous sequences of Festuca arundinacea,
Brachypodium distachyon, andOryza sativa. BMC Plant
Biol 7:36.
Bell GI (1996) Evolution of simple sequence repeats. Comput Chem 20:41-48.
Cardle L, Ramsay L, Milbourne D, Macaulay M, Marshall D and Waugh R (2000) Computational and experimental charac-terization of physically clustered simple sequence repeats in plants. Genetics 156:847-854.
Conne B, Stutz A and Vassalli JD (2000) The 3’ untranslated re-gion of messenger RNA: A molecular `hotspot’ for pathol-ogy? Nat Med 6:637-641.
Cordeiro GM, Casu R, McIntyre CL, Manners JM and Henry RJ (2001) Microsatellite markers from sugarcane (Saccharum spp.) ESTs cross transferable to erianthus and sorghum. Plant Sci 160:1115-1123.
Davis BM, McCurrach ME, Taneja KL, Singer RH and Housman DE (1997) Expansion of a CUG trinucleotide repeat in the 3’untranslated region of myotonic dystrophy protein kinase transcripts results in nuclear retention of transcripts. Proc Natl Acad Sci USA 94:7388-7393.
Hong CP, Piao ZY, Kang TW, Batley J, Yang TJ, Hur YK, Bhak J, Park BS, Edwards D and Lim YP (2007) Genomic distribu-tion of simple sequence repeats in Brassica rapa. Mol Cells 23:349-356.
Iyer RR, Pluciennik A, Rosche WA, Sinden RR and Wells RD (2000) DNA polymerase III proofreading mutants enhance the expansion and deletion of triplet repeat sequences in
Escherichia coli. J Biol Chem 275:2174-2184.
Jiang D, Zhong GY and Hong QB (2006) Analysis of micro-satellites in citrus unigenes. Acta Genetica Sinica 33:345-353.
Jung S, Abbott A, Jesudurai C, Tomkins J and Main D (2005) Fre-quency, type, distribution and annotation of simple sequence repeats in Rosaceae ESTs. Funct Integr Genomics 5:136-143.
Kantety RV, La Rota M, Matthews DE and Sorrells ME (2002) Data mining for simple sequence repeats in expressed se-quence tags from barley, maize, rice, sorghum and wheat. Plant Mol Biol 48:501-510.
Kashi Y and King DG (2006) Simple sequence repeats as advanta-geous mutators in evolution. Trends Genet 22:253-259. Kumpatla SP and Mukhopadhyay S (2005) Mining and survey of
simple sequence repeats in expressed sequence tags of dico-tyledonous species. Genome 48:985-998.
La Rota M, Kantety RV, Yu JK and Sorrells ME (2005) Non-random distribution and frequencies of genomic and EST-derived microsatellite markers in rice, wheat, and barley. BMC Genomics 6:23.
Lawson MJ and Zhang L (2006) Distinct patterns of SSR distribu-tion in theArabidopsis thalianaand rice genomes. Genome Biol 7:R14.
Li B, Xia Q, Lu C, Zhou Z and Xiang Z (2004b) Analysis on fre-quency and density of microsatellites in coding sequences of several eukaryotic genomes. Genom Proteom Bioinf 2:24-31. Li YC, Korol AB, Fahima T, Beiles A and Nevo E (2002)
Micro-satellites: Genomic distribution, putative functions and mutational mechanisms: A review. Mol Ecol 11:2453-2465. Li YC, Korol AB, Fahima T and Nevo E (2004a) Microsatellites
within genes: Structure, function, and evolution. Mol Biol Evol 21:991-1007.
Maia LC da, Palmieri DA, de Souza VQ, Kopp MM, de Carvalho FI and Costa de Oliveira A (2008) SSR Locator: Tool for simple sequence repeat discovery integrated with primer design and PCR simulation. Int J Plant Genomics 412696.
McCouch SR, Teytelman L, Xu Y, Lobos KB, Clare K, Walton M, Fu B, Maghirang R, Li Z, Xing Y,et al.(2002) Develop-ment and mapping of 2240 new SSR markers for rice (Oryza
sativaL.) DNA Res 9:199-207.
Morgante M and Olivieri AM (1993) PCR-amplified micro-satellites as markers in plant genetics. Plant J 3:175-182. Morgante M, Hanafey M and Powell W (2002) Microsatellites are
preferentially associated with nonrepetitive DNA in plant genomes. Nat Genet 30:194-200.
Nicot N, Chiquet V, Gandon B, Amilhat L, Legeai F, Leroy P, Bernard M and Sourdille P (2004) Study of simple sequence repeat (SSR) markers from wheat expressed sequence tags (ESTs). Theor Appl Genet 109:800-805.
Palmieri DA, Novelli VM, Bastianel M, Cristofani M, Monge GA, Carlos EF, Oliveira AC and Machado MA (2007) Fre-quency and distribution of microsatellites from ESTs of cit-rus. Genet Mol Biol 30:1009-1018.
Parida SK, Anand Raj Kumar K, Dalal V, Singh NK and Moha-patra T (2006) Unigene derived microsatellite markers for the cereal genomes. Theor Appl Genet 112:808-817. Peng JH and Lapitan NL (2005) Characterization of EST-derived
microsatellites in the wheat genome and development of eSSR markers. Funct Integr Genomics 5:80-96.
Philips AV, Timchenko LT and Cooper TA (1998) Disruption of splicing regulated by a CUG-binding protein in yotonic dys-trophy. Science 280:737-741.
Subramanian S, Mishra RK and Singh L (2003) Genome-wide analysis of microsatellite repeats in humans: Their abun-dance and density in specific genomic regions. Genome Biol 4:R13.
Temnykh S, DeClerck G, Lukashova A, Lipovich L, Cartinhour S and McCouch S (2001) Computational and experimental analysis of microsatellites in rice (Oryza sativaL.): Fre-quency, length variation, transposon associations, and ge-netic marker potential. Genome Res 11:1441-1452. Thiel T, Michalek W, Varshney W and Graner A (2003)
Ex-ploiting EST databases for the development and character-ization of gene-derived SSR-markers in barley (Hordeum
vulgareL.). Theor Appl Genet 106:411-422.
Thornton CA, Wymer JP, Simmons Z, McClain C and Moxley RT (1997) Expansion of the myotonic dystrophy CTG repeat
duces expression of the flanking DMAHP gene. Nat Genet 16:407-409.
Tóth G, Gáspári Z and Jurka J (2000) Microsatellites in different eukaryotic genomes: Survey and analysis. Genome Res 10:967-981.
Varshney RK, Graner A and Sorrells ME (2005) Genic micro-satellite markers in plants: Features and applications. Trends Biotechnol 23:48-55.
Varshney RK, Thiel T, Stein N, Langridge P and Graner A (2002)
In silicoanalysis on frequency and distribution of
micro-satellites in ESTs of some cereal species. Cell Mol Biol Lett 7:537-546.
Varshney RK, Hoisington DA and Tyagi AK (2006) Advances in cereal genomics and applications in crop breeding. Trends Biotechnol 24:490-499.
Yu JK, Dake TM, Singh S, Benscher D, Li W, Gill B and Sorrells ME (2004) Development and mapping of EST-derived
sim-ple sequence repeat markers for hexaploid wheat. Genome 47:805-818.
Zhang L, Yuan D, Yu S, Li Z, Cao Y, Miao Z, Qian H and Tang K (2004) Preference of simple sequence repeats in coding and non coding regions ofArabidopsis thaliana. Bioinformatics 20:1081-1086.
Zhang L, Zuo K, Zhang F, Cao Y, Wang J, Zhang Y, Sun X and Tang K (2006a) Conservation of noncoding microsatellites in plants: Implication for gene regulation. BMC Genomics 7:323.
Zhang L, Yu S, Cao Y, Wang J, Zuo K, Qin J and Tang K (2006b) Distributional gradient of amino acid repeats in plant pro-teins. Genome 49:900-905.
Associate Editor: Márcio de Castro Silva Filho