Epistasis and genotype-by-environment interaction of grain protein
content in durum wheat
Fethi Bnejdi and Mohamed El Gazzah
Laboratoire de Génétique et Biométrie, Département de Biologie, Faculté des Sciences de Tunis,
Université Tunis El Manar, Tunisia.
Abstract
Parental, F1, F2, BC1and BC2generations of four crosses involving four cultivars of durum wheat (Triticum durum
Desf.) were evaluated at two sites in Tunisia. A three-parameter model was found inadequate for all cases except crosses Chili x Cocorit 71 at site Sidi Thabet and Inrat 69 x Karim at both sites. In most cases a digenic epistatic model was sufficient to explain variation in generation means. Dominance effects (h) and additive x additive epistasis (i) (when significant) were more important than additive (d) effects and other epistatic components. Considering the genotype-by-environment interaction, the non-interactive model (m, d, h, e) was found adequate. Additive variance was higher than environmental variance in three crosses at both sites. The estimated values of narrow-sense heritability were dependent upon the cross and the sites and were 0%-85%. The results indicate that appropriate choice of environment and selection in later generations would increase grain protein content in durum wheat.
Key words:epistasis, genotype x environment interaction, heritability, grain protein, wheat.
Received: March 10, 2009; Accepted: October 14, 2009.
Introduction
Durum wheat (Triticum durumDesf.) is the most im-portant cereal crop in Tunisia and North Africa, and is used primarily for couscous, macaroni and various types of bread (Troccoliet al., 2000). In addition, wheat of high grain protein content usually commands a premium price. The grain protein content of durum wheat is an important trait for the nutritional value of grain and the technological properties of flour (Blancoet al., 2006). The unpredictabil-ity of the Mediterranean climate causes fluctuations in wheat yield and quality, but offers the opportunity for ob-taining high-quality durum wheat in terms of grain protein content (Rharrabtiet al., 2001). The higher-yielding culti-vars of Tunisia tend to have low grain protein, whereas the lower-yielding cultivars tend to have high grain protein. This inverse relationship between wheat yields and grain protein content is well known (Termanet al., 1969; Entz and Fowler, 1989; Pleijelet al., 1999). Genetic differences and environmental effects on grain protein content have been reported previously (Kramer, 1979; Baenzigeret al., 1985). A range of heritabilities for grain protein content have been found in bread wheat: 47%-83% (Ekiz et al., 1998); 39%-61% (Guthrieet al., 1984); 30%-76% with a mean of 44% (Duffieldet al., 1972). Many data indicate
that in wheat the grain protein content is heritable and de-termined either by several genes (Johnsonet al., 1968) or by one or two genes (Haunold et al., 1962; Cowley and Wells, 1980). Milletet al.(1992) concluded that grain pro-tein content was largely determined by the maternal parent. The estimation of epistatic components of genotypic vari-ance and genotype x environment interaction is unusual in genetic studies, as epistasis was considered to make only a small contribution to quantitative variation (Crow, 1987). However, recent studies indicate the contribution of epis-tatic effects and genotype x environment interaction to grain protein content in barley (Kaczmareket al., 2002). In this study, a generation mean analysis methodology (Ma-ther and Jinks, 1982) was used to estimate the inheritance of protein content in durum wheat.This method allows deter-mining whether the protein content traits fit an additive-dominance model and estimating the additive, additive-dominance, and epistatic gene effects, as well as the environmental ef-fects and the genotype x environment interaction (Mather and Jinks, 1982).
Materials and Methods
The study was carried out under rain-fed conditions at two locations in Tunisia (Mogran and Sidi Thabet), during the years 2005-2006. Sowing was done at the beginning of December. The Mogran area is characterized by loam soil and a sub-humid climate with an annual rainfall of about 700 mm. The Sidi Tahbet area is also characterized by loam Send correspondence to Fethi Bnejdi. Laboratoire de Génétique et
Biométrie, Département de Biologie, Faculté des Sciences de Tu-nis, Université Tunis El Manar, 2092 Tunisia. E-mail: [email protected].
soil and a humid climate with an annual rainfall of about 400 mm. Parental cultivars were selected for their differ-ences in grain protein content. Plants were grown in a ran-domised complete block design with two replications, with a between-row spacing of 20 cm and a within-row spacing of 10 cm. Harvest was done per plant, and the numbers of plants evaluated varied depending on the generation: in generations with greater segregation, such as F2, BC1and
BC2, a greater number of plants were evaluated. The grain
protein content was assessed by Near-Infrared Reflectance Spectroscopy of grain flour of each individual plant, using an Inframatic 8600 flour analyser. Transforming the data by log, square root, arc-sine, and arc-sine of square root had no effect on data distribution or in removing epistatic ef-fects. Analyses of variance by population and location us-ing SAS software version 6 (SAS Institute, 1990) indicated that the replication and generation x replication effects were not significant. Therefore, the generation mean analy-ses were made without adjusting the data for replication.
Calculated means and variances were used to esti-mate the mid-parent (m), additive (d), and dominance (h) gene effects, as described by Rowe and Alexander (1980) following the method of Mather and Jinks (1982) for a three-parameter model. Adequacy of the additive-domi-nance model was determined by the chi-square (X2) test with three degrees of freedom and was accepted if p > 0.05 (non-significant X2 value). When the three-parameter model was inadequate (significantX2value), the interaction terms [additive x additive (i), additive x dominance (j), and dominance x dominance (l)] were computed (Mather and Jinks, 1982). The genetic parameters [m, (d), (h), (i), (j),
and (l)] were tested for significance using an unpaired
t-test. Adequacy of the best fit model was determined by the
X2test with three degrees of freedom and was accepted if p > 0.05 (non-significant X2 value). The weighted least squares method was also used to estimate environmental and genotype x environment interactions. This method was applied to parents and F1only (Mather and Jinks, 1982).
Heritability
The homogeneity of variances of non-segregating generations was tested using Bartlett’s test (Bartlett, 1937). When the variances were heterogeneous, the environmen-tal variance (VE) was replaced by an adequate number of
separate parameters and pooled to produce a single envi-ronmental variance. Additive, dominance, additive x domi-nance and environmental variance components were estimated using the maximum likelihood method with the observed variance of the six basic generations used as the initial weights (df /2*S2) until the X2test value reached a minimum (Lynch and Walsh, 1998).
Narrow-sense heritability (h2n) was calculated as
fol-lows: h2n= V*A/V*A+ V*D+ VE, where V*Ais the additive
genetic component of variance, V*Dthe dominance genetic
component of variance, and VEthe environmental variance
(Kearsey and Pooni, 1996).
Results
The mean values and variances for the analysed traits of the four crosses at the two sites are presented in Table 1. In all cases, depending on the site, the means of the parents
Table 1- Plant means±SE for grain protein (%) in parental and offspring populations from four crosses at two sites (Mogran and Sidi Thabet), with two replications.
Population Chili x Cocorit 71 Inrat 69 x Karim Inrat 69 x Cocorit 71 Chili x Karim
Sidi Thabet
P1 16.60±1.24a (20)y 15.04
±2.78a (20) 15.04±2.78ab (20) 16.60±1.24a (20) BC1P1 15.33±2.74a (50) 14.30±2.73a (50) 14.76±3.54b (48) 15.92±1.89a (47)
F1 16.58±1.13a (19) 14.57±2.26a (26) 16.50±2.48a (22) 17.00±1.53a (19)
F2 11.22±2.81b (96) 13.66±3.23ab (98) 11.31±3.02c (94) 13.73±2.31b (97)
BC1P2 11.07±1.68b (53) 12.32±2.76bc (50) 11.05±2.88c (48) 13.43±2.52b (46)
P2 11.40±1.98b (20) 11.45±2.39c (20) 11.40±1.98c (20) 11.45±2.39c (20)
Mogran
P1 12.60±1.99a (20) 11.80±2.15a (20) 11.80±2.15a (20) 12.60±1.99a (20)
BC1P1 12.13±3.57ab (52) 11.26±3.21a (50) 11.31±3.30ab (48) 12.22±2.37a (37)
F1 12.47±3.28a (19) 10.46±3.02ab (26) 12.72±2.18a (22) 12.40±1.70a (23)
F2 10.86±3.72ab (88) 10.19±3.57ab (78) 9.55±3.16c (84) 10.44±2.47ab (98)
BC1P2 10.46±2.77b (43) 10.52±2.99ab (50) 9.92±3.32bc (48) 11.62±1.74c (46)
P2 8.25±2.29c (20) 9.10±2.26b (20) 8.25±2.29c (20) 9.10±2.26b (20)
in each cross showed a tendency to be more extreme. The backcrosses BC1P1and BC1P2had means that tended to be
close to those of their respective recurrent parents. These results confirmed the choice of parents for the present study. The F1 means exceeded the superior parents for
crosses Inrat 69 x Cocorit 71 and Chili x Karim at the Sidi Thabet site and for Inrat 69 x Cocorit 71 at Mogran. In the majority of cases, the F2mean was higher than the P2mean
and lower than the F1mean.
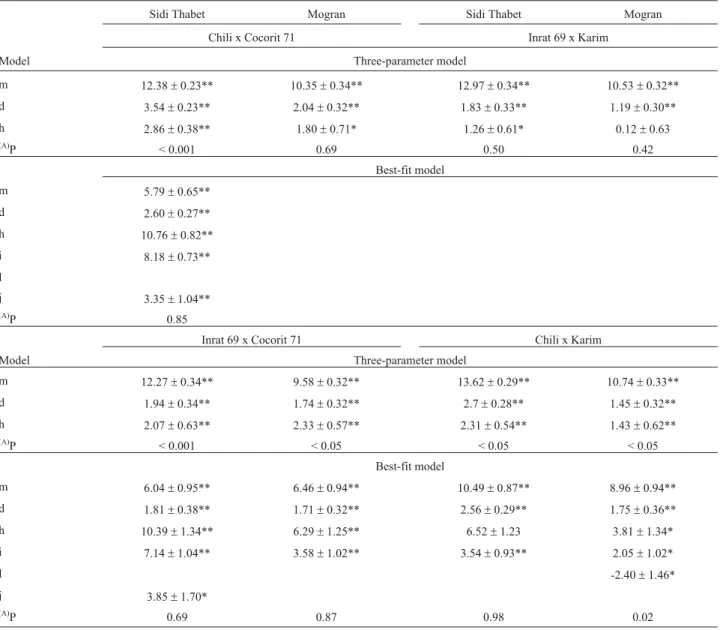
The results of the three-parameter model and the best-fit model are listed in Table 2. The joint scaling test re-vealed that the additive-dominance model was adequate in three cases; in other cases it was inadequate (p < 0.001). The failure of the model may be due to the influence of
in-teraction or linkage among genes governing the inheritance of this trait. Therefore, the digenic epistatic model was ap-plied and was found adequate; this adequateness ranged from 2 to 98%. Additive (d) and dominance (h) effects were significant in the majority of crosses. For the crosses Chili x Cocorit 71 at Mogran, and Inrat 69 x Karim at both Mogran and Sidi Thabet, protein content was adequately explained by an additive-dominance model, with the additive effect being more important than the dominance effect. For all other cases a digenic epistatic model was adequate. The ad-ditive effect was significant and positive in all crosses at the two sites. The dominance effect was not significant only for crosses Inrat 69 x Karim at Mogran and Chili x Karim at Sidi Thabet. For the digenic epistatic effect, the additive x
Table 2- Estimates of gene effects±SE for grain protein content in four crosses (Chili x Cocorit 71, Inrat 69 x Karim, Inrat 69 x Cocorit 71, and Chili x Karim) at two sites (Mogran and Sidi Thabet), with two replications.
Sidi Thabet Mogran Sidi Thabet Mogran
Chili x Cocorit 71 Inrat 69 x Karim
Model Three-parameter model
m 12.38±0.23** 10.35±0.34** 12.97±0.34** 10.53±0.32**
d 3.54±0.23** 2.04±0.32** 1.83±0.33** 1.19±0.30**
h 2.86±0.38** 1.80±0.71* 1.26±0.61* 0.12±0.63
(A)
P < 0.001 0.69 0.50 0.42
Best-fit model
m 5.79±0.65**
d 2.60±0.27**
h 10.76±0.82**
i 8.18±0.73**
l
j 3.35±1.04**
(A)
P 0.85
Inrat 69 x Cocorit 71 Chili x Karim
Model Three-parameter model
m 12.27±0.34** 9.58±0.32** 13.62±0.29** 10.74±0.33**
d 1.94±0.34** 1.74±0.32** 2.7±0.28** 1.45±0.32**
h 2.07±0.63** 2.33±0.57** 2.31±0.54** 1.43±0.62**
(A)P < 0.001 < 0.05 < 0.05 < 0.05
Best-fit model
m 6.04±0.95** 6.46±0.94** 10.49±0.87** 8.96±0.94**
d 1.81±0.38** 1.71±0.32** 2.56±0.29** 1.75±0.36**
h 10.39±1.34** 6.29±1.25** 6.52±1.23 3.81±1.34*
i 7.14±1.04** 3.58±1.02** 3.54±0.93** 2.05±1.02*
l -2.40±1.46*
j 3.85±1.70*
(A)P 0.69 0.87 0.98 0.02
Mean (m), additive (d), dominance (h), additive x additive (i), dominance x dominance (l), additive x dominance (j) genetic effects. *, **, indicate that means and gene effects are statistically different from zero at p < 0.05, 0.01, respectively.
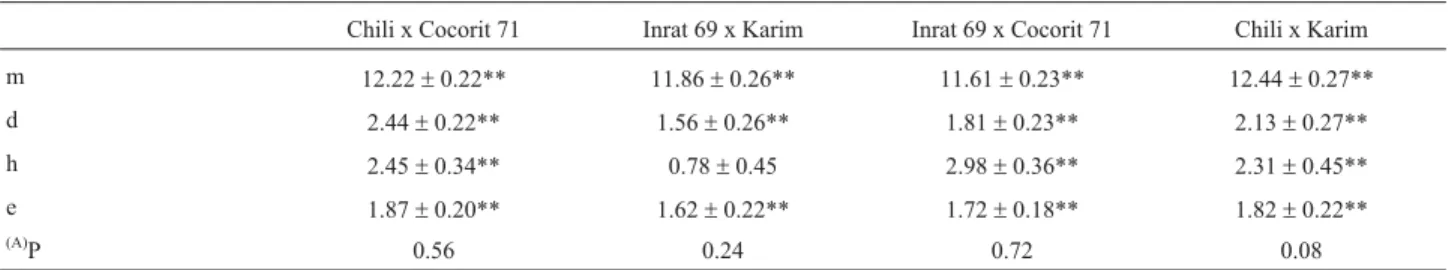
additive (i) effect was significant in the majority of cases; the dominance x dominance (l) effect was significant in one case, and the additive x dominance (j) effect was significant in two cases. Generation mean analysis of the non-segregating generations in the present study showed that the estimates of environment x dominance and of envi-ronment x additive effects were not significantly different from zero in all crosses, and the four-parameter models were fitted (Table 3).
The estimates of the components additive variance, dominance variance, environmental variance and h2n are
presented in Table 4. For the cross Chili x Cocorit 71, envi-ronmental variance was higher at Mogran, additive vari-ances were more pronounced than all other components, and their values were 8.84-9.28. Dominance variances were negative and not significant. The values of h2nvaried,
depending on the testing site, ranging from 64%-85%. For the Inrat 69 x Karim cross, the environmental variances
were similar at both sites. Additive variances were more pronounced at Mogran, with a range of 5.86-6.43. At both sites, h2nwas similar, with a range of 50%-53%. For Inrat
69 x Cocorit 71, the environmental variance range was 7.07-8.3. Additive variances were negative. Therefore, h2n
was not estimated. For the cross Chili x Karim, the environ-mental variance was 2.00-3.83. Additive variances were more pronounced at Mogran, with a range of 2.6-4.45. Heritability was similar between the sites, ranging from 48%-53%.
Discussion
In all four populations, the means of the parents (P1
and P2) had a tendency to be more extreme and contrasting
than the means of the F1and F2generations. The
backcross-es BC1P1and BC1P2had means that tended to be similar to
those of their respective recurrent parents. These results confirmed that the choices of parents for the present study
Table 3- Estimates of the genetic, environmental and genotype x environment interaction components (±SE) of generation means.
Chili x Cocorit 71 Inrat 69 x Karim Inrat 69 x Cocorit 71 Chili x Karim
m 12.22±0.22** 11.86±0.26** 11.61±0.23** 12.44±0.27**
d 2.44±0.22** 1.56±0.26** 1.81±0.23** 2.13±0.27**
h 2.45±0.34** 0.78±0.45 2.98±0.36** 2.31±0.45**
e 1.87±0.20** 1.62±0.22** 1.72±0.18** 1.82±0.22**
(A)P 0.56 0.24 0.72 0.08
Mean (m), additive (d), dominance (h) genetic effects; (e) environmental effect.
*, **, indicate that means and gene effects are statistically different from zero at p < 0.05, 0.01, respectively. (A) = Probability of adequateness of model.
Table 4- Estimates of variance components±SE and narrow-sense heritability (h2n) in four crosses at two sites (Mogran and Sidi Thabet), with two repli-cations.
VE VA VD X2(3df) h2n
Chili x Cocorit 71
Sidi Thabet 1.55±0.30** 8.84±2.91** -2.46±1.73 s 0.85
Mogran 5.08±1.04** 9.28±5.50* -0.48±3.79 ns 0.64
Inrat 69 x Karim
Sidi Thabet 5.79±1.01** 5.86±4.19 -1.16±2.97 ns 0.50
Mogran 5.52±0.96** 6.43±5.13 0.79±3.60 ns 0.53
Inrat 69 x Cocorit 71
Sidi Thabet 7.07±0.91** -3.56±4.88 4.02±3.89 ns 0A
Mogran 8.3±0.11** -3.86±5.35 -48.35±4.26 ns 0A
Chili x Karim
Sidi Thabet 2.00±0.42** 2.6±3.02 0.74±2.18 ns 0.48
Mogran 3.83±0.81** 4.45±3.28 -2.15±2.34 ns 0.53
df = degrees of freedom, calculated as the number of generations minus the number of estimated variance parameters. ns = non-significant, s = significant.
were contrasting, which is a prerequisite for generation means analysis, as proposed by Mather and Jinks (1982). Generation means analysis has been used to study the in-heritance of other complex traits in wheat, such as resis-tance to yellowberry (Bnejdi and El Gazzah, 2008), carbon isotope discrimination (Rebetzkeet al., 2006), spike length (Sharmaet al., 2003), plant height, number of heads per plant, number of grains per spike and grain yield per plant (Novoselovicet al., 2004).
Depending on the cross and experimental site, in most cases the variation in the generation means fitted a digenic epistatic model. This finding indicated that improvement of grain protein content would be moderately difficult com-pared to a situation in which an additive-dominance model is a better fit, and more favourable than for a tri-genic epistatic effect. The results agree with those of Kraljevic-Balalicet al.(1982), who found that, for grain protein con-tent in bread wheat, most of the variation was due to addi-tive and non-addiaddi-tive genetic variation. Similar results were reported by Ketataet al.(1976) and Joshiet al.(2004) inTriticum aestivum. An additive effect only was reported by Chapman and McNeal (1970) and Zahidet al.(2007).
The results of the present study revealed the limita-tion of most quantitative genetic studies based on the as-sumption of negligible epistasis. Many cases of significant epistasis have been reported for this trait in barley (Kacz-mareket al., 2002) and bread wheat (Kraljevic-Balalicet al., 1982).
For the crosses Chili x Cocorit 71 at Sidi Thabet and Inrat 69 x Karim at Mogran and Sidi Thabet, the addi-tive-dominance models were adequate. This indicated that the mode of gene action was site-dependent. The presence or absence of epistasis may depend upon the environment in which the plant material was evaluated and thus may not always be related to the inherent capacity of a genotype (Sunil and Singh, 2003). Kumaret al.(2003) reported that the genetic system governing grain protein content was highly additive. When an additive-dominance model was adequate, the magnitude of the additive (d) gene effect was greater than those of dominant (h) gene effects, indicating the major role of additive gene effects compared to domi-nance effects in controlling variation in grain protein con-tent. With respect to epistatic effects, additive x additive effects were significant in all cases when a di-genic model was applied. Dominant x dominant effects (l) were signifi-cant only for one case, and dominant x additive (j) effects only for two cases. This situation is more favourable than the presence of dominant x dominant and dominant x addi-tive effects in all cases. Epistasis of the addiaddi-tive x addiaddi-tive (i) type as observed in this experiment could be exploited in a breeding programme with the additive component, since it can be fixed by selection. Nevertheless, the additive x dominance (j) and dominance x dominance (l) types of in-teractions may not be an advantage in developing inbred varieties, as these are not fixable by selection.
Generation means analysis of genotype and genotype x environment interaction indicated that the non-interactive model was fitted. This situation is more favourable than the presence of environment x dominance and environment x additive effects.
Maximum likelihood estimates of environmental variance were higher at Mogran than at Sidi Thabet. The additive variance component was not consistent between crosses and sites and was higher for the cross Chili x Cocorit 71. The dominance variance component varied be-tween crosses and sites.
Our results showed h2nvalues which were moderate
to high, suggesting a large participation of the genetic ef-fects on phenotypic expression of grain protein content, and also that selection for the trait should be highly efficient. These results are similar to those reported by Ekizet al.
(1998) and Sharma and Sharma (2007). From a breeder’s point of view, the h2nestimates from the two sites show that
the Chili x Cocorit 71 cross has the greatest chance of ge-netic improvement. Selections in later generations with increased homozygosity, where additive and additive x ad-ditive variances are established, are recommended. For fur-ther increase in the grain protein content of durum wheat, it is suggested that an appropriate environment should be chosen, so that the character will show relatively simple in-heritance.
Acknowledgments
We thank Dr Colin Hanbury (Department of Agricul-ture and Food, Western Australia) for his helpful editorial comments and corrections of our manuscript.
References
Baenziger PS, Clements RL, McIntosh MS, Yamazaki WT, Star-ling TM, Sammons DJ and Johnson JW (1985) Effect of cultivar, environment, and their interaction and stability analyses on milling and baking quality of soft red winter wheat. Crop Sci 25:5-8.
Bartlett MS (1937) Some examples of statistical methods of re-search in agriculture and applied biology. J R Stat Soc (Suppl) 4:137-183.
Blanco A, Simeone R and Gadaleta A (2006) Detection of QTLs for grain protein content in durum wheat. Theor Appl Genet 112:1195-1204.
Bnejdi F and El Gazzah M (2008) Inheritance of resistance to yellowberry in durum wheat. Euphytica 163:225-230. Chapman SR and McNeal FH (1970) Gene effects for grain
pro-tein in five Spring Wheat crosses. Crop Sci 10:45-46. Cowley CR and Wells DG (1980) Inheritance of seed protein in
crosses involving `Hand’: A Hard Red Winter Wheat. Crop Sci 20:55-58.
Crow JF (1987) Population genetics history: A personal view. Annu Rev Genet 21:1-22.
Ekiz H, Kiral A, Akçin A and Simsek L (1998) Cytoplasmic ef-fects on quality traits of bread wheat (Triticum aestivumL.) Euphytica 100:189-196.
Entz MH and Fowler DB (1989) Response of winter wheat to N and water: Growth, water use, yield and grain protein. Can J Plant Sci 69:1135-1147.
Guthrie DA, Smith EL and McNew RW (1984) Selection for high and low grain protein in six Winter Wheat crosses. Crop Sci 24:1097-1100.
Haunold A, Johnson VA and Schmidt JW (1962) Genetic mea-surement of protein in the grain ofTriticum aestivumL. Agr J 54:203-206.
Johnson VA, Whited DA, Mattern PJ and Schmidt JW (1968) Nu-tritional improvement of wheat by breeding. In: Finaly KW and Shepard KW (eds) Proc 3rdIn Wheat Genet Symp. Ple-num Press, New York, pp 457-461.
Joshi SK, Sharma SN, Singhania DL and Sain RS (2004) Com-bining ability in the F1 and F2 generations of diallel cross in hexaploid wheat (Triticum aestivumL. em. Thell.) Hereditas 141:115-121.
Kaczmarek Z, Surma M, Adamski T, Jezowski S, Madajewski R, Krystkowiak K and Kuczynska A (2002) Interaction of gene effects with environments for malting quality of barley dou-bled haploids. Theor Appl Genet 43:33-42.
Kearsey MJ and Pooni HS (1996) The Genetical Analysis of Quantitative Traits. Chapman and Hall, London, 381 pp. Ketata H, Smith EL, Edwards LH and McNew RW (1976)
Detec-tion of epistatic, additive, and dominance variaDetec-tion in Win-ter Wheat (Triticum aestivumL. em Thell.). Crop Sci 16:1-4. Kraljevic-Balalic M, Stajner D and Gasic O (1982) Inheritance of
grain proteins in wheat. Euphytica 63:121-124.
Kramer TH (1979) Environmental and genetic variation for pro-tein content in winter wheat (Triticum aestivum L). Euphytica 28:209-218.
Kumar A, Thakur KS, Sethi GS and Bhandari JC (2003) Com-bining ability analysis for grain yield and some other mor-pho-physiological traits in winter x spring wheat hybrids. Crop Res 26:334-338.
Lynch M and Walsh B (1998) Genetics and Analysis of Quantita-tive Traits. Sinauer Associates, Inc, Sunderland, 980 pp. Mather K and Jinks JL (1982) Biometrical Genetics. 3rd edition.
Chapman and Hall, London, 396 pp.
Millet E, Zaccai M and Feldman M (1992) Paternal and maternal effects on grain weight and protein percentages in crosses between hexaploid and tetraploid high protein and low-protein wheat genotypes. Genome 35:257-260.
Novoselovic D, Marijana B, Drezner G, Gunjaca J and Lalic A (2004) Quantitative inheritance of some wheat plant traits. Genet Mol Biol 27:92-98.
Pleijel H, Mortensen L, Fuhrer J, Ojanpera K and Danielsson H (1999) Grain protein accumulation in relation to grain yield of spring wheat (Triticum aestivumL.) grown in open-top chambers with different concentrations of ozone, carbon di-oxide and water availability. Agric Ecosyst Environ 72:265-270.
Rebetzke GJ, Richards RA, Condon AG and Farquhar GD (2006) Inheritance of carbon isotope discrimination in bread wheat (Triticum aestivumL.). Euphytica 150:97-106.
Rharrabti Y, Villegas D, García del Moral LF, Aparicio N, Elhani S and Royo C (2001) Environmental and genetic determina-tion of protein content and grain yield in durum wheat under Mediterranean conditions. Plant Breed 120:381-388. Rowe KE and Alexander WL (1980) Computations for estimating
the genetic parameters in joint-scaling tests. Crop Sci 20:109-110.
SAS Institute (1990) SAS/STAT user’s guide, v. 6. 4thedition. SAS Institute, Cary.
Schnell FW and Cockerham CC (1992) Multiplicativevs. arbi-trary gene action in heterosis. Genetics 131:461-469. Sharma S and Sharma NY (2007) Estimates of variation and
heritability of some quantitative and quality characters in
Triticum turgidum L. ssp.durum (Desf.) Acta Agr Hung 55:261-264.
Sharma SN, Sain RS and Sharma RK (2003) Genetics of spike length in durum wheat. Euphytica 130:155-161.
Sunil K and Singh D (2003) Detection and estimation of compo-nent of genetic variation for root characteristics, plant height and seed yield at various growth stages and environments in Indian mustard. Brassica 6:41-45.
Terman GL, Ramig RE, Dreier AF and Olson RA (1969) Yield-protein relationships in wheat grain, as affected by N and water. Agr J 61:755-759.
Troccoli A, Borelli GM, De Vita P, Fares C and Di Fonzo N (2000) Mini review: Durum wheat quality: A multidisci-plinary concept. J Cereal Sci 32:99-113.
Zahid A, Saif Ullah A, Ali AK and Muhammad J (2007) Genetic analysis of protein, lysine, gluten and flour yield in bread wheat (Triticum aestivumL.). Pakistan J Biol Sci 10:1990-1995.
Associate Editor: Márcio de Castro Silva Filho