American Journal of Engineering Research (AJER)
2015
American Journal of Engineering Research (AJER)
e-ISSN: 2320-0847 p-ISSN : 2320-0936
Volume-4, Issue-9, pp-148-152
www.ajer.org
Research Paper Open Access
w w w . a j e r . o r g
Page 148
The Effect of Packaging Materials on the Quality Attributes of
Crayfish During Cold Storage.
Ajala, A.S.,
1Abiola, T.A.
1 1Department of Food Science and Engineering, Ladoke Akintola University of Technology, P.M.B. 4000, Ogbomoso, Nigeria
ABSRACT:
This study evaluates the effects of packaging materials on the quality attributes of crayfish preserved in cold storage. This was done in order to ascertain the suitability of the different packaging materials on keeping the quality attributes of crayfish in cold storage. The “red claw” crayfish was harvested fresh, beheaded, washed, cleaned and packaged in different packaging materials of low-density polyethylene (LDPE), high-density polyethylene (HDPE), aluminum foil and plastic. The crayfish were stored for a period of eight weeks, and samples were taken for analysis every two weeks. The analyses carried out were proximate, mineral (calcium, iron and phosphorus) and microbial (yeast, mould, coliform and total viable counts).There were significant reductionchanges in the proximate, minerals and microbiological analysis in respect to the packaging materials and storage period.
Key-words
:
crayfish, packaging material, quality, cold storageI.
INTRODUCTION
Crayfish, crawfish or crawdad are freshwater crustaceans resembling small lobsters, to which they are probably closely related. (Hobbs, 1984). Crayfish are eaten in Europe, China, Africa, Australia, Canada, and the United States. Ninety-eight percent of the crayfish harvested in the United States come from Louisiana. Louisiana produces 90 percent of the crawfish in the world and consumes 70 percent locally. (Anderson, 2007). Food preservation is generally useful and important in ensuring food availability and stability supply all over the world, without these, there might be difficulties arising from food shortage, famine, and a huge downturn in the economy all over the world. To avoid these, food preservation processes must therefore be put in place to ensure adequate food supply, stability and availability. (Bentley and Amy, 2008).
w w w . a j e r . o r g
Page 149
II.
MATERIALS AND METHOD
(a) Preparation of the samples:
The fresh crayfish used in this project was obtained from Makoko River in Lagos state, Nigeria. After harvesting, it was immediately put into ice slurry and transported to Food Science and Engineering Department Laboratory, Ladoke Akintola University of Technology, Ogbomoso, Nigeria where it was processed. The process involved beheading and washing. 0.25kg of crayfish was then weighed into each packaging material of sizes (14.5x13.5cm), which included low-density polyethylene (LDPE) of 90 cm3/cm2s-1 water transmission rate, high-density polyethylene (HDPE) of 41 cm3/cm2s-1 water transmission rates, Polyvinl Chloride of 275 cm3/cm2s-1 water transmission rate and aluminum foil. They were then packaged and frozen at -160C for 8 weeks at Bol-Raib Investment Nigeria Limited Mega fish cold room, Ogbomoso, Oyo state. At interval of 0, 2, 4, 6 and 8 week; sample pack of crayfish of each packaging materials was removed for mineral, microbial and proximate analyses.
(b) Chemical analysis
Microbial, minerals and proximate analyses were carried out using the official methods of Association of Official Analytical Chemists (AOAC 2000).
(c) Statistical analysis
Data were analyzed using SPSS (version 9.0) package. Analysis of variance was carried out to know the significant effect of the packaging material on the samples. Significant (P<0.05) difference between means were identified using the least significant difference procedure.
III.
RESULT AND DISCUSSIONS:
(a) Proximate Analysis.
The results obtained from proximate analysis of crayfish stored with different packaging materials are as presented in Table 1. All the samples generally gained moisture in the first two weeks to equilibrate with the surrounding humidity in the freezer, except sample C and D which decreased in moisture content. This could be attributed to the observation of Sing and Heldman 2009 on freezing diagram of food, in which the post cooling enthalphy (which is a function of specific heat and moisture content) decreased for some freezing time. At this time, the moisture content seems decreased due to slight reduction in post cooling enthalphy. However as the weeks increased, all the samples gained a significant amount of moisture, this might be due to their ability to allow moisture transfer across their boundaries. In other word it could be accrued to the nature of the packaging material in which transfer of water and oxygen is possible as reported by (Potter and Hotchkiss, 2006). It is observed from the table that sample at 8th week recorded highest value of moisture which implies that the higher the storage time, the higher the moisture content of the frozen crayfish samples. This observation has been earlier asserted by other authors such as Ajala and Oyategbe (2013), Akintola and Bakare (2012), Joseph et al., (1998), Basavacumer et al., 1998
The protein content decreased generally as the storage days increased. However, sample C had the highest protein content present at the end of 8th week meaning the packaging material retained the protein content better and was significantly different from the other packaging materials, however sample B had the lowest protein content and was also significantly different from other samples. The major loss of protein in sample B was as a result of leakages of protein content from the packaging material. This is a similar finding to the work of Gong et al., (2010) in which there was reduction in protein content of red claw crayfish packaged with polyethylene stored at -200C.
The percentage range of the fat content is in agreement with work of Nahid and Fayza, (2009) with values of 2.45 %. However, the results showed that crayfish samples were generally low in fat contents as earlier reported by Chien et al., (2007). As the storage days increased, there were reductions in fat contents in all the samples.
Table 1: Results of proximate composition
Samples Fresh (0 Week) 2 Weeks 4 Weeks 6 Weeks 8 Weeks
Moisture contents (%)
A 72.37 a +0.69 74.17a +0.15 75.83a +0.15 77.70a +0.20 78.33a +0.15
w w w . a j e r . o r g
Page 150
D 72.37 a +0.69 69.87b +0.06 72.57b +0.30 74.53b +0.21 75.43b +0.15 Protein contents (%)
A 20.47 a +0.39 17.90c +0.10 18.27c +0.15 18.43c +0.11 18.47c +0.06 B 20.47 a +0.39 17.30d +0.17 17.53d +0.06 17.63d +0.06 17.77d +0.11 C 20.47 a +0.39 18.47a +0.15 18.90a +0.10 18.97a +0.06 19.03a +0.15 D 20.47 a +0.39 18.27b +0.06 18.50b +0.10 18.67b +0.06 18.77b +0.06
Fat contents (%)
A 3.87 a +0.14 1.27c +0.11 1.20b +0.10 1.27b +0.06 1.23c +0.05 B 3.87 a +0.14 1.27c +0.06 1.23b +0.06 1.27b +0.06 1.27c +0.06 C 3.87 a +0.14 1.53b +0.06 1.57a +0.06 1.60a +0.00 1.63b +0.06 D 3.87 a +0.14 1.67a +0.06 1.60a +0.10 1.67a +0.06 1.73a +0.11
Ash contents (%)
A 3.10 a +0.14 1.93c +0.06 1.83c +0.11 1.83c +0.05 1.80c +0.10 B 3.10 a +0.14 1.77d +0.12 1.70d +0.10 1.73d +0.06 1.83c +0.06 C 3.10 a +0.14 2.10a +0.10 1.97a +0.12 2.00a +0.10 2.17a +0.06 D 3.10 a +0.14 2.07b +0.06 1.87b +0.06 1.90b +0.00 1.97b +0.06
Fibre contents (%)
A 0.10 a +0.00 0.10a +0.00 0.10a +0.00 0.10a +0.00 0.10a +0.00 B 0.10 a +0.00 0.07b +0.06 0.10a +0.00 0.10a +0.00 0.10a +0.00 C 0.10 a +0.00 0.10a +0.00 0.10a +0.00 0.10a +0.00 0.10a +0.00 D 0.10 a +0.00 0.07b +0.06 0.07b +0.06 0.07b +0.06 0.03b +0.06
Carbohydrate contents (%)
A 0.10 a +0.00 0.17b +0.01 0.90d +0.00 0.57d +0.15 0.23a +0.04 B 0.10 a +0.00 0.13a +0.01 0.70c +0.20 0.40c +0.10 0.90c +0.10 C 0.10 a +0.00 0.13a +0.02 0.73b +0.16 0.33b +0.12 0.23a +0.05 D 0.10 a +0.00 0.17b +0.02 0.47a +0.11 0.13a +0.03 0.63b +0.15 Means with the same letter across the column are not significantly different,
Codes: A- Low-density polyethylene, B- High-density polyethylene, C- Aluminum foil, D- Plastic
However, samples C and D were able to retain fat content more than the other samples A and B, this is because perhap sample A and B allowed oxidation to take place than sample C and D; this is similar to the work of Kong et al., (2006). Samples C and D were able to form a good barrier against light and other factors which could cause oxidation.
The ash content decreased generally as storage time increased, this is an obvious reason of leakages of minerals as storage days increased. This observation is in line with the work of Ibrahim and El-Sherif (2008). The ash content was highest in sample C and least in sample A, and they were significantly different from each other. Sample C and D had higher ash contents than samples A and B; this might be because the packaging materials of A and B allowed more mineral loss sample C and D.
The results of fibre content show that crayfish is poor in fibre as its values range from 0.03- 0.1%. Virtually, the fibre content remained constant during the storage period which means the fibrous particles of the crayfish were greater than pore sizes of the packaging material hence the fibre were retained.
The carbohydrate results are as shown in Table 1. The least value of carbohydrate at the 8th week is found in sample A while the highest value is found in sample C. The samples are significant from each other. All the samples increased in values as storage days increased. The trend in increment in these values was as result of either increase or decrease in value of other parameters such as moisture, protein, fat, fibre and ash because carbohydrate is a percentage difference from addition of these parameters.
(b) Mineral analysis
w w w . a j e r . o r g
Page 151
Table 2: Results of mineral content variation during the storage
Samples Fresh (0 Week) 2 Weeks 4 Weeks 6 Weeks 8 Weeks Calcium (mg / 100 g wet sample)
A 215 +2.45 211.00c +3.00 211.00b +3.00 210.33b +1.53 207.00b +1.73 B 215 +2.45 213.67b +1.15 212.67b +1.15 211.87b +0.58 209.67b +0.58 C 215 +2.45 214.00a +3.61 214.67a +3.51 213.67a +3.21 211.33a +3.79 D 215 +2.45 215.33b +2.52 214.33a +2.52 213.33a +2.31 211.67a +3.06
Iron (mg / 100 g wet sample)
A 1.70 +0.00 1.70b +0.00 1.70b +0.00 1.70b +0.00 1.70b +0.00 B 1.70 +0.00 1.73b +0.06 1.73b +0.06 1.73b +0.06 1.73b +0.06 C 1.70 +0.00 1.77a +0.06 1.80a +0.00 1.80a +0.00 1.80a +0.00 D 1.70 +0.00 1.87a +0.06 1.87a +0.06 1.87a +0.06 1.87a +0.06
Phosphorus (mg / 100 g wet sample)
A 208.67a +2.31 208.33a +2.89 207.67 a +1.69 207.67a +2.52 207.67a +2.52 B 209.33a +3.06 209.00a +3.61 209.00a +3.61 207.67 +1.69 207.33a +5.03 C 208.67a +3.06 207.67 +1.69 207.33a +3.06 205.67a +4.16 204.00a +3.61 D 207.67 +1.69 199.67b +4.04 198.67b +7.57 197.33b +6.43 197.33b +6.43 Means with the same letter across the column are not significantly different,
Codes: A- Low-density polyethylene, B- High-density polyethylene, C- Aluminum foil, D- Plastic
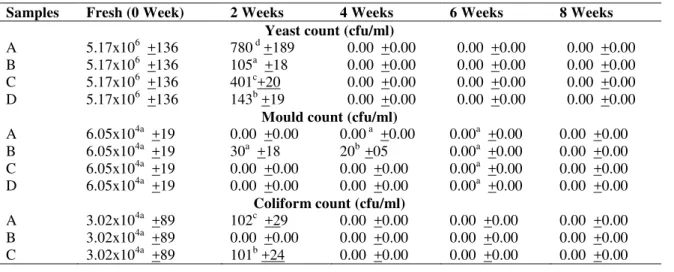
The results of the microbial analysis of the samples stored with different packaging materials are presented in Table 3. The values of mould and yeast count in this work are greater than the values reported by Emad et al., (2012) with value of 3.12x10² and 4.1 x10² respectively. Also the values of both coliform and total viable count in this work are greater than the values reported by the same author. The difference in values may be as a result of species variety and primarily aquatic habitat factor. From the table total viable count was initially high in all the samples but later there was a general trend in reduction of yeast, mold, coliform and total viable count as storage days increased. The obvious reason for this could be because of low storage temperature effect on these microorganisms. Most of these microbes are mesophile which cannot withstand cold temperatures irrespective of the packaging materials. Therefore, lower temperature served as a critical factor in inhibiting the growth of these microbes asreported by Chien et al., (2007), Potter and Hotchkiss, (2006).
IV. CONCLUSION
In summary, the fresh sample analyzed was quite better than the stored samples because finding shows a decrease in the quality attributes of the crayfish, these differences were however not pronounced to cause any devastating effect on the quality attributes of the crayfish. The results of the proximate, microbial and mineral analyses show that aluminum foil was better rated than other packaging material from microbiological standpoint. This implies that samples stored with aluminum foil formed effective barrier against chemical and biological changes on the crayfish than samples stored with the other packaging materials. However, aluminum foil is cost ineffective compare to others; hence the decision for packaging material for crayfish is left to individual crayfish processor
Table 3: Results of Microbial analysis during the storage
Samples Fresh (0 Week) 2 Weeks 4 Weeks 6 Weeks 8 Weeks Yeast count (cfu/ml)
A 5.17x10⁶ +136 780 d +189 0.00 +0.00 0.00 +0.00 0.00 +0.00 B 5.17x10⁶ +136 105a +18 0.00 +0.00 0.00 +0.00 0.00 +0.00 C 5.17x10⁶ +136 401c+20 0.00 +0.00 0.00 +0.00 0.00 +0.00 D 5.17x10⁶ +136 143b +19 0.00 +0.00 0.00 +0.00 0.00 +0.00
Mould count (cfu/ml)
A 6.05x10⁴a +19 0.00 +0.00 0.00 a +0.00 0.00a +0.00 0.00 +0.00 B 6.05x10⁴a +19 30a +18 20b +05 0.00a +0.00 0.00 +0.00 C 6.05x10⁴a +19 0.00 +0.00 0.00 +0.00 0.00a +0.00 0.00 +0.00 D 6.05x10⁴a +19 0.00 +0.00 0.00 +0.00 0.00a +0.00 0.00 +0.00
Coliform count (cfu/ml)
w w w . a j e r . o r g
Page 152
D 3.02x10⁴a +89 202a +69 102c +59 0.00 +0.00 0.00 +0.00
Total viable count (cfu/ml)
A 6.17x10⁶ +147 890a+85 0.00+0.00 0.00 +0.00 0.00 +0.00 B 6.17x10⁶ +147 150c+37 29+06 0.00 +0.00 0.00 +0.00 C 6.17x10⁶ +147 120d+23 0.00+0.00 0.00 +0.00 0.00 +0.00 D 6.17x10⁶ +147 350b+63 130+13 0.00 +0.00 0.00 +0.00 Means with the same letter across the column are not significantly different,
Codes: A- Low-density polyethylene, B- High-density polyethylene, C- Aluminum foil, D- Plastic
REFERENCES
[1] Ajala and Oyategbe (2013). Influence of Packaging and Storage on Nutritional Quality of White Shrimp (Penaeus vannamei), International Journal of Advanced Scientific and Technical Research. Issue 3 volume 2, pp 232-235
[2] Akintola, S.L. and Bakare, S.B. (2012). Effect of ice storage on the biochemical composition of Macrobachium vollenhovenii. Journal of Fishery and Aquatic Science, pp 1-5
[3] Anderson, O.E (2007) Refrigeration in America. Port Washington, N.Y Kennikat Press. Pg 203-208.
[4] AOAC (2000). ―Official Methods of Analysis (16th edn). Association of Official Analytical Chemists‖. Virginia, USA, pp. 834 -
841.
[5] Basavacumer, K.V., Bhaskar, N., Ramesh, A.M. and Reddy, G.S.V. (1998). Quality change in coloured tiger shrimps during ice storage. Journalof Food Science and Technology, 35:305-309
[6] Bently O and Amy F (2008). Eating for victory: Food rationing and the politics of Domesticity. Page 14-21.
[7] Cemal K.(2011). Effects of different phosphorus doses on the physico-chemical properties of strawberry during storage. Journal of Food, Agriculture & Environment Vol.9 (2): 106-109
[8] Chen, G., Xiong, Y.L., Kong, B., Newman, M.C., Thomson, K.R., Metts, L.S. and Webster, C.D. (2007). Microbiological and
physicochemical properties of red claw crayfish (Cherax quadricarinatus) stored in different package systems at 2◦C. Journal of
Food Science—Vol.72, No 8, pp 442-445
[9] Emad M. E., Seham A. K. and Mohammed, A. T. A. (2012). Chemical, physical, microbiological and quality attributes studies on River Nile crayfish. African Journal of Biotechnology Vol. 11(51), pp. 11262-11270.
[10] Gong YN, Li WW, Sun JL, Ren F, He L, Jiang H et al.(2010).Molecular cloning and tissue expression of the fatty acid-binding protein (Es-FABP) gene in female Chinese mitten
[11] crab (Eriocheir sinensis).BMC Molecular Biology 11: 71.
[12] Ibrahim, S. M. and El-Sherif, S. A. (2008) Effect of some plant extracts on the quality aspect of frozen Tilapia (Oreochromisniloticus L.) fillets. Global Vetrinaria 2:2:62-66
[13] Joseph, J., Jerrygreen, P.A. and Gopalakrishna, T.S. (1998). Storage characteristics of cultured Pennaeus indicus in ice and at ambient temperature. Fish Techn. 35: 84-89
[14] Nahid F.Z. and Fayza, E. (2009). Study on chemical Quality and Nutrition Value of Fresh Water Cray Fish (Procambarus clarkii). Journal of the Arabian Aquaculture Society, vol. 4, No 1, pp1-6
[15] Okonta, A. A. and Ekelemu, J. K. (2005), A preliminary study of micro-organisms associated with fish spoilage in Asaba, Southern Nigeria. Proceedings of the 20th Annual Conference of the Fisheries Society of Nigeria (FISON), Port Harcourt, Nigeria. pp557 – 560
[16] Potter H, Hotchkiss I (2006). Food Science. (5th ed.). CBS Publishers and Distributors. New Delhi, India
[17] Singh Paul R. and Heldman Dennis R.. (2009). Introduction of Food Engineering. 4th Edition: Academic Press, Incorporated. Chapter 7, Pp 503-507