Method optimization for proteomic analysis of soybean leaf:
Improvements in identification of new and low-abundance proteins
Rosilene Oliveira Mesquita
1, Eduardo de Almeida Soares
1, Everaldo Gonçalves de Barros
2and Marcelo Ehlers Loureiro
11
Departamento de Biologia Vegetal, Universidade Federal de Viçosa, Viçosa, MG, Brazil.
2
Departamento de Biologia Geral, Universidade Federal de Viçosa, Viçosa, MG, Brazil.
Abstract
The most critical step in any proteomic study is protein extraction and sample preparation. Better solubilization in-creases the separation and resolution of gels, allowing identification of a higher number of proteins and more accu-rate quantitation of differences in gene expression. Despite the existence of published results for the optimization of proteomic analyses of soybean seeds, no comparable data are available for proteomic studies of soybean leaf tis-sue. In this work we have tested the effects of modification of a TCA-acetone method on the resolution of 2-DE gels of leaves and roots of soybean. Better focusing was obtained when both mercaptoethanol and dithiothreitol were used in the extraction buffer simultaneously. Increasing the number of washes of TCA precipitated protein with acetone, using a final wash with 80% ethanol and using sonication to ressuspend the pellet increased the number of detected proteins as well the resolution of the 2-DE gels. Using this approach we have constructed a soybean protein map. The major group of identified proteins corresponded to genes of unknown function. The second and third most abun-dant groups of proteins were composed of photosynthesis and metabolism related genes. The resulting protocol im-proved protein solubility and gel resolution allowing the identification of 122 soybean leaf proteins, 72 of which were not detected in other published soybean leaf 2-DE gel datasets, including a transcription factor and several signaling proteins.
Key words:proteomics;Glycine max, 2-DE, protein extraction, leaf proteome.
Introduction
Two-dimensional polyacrylamide gel electrophoresis (2-DE) is the most widely used method for comparison of quantitative changes in the protein proles of cells, tissues or whole organisms (Herbertet al., 2001). 2-DE is capable of resolving hundreds, and in some cases thousands, of pro-teins in a single separation procedure.
One of the major limitations of 2-DE methods in proteomics is the fact that low-abundance proteins are rarely seen in traditional 2-D maps, whilst most proteinsin vivoare present at low abundance. These low-abundance proteins obviously perform very important roles and in-clude transcription factors, signal transduction proteins and receptors. This limitation of 2-DE methods could be due ei-ther to the presence of overwhelming quantities of abun-dant soluble proteins which obscure the detection of low-abundance proteins or to the fact that these low-low-abundance
proteins may not be completely solubilized prior to 2-DE. Efficient solubilization of protein samples is critical for high performance 2-D electrophoresis.
The most critical step in any proteomics study is pro-tein extraction and sample preparation (Roseet al., 2004). Protein extraction methods can vary widely in reprodu-cibility and representation of the total proteome. Better solubilization increases the separation and resolution of gels allowing identification of a higher number of proteins and more accurate quantification of differences in gene ex-pression. Plant tissues, when compared to animal tissues, often contain lower protein concentrations and extraction is often rendered difficult by the presence of interfering pounds, such as secondary metabolites, phenolic com-pounds, lipids, nucleic acids, the cell wall and storage polysaccharides. Some of these compounds may interact with proteins and give poor resolution and high background in 2-DE gels. Phenol extraction methods have been devel-oped to overcome some of these problems, but this method may reduce protein yield, is time consuming and requires the use of toxic phenol.
Several publications detailing soybean proteomics are available, with the majority of these publications
ad-Send correspondence to Marcelo Ehlers Loureiro. Laboratório Fi-siologia Molecular de Plantas, Departamento de Biologia Vegetal, Universidade Federal de Viçosa, Av. Peter Henry Rolfs s/n, Prédio do CCBII, 4° andar, sala 418, 36571-000 Viçosa, MG, Brazil. E-mail: mehlers@ufv.br.
dressing changes in the proteome of seeds, roots, nodules and hypocotyls (Mooneyet al., 2004; Hajduchet al., 2005; Wanet al., 2005; Natarajanet al., 2005, 2006; Djordjevicet al., 2007; Araiet al., 2008; Oehrleet al., 2008; Brechen-macheret al., 2009; Nanjo et al., 2010; Komatsu et al., 2010, 2011; Zhanget al., 2011). Some of these results are also contained in the Soybean Proteome Database (Sakata
et al., 2009). Proteomic analyses of soybean leaf, on the other hand, are scarce. In the Soybean Database, only one gel is available, which presents poor resolution and se-quencing of only 17 peptides (one peptide per spot) via Edman degradation. Krishnan and Natarajan (2009), using a phenol extraction method, have reported a fractionation technique using 10 mM Ca2+and 10 mM phytate to precipi-tate Rubisco from soybean leaf soluble protein extract, and identified only 52 proteins. Ahsanet al. (2010), using a TCA/acetone method, reported the identification of 54 teins in leaves under heat stress, the majority of these pro-teins being chaperones.
No published work exists where different methods are compared or optimized for analysis of the leaf proteome in soybean, and despite the great number of proteins ex-pressed in leaves, the results together do not allow identifi-cation of more than 100 proteins in this organ. Here we report an improved method for soybean leaf proteome anal-ysis and the identification of 122 leaf proteins, 72 of which, based on published articles and the soybean proteomics web site, have not previously been detected in leaves.
Material and Methods
The TCA/acetone protein extraction method was cho-sen for optimization (Shenet al., 2002). Around 0.2 g of in-soluble PVP (PVPP) was added to 1 g fresh weight of frozen leaves and this mixture was ground under liquid ni-trogen. Immediately before thawing, 2 mL of a modified extraction buffer was added (Tris-HCl 40 mM (pH 7.5) 250 mM sucrose, 10 mM EDTA, 1% Triton X-100, 1 mM PMSF; 1 mM DTT; 2% (v/v)b-mercaptoethanol) and ex-traction was performed for 2 h at 4 °C. Cellular debris was removed by centrifugation at 6,000 xgfor 15 min at 4 °C, and a second centrifugation of the supernatant was per-formed to completely remove any insoluble components. The precipitation of soluble proteins was performed by adding trichloroacetic acid (TCA) to a final concentration of 10% (w/v) in cold acetone for 16 h at -20 °C. The protein pellet was harvested by centrifugation at 6,000 x g for 15 min at 4 °C. The sediment was washed 4 times with cold acetone (10 mL each), and a final wash with ethanol 80% was carried out to remove the excess acetone and to im-prove the further steps of solubilization of the pellet. The pellet was dried by vacuum centrifugation at room temper-ature, and re-suspended in a modified 2-DE buffer (7 M urea, 2 M thiourea, 2% CHAPS, 100 mM DTT and 2% IPG buffer (pH 4-7, ampholytes)). Complete solubilization was
achieved by sonication with three pulses of 15 s at 1500 Hz. Protein concentration was determined by the Bradford method (Bradford, 1976), using BSA to construct a calibra-tion curve.
The first-dimension IEF was performed using 24 cm linear IPG strips (pH 4-7) in the IPGphor system (GE Healthcare). All IPG strips were rehydrated for 16 h with 250mL of rehydration buffer (8 M urea, 2% CHAPS, 0.5% ampholytes, 0.002% bromophenol blue) containing 1 mg of protein. Voltage settings for IEF were 250 V for 1 h, 500 V for 1 h, followed by a gradient from 1000-7000 V un-til achievement of a total of 5.2 kVh, followed by running at 8000 V to achieve 40 kVh. The focused strips were either electrophoresed runned immediately on a 2-D gel or stored at -80 °C until further use. For the 2-D gel electrophoresis, the gel strips were incubated with equilibration buffer 1 [50 mM Tris-HCl (pH 8.8), 6 M urea, 30% glycerol, 2% SDS, 0.002% bromophenol blue, 1% DTT] and equilibra-tion buffer 2 [50 mM Tris-HCl (pH 8.8), 6 M urea, 30% glycerol, 2% SDS, 0.002% bromophenol blue, 2.5% iodoacetamide] for 15 min each and subsequently placed onto 12.5% polyacrylamide gel (26 x 32 cm) with a Tris-glycine buffer system as described by Laemmli (1970). Strips were overlaid with agarose sealing solution (0.25 M Tris base, 1.92 M glycine, 1% SDS, 0.5% agarose, 0.002% bromophenol blue) using an Ettan Daltsix electrophoresis system (GE Healthcare). the initial 2D eletrophoresis set-ting was 5 W (constant and maximal 20 mA), followed by a separation run for 6 h using 12 W per gel (constant and maximal 50 mA). The 2D-PAGE gels were visualized by staining with colloidal Coomassie blue G-250 as described by Newsholmeet al.(2000). The gels were fixed overnight in 50% ethanol and 3% phosphoric acid and then washed three times for 30 min with distilled water. Gels were pre-stained for 1 h in 34% methanol, 17% ammonium sul-fate and 3% phosphoric acid and then stained for 2 days in the same solution containing Coomassie blue G-250 (0.066%). Image acquisition was done using an ImageScanner III (GE Healthcare) and images were ana-lyzed using ImageMaster 2D Platinum v. 7 software (GE Healthcare).
MALDI-TOF-MS analysis of tryptic peptides was performed using a Bruker UltraFlexIII spectrometer. Sam-ples were co-crystallized with CHCA matrix and spectra acquired with 40 shots of a 337 nm nitrogen laser operating at 20 Hz. Protein identification was done by searching the National Center for Biotechnology Information (NCBI) non-redundant database using the Mascot search engine and a probability-based scoring system (Perkins et al., 1999). The following parameters were used for database searches with MALDI-TOF peptide mass fingerprinting data: monoisotopic mass, 25 ppm mass accuracy, trypsin as digesting enzyme with one missed cleavage allowed, car-bamidomethylation of cysteine as a fixed modification, ox-idation of methionine, N-terminal pyroglutamic acid from glutamic acid or glutamine according to variable modifica-tions.
For database searches with MS/MS spectra, the fol-lowing parameters were used: average mass; 1.5 Da peptide and MS/MS mass tolerance; peptide charge of +1, +2 or +3; trypsin as digesting enzyme with 1 missed cleavage al-lowed; carbamidomethylation of cysteine as a fixed modi-fication; oxidation of methionine, N-terminal pyroglutamic acid from glutamic acid or glutamine according to variable modifications. For MALDI-TOF-MS data to qualify as a positive identification, a protein’s score had to equal or ex-ceed the minimum significant score (Perkinset al., 1999). Positive identification of proteins by MS/MS analysis re-quired a minimum of two unique peptides, with at least one peptide having a significant ion score.
Results and Discussion
To evaluate the effect of the modifications to the TCA/acetone method, protein extractions were carried out
using leaves and roots of soybean plants collected five weeks after germination. The phenol-base method (Wang
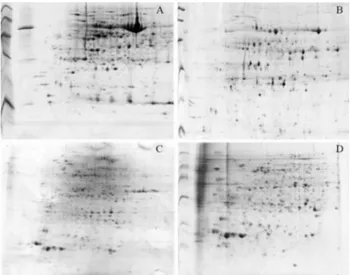
et al., 2003), the original TCA/acetone method and the modified TCA/acetone method described here were tested using three biological replicates (three different extracts for each method from three different plants). An example of the 2-DE gels using 1 mg protein extract is shown in Figu-re 1.
As evidenced in Figure 1 A and C, the phenol-based method resulted in a higher level of subunits of the enzyme ribulose 1,5 bisphosphate carboxylase oxygenase (Rubis-co). Furthermore, lower resolution was observed. This re-sult is important for attempts to help improve the detection of low-abundance proteins in 2-DE gels of leaf protein. In leaves, Rubisco represents around 50% and 30% of total protein in C3 and C4 plants respectively (Feller et al., 2008). This high abundance hinders proteomic assessment of low-abundance proteins (Xiet al., 2006) and masks the ability of neighboring proteins to be detected (Corthaliset al., 2000; Shaw and Riederer, 2003; Cho et al., 2008). It also significantly limits the dynamic resolution of the gel (Hermanet al., 2003). Krishnan and Natarajan (2009) de-scribed a method using a TCA/acetone extraction proce-dure together with a phytic acid treatment to deplete Rubisco in soybean leaf 2-DE gels. However, the number of proteins detected by these authors was in fact lower than that obtained when using the unmodified TCA/acetone method (511 spots versus 582 when using the phenol method). These results suggest that additional changes to the protocol, besides Rubisco depletion, are needed to in-crease the number of detectable proteins. In contrast to the situation with leaf tissue, the unmodified TCA/acetone method increases the number of spots detected in roots (634 spots using the phenol method versus 705). These differ-ences support the inference that different sample prepara-tion methods are required to produce optimal 2-DE results from different plant organs.
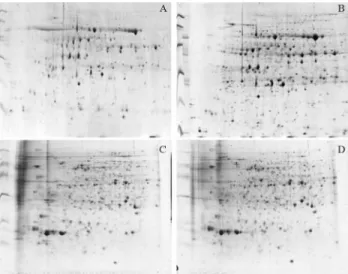
The effect of the modifications to the TCA/acetone method can be observed in Figure 2. A comparison between Figures 2A and 2B indicates that the modifications made to the TCA/acetone method improved both the solubilization of proteins and gel resolution, as indicated by the increase in spot number by 57% and 5.4% in leaf and root respec-tively (in leaves, 802 spots in modified method versus 511, and 743 to 705 in roots). No significant differences in the content of the large and small Rubisco subunits were ob-served with the modification of this method. These results ilustrate that significant increase in protein detection in 2D gels could be obtained by increase in solubilizatio besides no changes in Rubisco content. Particularly interesting is the increase in low molecular weight proteins in leaves re-sulting from the introduced modifications. These differ-ences were reproducible and seen in all three repetitions for each method (data not shown). Effects of the modified method on the root proteome were also observed (Figures
2C,D), although the improvement was not as clear as that observed for leaf tissue. In roots, the number of spots also increased with the modifications made to the method, but the problem of low resolution in the region of low PI/higher molecular weight still remained, despite the improvement in resolution for higher pI proteins and the fact that more proteins were detected overall.
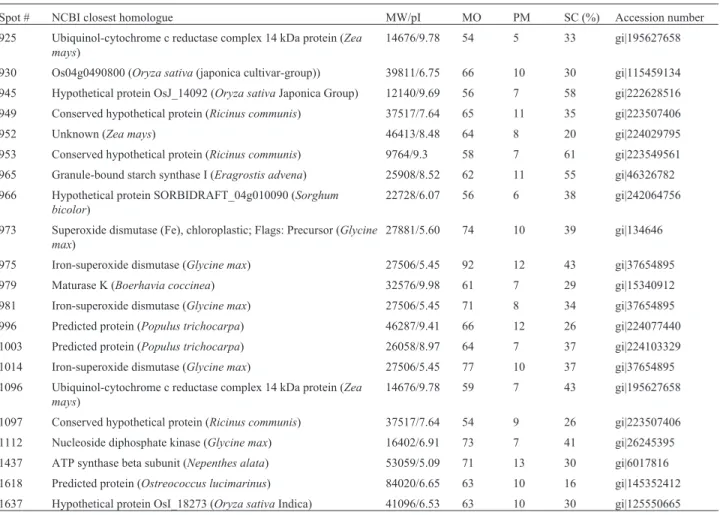
The improvements in the resolution of 2-DE gels for leaf tissue (Figure 3) were reflected by the successful iden-tification of 122 proteins, based on the peptides matched in the NCBI protein bank, as described in Table 1. Figure 3 also shows that proteins coding for the large subunit of Rubisco are separated into several spots around the 53 KDa region of the gels.
Although several additional proteins could poten-tially be identified, we used a Mowse score of 40 as a mini-mum confidence threshold for identification in this study. This score varied from 44 to 175 across identified proteins, with an average of 80 in this dataset (a score greater than
Figure 2- Effect of modification of the TCA/acetone method on the reso-lution of 2-DE gels. (A and C) - Gels using protein extracted and prepared using the original TCA/Acetone method. (B and D) - Gels using protein extracted and prepared using the TCA/Acetone method with modifica-tions. Extracts are from leaf (A and B) and root (C and D) tissue.
Table 1- Proteins identified in the soybean leaf proteome using the proposed extraction method, with the number as indicated in protein map in Figure 3. MW/pI: theoretical protein molecular weight and isoelectric point. MO: MOWSE score; PM: number of peptides with matches in the PMF; SC: sequence coverage.
Spot # NCBI closest homologue MW/pI MO PM SC (%) Accession number
29 Conserved hypothetical protein (Ricinus communis) 37517/7.64 70 11 31 gi|223507406
30 Heat shock protein 70 (Cucumis sativus) 75480/5.15 164 16 25 gi|1143427
31 Heat shock protein, putative (Ricinus communis) 75431/5.35 131 23 30 gi|223534226
32 Endoplasmic reticulum HSC70-cognate binding protein precursor (Glycine max)
73822/5.15 92 14 21 gi|2642238
33 Calmodulin-2 (Glycine max) 16878/4.11 39 4 30 calm2_soybn
35 Endoplasmic reticulum HSC70-cognate binding protein precursor (Glycine max)
73822/5.15 88 15 23 gi|218199537
36 Conserved hypothetical protein (Ricinus communis) 37517/7.64 72 12 37 gi|223507406
38 Unknown (Zea mays) 46413/8.48 70 9 24 gi|224029795
50 Ubiquinol-cytochrome c reductase complex 14 kDa protein (Zea mays)
14676/9.78 59 7 45 gi|195627658
61 Unnamed protein product (Vitis vinifera) 82205/6.18 68 15 21 gi|157345364
64 Predicted protein (Micromonas pusilla CCMP1545) 148047/8.96 64 22 17 gi|226460779
66 ATP synthase subunit alpha, chloroplastic 10615/9.97 76 6 71 gi|115502358
70 Hypothetical protein (Vitis vinifera) 25360/9.67 48 5 28 gi|147857970
71 Hypothetical protein SORBIDRAFT_09g004780 (Sorghum bicolor)
84711/5.68 62 12 20 gi|242089665
78 Ribulose-1,5-bisphosphate carboxylase/oxygenase large subunit (Falkia repens)
52003/6.20 204 19 43 gi|21634087
79 ATP synthase CF1 beta subunit (Caulerpa taxifolia) 14446/5.40 60 8 52 gi|219964549
81 Ribulose-1,5-bisphosphate carboxylase/oxygenase large subunit (Falkia repens)
52003/6.20 113 17 33 gi|21634087
95 Ribulose-1,5-bisphosphate carboxylase/oxygenase large subunit (Chrysophyllum oliviforme)
52005/6.14 130 15 32 gi|37194725
100 Hypothetical protein (Vitis vinifera) 22800/5.50 63 7 40 gi|147776335
109 Alanine aminotransferase 2 (Glycine max) 53863/5.42 127 20 49 gi|158122137
112 Hypothetical protein SORBIDRAFT_01g013800 (Sorghum bicolor)
Spot # NCBI closest homologue MW/pI MO PM SC (%) Accession number
125 Unknown (Zea mays) 46413/8.48 70 8 20 gi|224029795
126 Predicted protein (Populus trichocarpa) 42891/9.87 56 8 28 gi|224053192
129 Predicted: hypothetical protein isoform 2 (Vitis vinifera) 23816/7.68 60 7 38 gi|225433648
140 Ribulose-1,5-bisphosphate carboxylase/oxygenase large subunit (Prunus armeniaca var. ansu)
52018/6.63 90 13 27 gi|15987084
143 ATP synthase, beta subunit (Iphigenia indica) 52668/5.16 65 11 21 gi|16943743
144 Glutamine synthetase precursor (Glycine max) 47948/6.73 92 13 39 gi|13877511
147 Os07g0622700 (Oryza sativa(japonica cultivar-group) 36403/8.51 57 8 26 gi|115473437
147 ATP synthase beta subunit (Schoepfia schreberi) 30447/5.12 70 10 31 gi|14718214
148 Cytosolic glutamine synthetase GSbeta1 (Glycine max) 39138/5.48 76 9 30 gi|125550665
151 Glutamine synthetase precursor (Glycine max) 47948/6.73 67 12 28 gi|13877511
161 Ribulose-1,5-bisphosphate carboxylase/oxygenase activase alpha 2 (Gossypium hirsutum)
46944/4.84 80 11 30 gi|78100212
163 Rubisco activase, chloroplast precursor (Vigna radiata) 48042/7.57 123 13 40 gi|10720249
165 Rubisco activase, chloroplast precursor (Vigna radiata) 48042/7.57 123 13 40 gi|10720249
172 Phosphoribulose kinase, putative (Ricinus communis) 45221/5.83 68 13 29 gi|223541989
174 Leucine-rich repeat receptor-like kinase At1g09970 (Arabidopsis thaliana)
36335/5.76 68 9 24 gi|62321062
215 Ribulose-1,5-bisphosphate carboxylase/oxygenase large subunit (Chionochloa acicularis)
1851/5.91 62 4 100 gi|167782336
216 Conserved hypothetical protein (Ricinus communis) 37517/7.64 71 10 33 gi|223507406
222 Ribosomal protein subunit 2 (Phelipanche arenaria) 21334/9.32 77 12 42 gi|83745361
228 Conserved hypothetical protein (Ricinus communis) 37517/7.64 76 11 38 gi|223507406
234 Predicted protein (Populus trichocarpa) 43420/6.93 89 11 26 gi|224096552
237 Chloroplast translational elongation factor Tu (Oryza sativa) 50551/6.05 62 7 24 gi|6525065
240 Hypothetical protein OsI_12352 (Oryza sativa Indica Group) 7143/10.25 58 5 61 gi|218193198
254 Conserved hypothetical protein (Ricinus communis) 37517/7.64 71 10 38 gi|223507406
259 Predicted: similar to thioredoxin-related protein isoform 2 (Vitis vinifera)
30695/8.09 74 10 29 gi|225440205
265 Aldehyde oxidase 1 (Lactuca sativa) 151096/6.34 80 13 10 gi|84579422
284 Chain A, Wild-Type Pea Fnr 35060/6.54 77 14 36 gi|4930123
287 Ferredoxin—NADP reductase, chloroplastic; Short = FNR; Flags: Precursor (Vicia faba)
40838/8.70 99 18 37 gi|729479
335 Ribulose-1,5-bisphosphate carboxylase/oxygenase large subunit (Hypserpa nitida)
52058/6.04 132 19 31 gi|229464412
374 Triosephosphate isomerase (Glycine max) 27415/5.87 145 14 53 gi|77540216
383 Elongation factor 2 (EF-2) (Beta vulgaris) 94708/5.93 63 7 49 O23755
407 Hypothetical protein SORBIDRAFT_05g010323 (Sorghum bicolor)
46371/8.99 63 11 38 gi|242068295
451 Predicted protein (Populus trichocarpa) 42891/9.88 66 9 31 gi|224053192
452 Hypothetical protein OsI_38632 (Oryza sativaIndica Group) 12206/10.42 44 5 45 gi|125536931
454 Os02g0762300 (Oryza sativa(japonica cultivar-group)) 41702/8.86 64 6 18 gi|115448847
474 PSII Oxygen-evolving enhancer protein 2 precursor 19825/4.81 75 12 35 gi|16995778
498 Unknown (Picea sitchensis) 18083/5.89 59 5 34 gi|116780837
510 Unknown (Zea mays) 46413/8.48 72 7 22 gi|224029795
602 ATP synthase beta subunit (Utricularia biflora) 51814/5.09 98 13 25 gi|7688411
611 AT5G50010 (Arabidopsis thaliana) 31261/5.44 57 7 26 gi|227202838
651 Unnamed protein product (Arabidopsis thaliana) 66243/4.95 63 9 14 gi|9294322
656 ATP synthase CF1 alpha subunit (Glycine max) 55776/5.16 127 18 37 gi|91214148
Spot # NCBI closest homologue MW/pI MO PM SC (%) Accession number
656 Conserved hypothetical protein (Ricinus communis) 37517/7.64 68 11 35 gi|223507406
658 ATP synthase CF1 alpha subunit (Glycine max) 55776/5.15 69 14 27 gi|91214148
671 Ribulose bisphosphate carboxylase large subunit (Psoralea aculeata)
52062/6.04 139 23 39 gi|125991557
683 Methionine synthase (Glycine max) 84401/5.93 141 21 30 gi|33325957
684 Hypothetical protein SORBIDRAFT_04g004825 (Sorghum bicolor)
6932/9.30 48 4 63 gi|242060674
688 Conserved hypothetical protein (Ricinus communis) 37517/7.64 73 10 29 gi|223507406
689 Ribulose-biphosphate carboxylase (Mangonia tweedieana) 51846/6.05 159 23 42 gi|209417523
691 Ribulose 1,5-bisphosphate carboxylase-oxygenase large subunit (Rhynchosia minima)
51975/6.14 166 20 38 gi|18157319
725 Conserved hypothetical protein (Ricinus communis) 37517/7.64 64 10 29 gi|223507406
732 Ribulose-1,5-bisphosphate carboxylase/oxygenase large subunit (Croton yucatanensis)
52205/6.09 98 16 37 gi|126166052
793 Ubiquinol-cytochrome c reductase complex 14 kDa protein (Zea mays)
14676/9.78 50 7 43 gi|195627658
799 Hypothetical protein (Vitis vinifera) 42045/7.58 62 11 26 gi|147797309
807 Unknown (Picea sitchensis) 18942/6.30 48 6 34 gi|116792186
809 PSII Oxygen-evolving enhancer protein 1, chloroplast precursor (Pisum sativum)
35100/6.25 91 9 27 gi|131384
809 Cytosolic malate dehydrogenase (Glycine max) 35846/6.32 68 10 31 gi|42521311
815 PSII oxygen-evolving complex protein 3 (Nicotiana tabacum) 35377/5.89 85 9 31 gi|505482
821 AT1G66510 (Arabidopsis thaliana) 25242/6.45 59 8 38 gi|227202636
822 Hypothetical protein (Vitis vinifera) 36723/8.02 71 12 34 gi|147845283
822 Superoxide dismutase (Fe), chloroplastic; Flags: Precursor (Glycine max)
27881/5.60 58 7 33 gi|134646
831 cytosolic malate dehydrogenase (Glycine max) 35846/6.33 63 11 34 gi|42521311
833 Hypothetical protein SORBIDRAFT_02g031280 (Sorghum bicolor)
19264/4.56 60 5 40 gi|242050004
847 Conserved hypothetical protein (Ricinus communis) 37517/7.64 62 10 31 gi|223507406
854 Rubisco small subunit rbcS2 (Glycine max) 20220/8.87 91 6 28 gi|10946377
858 Rubisco small chain 4, chloroplast precursor (Glycine max) 20232/8.87 301 6 26 gi|132113
873 Unnamed protein product (Vitis vinifera) 29280/6.06 101 17 39 gi|157335145
877 Rubisco small subunit rbcS2 (Glycine max) 20220/8.87 175 15 57 gi|10946377
878 Ribulose-1,5-bisphosphate carboxylase small subunit rbcS1 (Glycine max)
20220/8.87 108 11 58 gi|10946375
878 Chain A, Wild-Type Pea Fnr 35060/6.54 84 15 44 gi|4930123
885 Hypothetical protein SORBIDRAFT_05g010323 (Sorghum bicolor)
46371/8.99 60 12 34 gi|242068295
886 Superoxide dismutase (Fe), chloroplastic; Flags: Precursor (Glycine max)
27881/5.60 69 9 35 gi|134646
887 Conserved hypothetical protein (Ricinus communis) 9604/5.49 73 7 61 gi|223536954
890 Conserved hypothetical protein (Ricinus communis) 37517/7.64 66 10 29 gi|223507406
892 Annexin, putative (Ricinus communis) 36405/6.81 59 10 40 gi|223546996
896 Conserved hypothetical protein (Ricinus communis) 123963/8.64 70 13 13 gi|223527844
906 Hypothetical protein MtrDRAFT_AC149204g22v2 (Medicago truncatula)
11312/7.82 57 4 30 gi|124359573
907 R2R3-MYB transcription factor (Arabidopsis thaliana) 5365/10.15 63 5 95 gi|2832490
916 Unknown (Zea mays) 46413/8.48 53 8 21 gi|224029795
919 Predicted protein (Micromonassp. RCC299) 164898/5.23 64 22 16 gi|226517782
67% means identification is significant at p < 0.05), while the number of peptide matches/protein identified varied be-tween 4 and 27 (average of 11), and the sequence coverage varied between 13% and 100% (average of 35%).
The functional classification of the identified proteins is presented in Figure 4. Almost 50% of the identified pro-teins corresponded to propro-teins with unknown function, these representing the largest group. Proteins involved in primary metabolism represented the second largest group, which includes genes involved in photosynthesis, respira-Spot # NCBI closest homologue MW/pI MO PM SC (%) Accession number
925 Ubiquinol-cytochrome c reductase complex 14 kDa protein (Zea mays)
14676/9.78 54 5 33 gi|195627658
930 Os04g0490800 (Oryza sativa(japonica cultivar-group)) 39811/6.75 66 10 30 gi|115459134
945 Hypothetical protein OsJ_14092 (Oryza sativaJaponica Group) 12140/9.69 56 7 58 gi|222628516
949 Conserved hypothetical protein (Ricinus communis) 37517/7.64 65 11 35 gi|223507406
952 Unknown (Zea mays) 46413/8.48 64 8 20 gi|224029795
953 Conserved hypothetical protein (Ricinus communis) 9764/9.3 58 7 61 gi|223549561
965 Granule-bound starch synthase I (Eragrostis advena) 25908/8.52 62 11 55 gi|46326782
966 Hypothetical protein SORBIDRAFT_04g010090 (Sorghum bicolor)
22728/6.07 56 6 38 gi|242064756
973 Superoxide dismutase (Fe), chloroplastic; Flags: Precursor (Glycine max)
27881/5.60 74 10 39 gi|134646
975 Iron-superoxide dismutase (Glycine max) 27506/5.45 92 12 43 gi|37654895
979 Maturase K (Boerhavia coccinea) 32576/9.98 61 7 29 gi|15340912
981 Iron-superoxide dismutase (Glycine max) 27506/5.45 71 8 34 gi|37654895
996 Predicted protein (Populus trichocarpa) 46287/9.41 66 12 26 gi|224077440
1003 Predicted protein (Populus trichocarpa) 26058/8.97 64 7 37 gi|224103329
1014 Iron-superoxide dismutase (Glycine max) 27506/5.45 77 10 37 gi|37654895
1096 Ubiquinol-cytochrome c reductase complex 14 kDa protein (Zea mays)
14676/9.78 59 7 43 gi|195627658
1097 Conserved hypothetical protein (Ricinus communis) 37517/7.64 54 9 26 gi|223507406
1112 Nucleoside diphosphate kinase (Glycine max) 16402/6.91 73 7 41 gi|26245395
1437 ATP synthase beta subunit (Nepenthes alata) 53059/5.09 71 13 30 gi|6017816
1618 Predicted protein (Ostreococcus lucimarinus) 84020/6.65 63 10 16 gi|145352412
1637 Hypothetical protein OsI_18273 (Oryza sativaIndica) 41096/6.53 63 10 30 gi|125550665
Table 1 (cont.)
Figure 3- Leaf proteome map indicating proteins identified by MALDI-TOF-MS peptide mass fingerprinting obtained from peptide fragments of trypsin digested proteins. The numbered spots indicate proteins identified and described in Table 1.
tion and biosynthetic metabolism, the latter mainly repre-sented by enzymes involved in amino acid biosynthesis.
The fact that a transcription factor and some proteins involved in signaling were present in the small part of the leaf proteome analyzed indicates that some low-abundance proteins could be quantified using the 2-DE method pre-sented herein. For yeast, the most abundant proteins are present at around 2,000,000 copies per cell, which repre-sents 4% of total protein, whereas the least abundant pro-teins, which likely includes transcription factors and signaling proteins (Futcher et al., 1999), are present at around 100 copies per cell (a difference of four orders of magnitude). Low-abundance proteins are generally consid-ered difficult or even impossible to detect using 2-D gel electrophoresis (Görget al., 2004; Krishnan and Natarajan, 2009), while genes of unknown function typically encode low-abundance proteins. Taken together, these facts are in-dicative that the modifications made to the TCA/acetone method allow increased detection of proteins expressed at low levels. This in turn can be partially explained by both increases in protein solubility. Based on published results and those available in the Soybean Proteomic Database that describe soybean leaf proteins (Krishnan and Natarajan, 2009; Sakataet al., 2009; Ahsanet al., 2010), we were able to add 72 new proteins to the soybean 2-DE profile, the ma-jority of these being proteins of low abundance.
Acknowledgments
We would like to thank Dr. Thomas Christopher Rhys Williams for critical reading of the manuscript, and CNPq for financial support of the Genosoja network project.
References
Ahsan N, Donnart T, Nouri MZ and Komatsu S (2010) Tis-sue-specific defense and thermo-adaptive mechanisms of soybean seedlings under heat stress revealed by proteomic approach. J Proteome Res 9:4189-4204.
Arai Y, Hayashi M and Nishimura M (2008) Proteomic analysis of highly purified peroxisomes from etiolated soybean coty-ledons. Plant Cell Physiol 49:526-539.
Brechenmacher L, Lee J, Sachdev S, Song Z, Nguyen TH, Joshi T, Oehrle N, Libault M, Mooney B, Xu Det al.(2009) Estab-lishment of a protein reference map for soybean root hair cells. Plant Physiol 149:670-682.
Bradford MM (1976) A rapid and sensitive method for the quan-titation of microgram quantities of protein utilizing the prin-ciple of dye binding. Anal Biochem 72:248-254.
Cho JH, Hwang H, Cho MH, Kwon YK, Jeon JS, Bhoo SH and Hahn TR (2008) The effect of DTT in protein preparations for proteomic analysis: Removal of a highly abundant plant enzyme, ribulose bisphosphate carboxylase/oxygenase. J Plant Biol 51:297-301.
Corthalis GL, Wasinger VC, Hochstrasser DF and Sanchez JC (2000) The dynamic range of protein expression: A chal-lenge for proteomic research. Electrophoresis 21:1104-1115.
Djordjevic MA, Oakes M, Li DX, Hwang CH, Hocart CH and Gresshoff PM (2007) The glycine max xylem sap and apo-plast proteome. J Proteome Res 6:3771-3779.
Feller U, Anders I and Mae T (2008) Rubiscolytics: Fate of Rubisco after its enzymatic function in a cell is terminated. J Exp Bot 59:1615-1624.
Futcher B, Latter GI, Monardo P, McLaughlin CS and Garrels JI (1999) A sampling of the yeast proteome. Mol Cell Biol 19:7357-7368.
Görg A, Weiss W and Dunn MJ (2004) Current two-dimensional electrophoresis technology for proteomics. Proteomics 4:3665-3885.
Hajduch M, Ganapathy A, Stein JW and Thelen JJ (2005) A sys-tematic proteomic study of seed filling in soybean: Estab-lishment of high-resolution two-dimensional reference maps, expression profiles, and an interactive proteome data-base. Plant Physiol 137:1397-1419.
Herbert BR, Harry JL, Packer NH, Gooley AA, Pedersen SK and William KL (2001) What place for polyacrylamide in pro-teomics? Trends Biotechnol 19:S3-S9.
Herman EM, Helm RM, Jung R and Kinney AJ (2003) Genetic modification removes an immunodominant allergen from soybean. Plant Physiol 132:36-43.
Komatsu S, Kobayashi Y, Nishizawa K, Nanjo Y and Furukawa K (2010) Comparative proteomics analysis of differentially expressed proteins in soybean cell wall during flooding stress. Amino Acids 39:1435-1449.
Komatsu S, Yamamoto A, Nakamura T, Nouri MZ, Nanjo Y, Nishizawa K and Furukawa K (2011) Comprehensive analy-sis of mitochondria in roots and hypocotyls of soybean un-der flooding stress using proteomics and metabolomics tech-niques. Proteome Res 10:3993-4004.
Krishnan HB and Natarajan SS (2009) A rapid method for deple-tion of Rubisco from soybean (Glycine max) leaf for proteo-mic analysis of lower abundance proteins. Phytochemistry 70:1958-1964.
Laemmli U (1970) Cleavage of structural proteins during the as-sembly of the head of the bacteriophage T4. Nature 227:680-685.
Mooney BP, Krishnan HB and Thelen JJ (2004) High-throughput peptide mass fingerprinting of soybean seed proteins: Auto-mated workflow and utility of UniGene expressed sequence tag databases for protein identification. Phytochemistry 65:1733-1744.
Nanjo Y, Skultety L, Ashraf Y and Komatsu S (2010) Compara-tive proteomic analysis of early-stage soybean seedlings re-sponses to flooding by using gel and gel-free techniques. J Proteome Res 9:3989-4002.
Natarajan S, Xu C, Caperna TJ and Garrett WM (2005) Compari-son of protein solubilization methods suitable for proteomic analysis of soybean seed proteins. Anal Biochem 342:214-220.
Natarajan SS, Xu C, Bae H, Caperna TJ and Garrett WM (2006) Characterization of storage proteins in wild (Glycine soja) and cultivated (Glycine max) soybean seeds using proteomic analysis. J Agric Food Chem 54:3114-3120.
Oehrle NW, Sarma AD, Waters JK and Emerich DW (2008) Proteomic analysis of soybean nodule cytosol. Phytoche-mistry 69:2426-2438.
Perkins DN, Pappin DJC, Creasy DM and Cottrell JS (1999) Prob-ability-based protein identification by searching sequence databases using mass spectrometry data. Electrophoresis 20:3551-3567.
Rose JK, Bashir S, Giovannoni JJ, Jahn MM and Saravanan RS (2004) Tackling the plant proteome: Practical approaches, hurdles and experimental tools. Plant J 39:715-733. Sakata K, Ohyanagi H, Nobori H, Nakamura T, Hashiguchi A,
Nanjo Y, Mikami Y, Yunokawa H and Komatsu S (2009) Soybean Proteome Database: A data resource for plant dif-ferential omics. J Proteome Res 8:3539-3548.
Shaw MM and Riederer BM (2003) Sample preparation for two-dimensional gel electrophoresis. Proteomics 3:1408-1417. Shen S, Matsubae M, Takao T, Tanaka N and Komatsu S (2002) A
proteomic analysis of leaf sheaths from rice. J Biochem 132:613-620.
Wan J, Torres M, Ganapathy A, Thelen J, Dague BB, Mooney B, Xu D and Stacey G (2005) Proteomic analysis of soybean root hairs after infection by Bradyrhizobium japonicum. Mol Plant Microbe Interact 18:458-467.
Wang W, Scali M, Vignani R, Spadafora A, Sensi E, Mazzuca S and Cresti M (2003) Protein for two-dimensional electro-phoresis from olive leaf, a plant tissue containing hight lev-els of interfering compounds. Electrophoresis 24:2369-2375.
Zhang YM, Zhao JM, Xiang Y, Bian XC, Zuo QM, Shen Q, Gai JY and Xing H (2011) Proteomics study of changes in soy-bean lines resistant and sensitive to Phytophthora soja. Proteome Sci 9:52-59.
Xi J, Wang X, Li S, Zhou X, Yue L, Fan J and Hao D (2006) Poly-ethylene glycol fractionation improved detection of low-abundant proteins by two-dimensional electrophoresis anal-ysis of plant proteome. Phytochemistry 67:2341-2348.
Internet Resources
Soybean Database, http://proteome.dc.affrc.go.jp/Soybean/ (ac-cessed January 10, 2010).