835 835 835 835 835 Mem Inst Oswaldo Cruz, Rio de Janeiro, Vol. 92(6): 835-841, Nov./Dec. 1997
Compositional Constraints in the Extremely GC-poor
Genome of
Plasmodium falciparum
Héctor Musto/
+, Simone Cacciò*, Helena Rodríguez-Maseda**,
Giorgio Bernardi*
Sección Bioquímica, Facultad de Ciencias, Tristán Narvaja 1674, Montevideo, Uruguay *Laboratoire de Génétique Moléculaire, Institut Jacques Monod, 2 Place Jussieu, 75005 Paris, France **Departamento de
Genética, Facultad de Medicina, Tristán Narvaja 1674, Montevideo, Uruguay
We have analyzed the compositional properties of coding (protein encoding) and non-coding se-quences of Plasmodium falciparum, a unicellular parasite characterized by an extremely AT-rich ge-nome. GC% levels, base and dinucleotide frequencies were studied. We found that among the various factors that contribute to the properties of the sequences analyzed, the most relevant are the composi-tional constraints which operate on the whole genome.
Key words: Plasmodium falciparum - GC levels - dinucleotides - genome organization
Understanding the molecular biology of Plas-modium falciparum is important not only because this unicellular parasite is responsible for the most virulent form of human malaria, but also because it hosts the GC-poorest nuclear genome known so far. Indeed, its GC% is only 18% (Goman et al. 1982, Pollack et al. 1982, McCutchan et al. 1984). Therefore, this genome is an excellent model to analyze compositional constraints (Bernardi & Bernardi 1986) and their effects, both on coding and non-coding sequences.
In a previous paper (Musto et al. 1995) we have studied 175 kb of coding (translated) sequences and confirmed the trends described previously by other authors with more limited sets of data, which can be summarized as follows: (i) the coding strand is biased towards purines; (ii) A is the most fre-quent base in all codon positions; and (iii) A and T are strongly predominant in third codon positions (Weber 1987, Saul & Battistutta 1988).
Further, we found that these compositional bi-ases are shared by both housekeeping genes and antigens, and, most important, the bias towards AT is so strong that (i) the five most represented amino acids, which constitute 44.4% of all residues, are encoded by A or T in the second codon position, and (ii) the preferences among synonymous codons
seem to be determined neither by the level of ex-pression of each gene (Grantham et al. 1981, Gouy & Gautier 1982, Sharp et al. 1986, Shields & Sharp 1987) nor by other factors such as optimization of codon-anticodon interaction energy (Grosjean et al. 1978) or adaptation of codons to the actual popu-lations of isoaccepting t-RNAs (Ikemura 1981a, b, 1982). Indeed, the biases in all sequences are almost identical, suggesting that both codon usage and amino acid frequencies are determined prima-rily by the extremely biased composition of the genome, and that the compositional constraints (Bernardi & Bernardi 1986) operate in the same direction over all the protein-encoding genes and their codon positions.
Support for this conclusion comes from the fact that the biases displayed at the amino acid and codon usage levels are almost identical in P. falciparum and in the bacterium Staphylococcus aureus. These two organisms are only very dis-tantly related, and probably the major genome fea-ture that they have in common is the extremely high AT level (Musto et al. 1995).
In order to gain further insight into the genome organization of P. falciparum, and in particular to try to understand how the constraints operate on this genome as a whole, we extended our previous results (Musto et al. 1995) to all the sequences now available (September 1995), and included non-translated sequences (5', 3' and introns), since this non-coding DNA might be subject to a different compositional pressure than protein-encoding DNA. Further, dinucleotide frequencies were ana-lyzed in coding and non-coding regions. As ex-pected, the analysis of genes confirm previous find-ings, but in non-coding DNA the AT bias was found
Financial support: CSIC Committee of the Universidad de la República, and Programa Científico-Técnológico CONICYT-BID, Uruguay.
+Corresponding author. Fax: 598-2-949563. E-mail:
836 836 836 836
836 The Genome of Plasmodium falciparum • Héctor Musto et al.
to be stronger than in coding sequences, showing that the compositional constraints (Bernardi & Bernardi 1986) operate in the same direction on the whole genome.
MATERIALS AND METHODS
Sequences analyzed - The sequences studied (totalling 336,566 bases) were obtained from Re-lease 90 of GenBank (September 1995), using the ACNUC retrieval system (Gouy et al. 1984). The accession numbers and mnemonics are available upon request by e-mail to the following address: «[email protected]». Table I summarizes the number of sequences analyzed and their length. Dinucleotide (diN) Observed/Expected (O/E) val-ues were calculated by dividing the observed counts for each diN by the values expected assuming ran-dom association of bases.
TABLE I Sequences analyzed
Genes 5´ 3´ Introns
Sequences 128 70 72 30
Bases 269,421 24,117 29,954 13,074
The number of sequences and base pairs analyzed in each category is indicated. 5´and 3´ are the unstraslated sequences located 5´of the initiation codon and 3´of the stop codon, respectively. In total, 336,566 bases were analyzed.
RESULTS
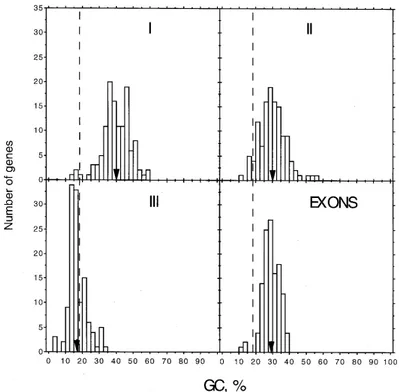
GC levels - The compositional (GC) patterns, i.e., the compositional distributions of large genome fragments and of each of the three codon positions (and particularly of third codon positions), exons, introns, 5'- and 3'- untranslated regions (UTR), dif-fer characteristically among difdif-ferent genomes (Bernardi et al. 1985, Bernardi & Bernardi 1986, Bernardi 1995). Given the extreme GC-poorness of the genome of P. falciparum, it was considered to be interesting to analyze the extent of this bias in the different genomic regions and codon positions. Fig. 1 shows the histograms of the composi-tional distribution of the three codon positions and exons. Fig. 2 displays the same feature for introns, and 5'- UTR and 3'- UTR. The GC levels of first codon positions cover a range of 46%, from 14 to 60% and show a bimodality. The mean value of the distribution is 40%, and the two major peaks are at 35% and 45% GC. It should be noted that in our previous study (Musto et al. 1995), two genes displayed values higher than 70% GC. However, these genes were not considered in this study since these extremely high GC values are associated to a strongly biased amino acid composition.
The distribution of second codon positions cov-ers a GC range of 45% (12%-57%), and its shape is unimodal. The mean GC value (30%) is lower than that of the first codon position.
837 837837 837837 Mem Inst Oswaldo Cruz, Rio de Janeiro, Vol. 92(6), Nov./Dec. 1997
Concerning the GC poorness of the P. falciparum genome, the most informative distri-bution is that of third codon positions. The analy-sis of the histogram shows that all sequences are clustered in a very narrow range of values (31%) and displays genes with GC levels as low as 3-4% with a maximum value of 34%. The distribution of the genes is unimodal and asymmetrical, since it trails towards relatively higher GC values. Its mean GC level is 17%, a figure almost identical to the GC level reported for the whole genome. We note that the order of GC levels among the three codon positions is I>II>III as already found in prokaryotic GC-poor genomes (D’Onofrio & Bernardi 1992).
The histogram of GC levels of exons shows a unimodal distribution with a mean value of 29%, covering a range of 27%. Minimum and maximum values are 12% and 39%, respectively.
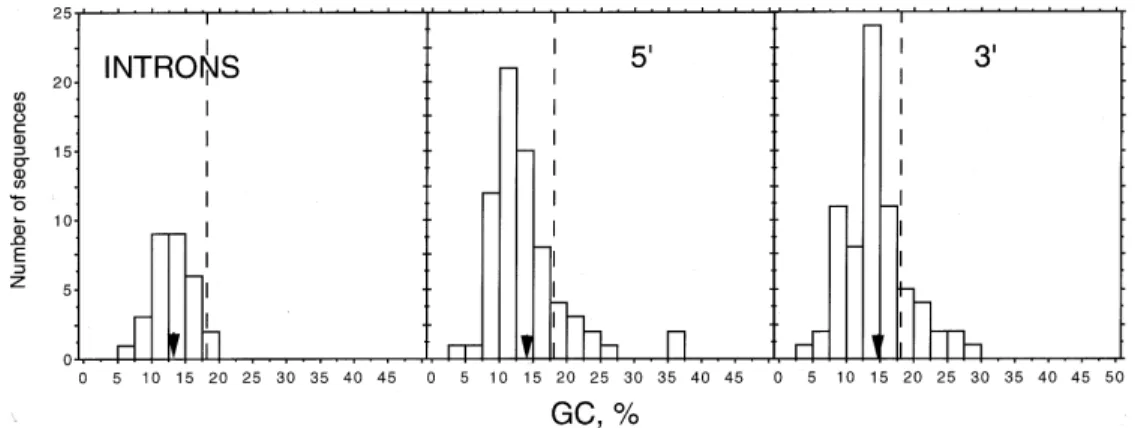
Fig. 2 shows the histograms of the composi-tional distributions of non-coding sequences, i.e., introns and 5'- and 3'- sequences. The GC levels of introns range from 6% to 18%, and the mean value is 13%. It is interesting to note that most introns display lower GC levels than the whole genome. Indeed, only two out of 30 introns reach GC val-ues higher than 17.5%. 5'- UTR and 3'- UTR, on the other hand, show very similar distributions and mean values (14% and 15%, respectively). The only difference between them is that two 5' se-quences display values around 36% whereas the highest value reached by 3' sequences is 29%. As in the case of introns, the mean GC level of UTR is lower than 18% GC of the whole genome (Goman et al. 1982, Pollack et al. 1982, McCutchan et al. 1984).
Finally, the order of GC levels among different regions of the genome is exons > whole genome > 3'- ≅ 5'- UTR > introns (Fig. 3).
Base contents - In order to detect compositional biases in the coding strands, and more precisely, to see whether A and T are equally represented, the base contents of each region and codon posi-tion were analyzed.
Table II displays the percentage of each base in the three codon positions (I, II, III), exons (tot), 5'- UTR, introns and 3'- UTR. As already described using more limited sets of data (Saul & Battistutta 1988, Musto et al. 1995), A is the most frequent base in the coding strand in all codon positions, followed by G in I and by T in II and III. Purines (R) are predominant over pyrimidines (Y) in all codon positions. This is more evident in I and II positions (67.7% and 56.1%, respectively), whereas in III position the difference between the two types of bases is negligible (R = 51.6% and Y = 48.4%). When exons are considered, the pre-dominance of A (41.6% of all bases) and of R (58.4%) is evident.
Fig. 2: compositional patterns of introns, 5'- UTR and 3'- UTR. Abscissae, ordinates, arrowheads and broken lines as in Fig. 1.
838 838 838 838
838 The Genome of Plasmodium falciparum • Héctor Musto et al.
In contrast with exons, T > A and Y > R in 5'-UTR and introns, while the biases in 3'- 5'-UTR are the same as those found in translated regions. These similarities between 3'- UTR and exons extend to the order of base levels, since in the two regions A>T>G>C. On the other hand, this order is T>A>C>G in 5'- UTR and T>A>G>C in introns.
Dinucleotide (diN) analysis - DiN biases have been related to diverse phenomena, like level of expression (Hanai & Wada 1990), CpG methyla-tion (Bird 1980), and conformamethyla-tional structure of DNA (Nussinov 1984, Hunter 1993). Moreover, doublet frequencies (as is the case of codon usage) may be different in different genes in a given or-ganism. This variability is evident in composition-ally compartmentalized genomes, like those of mammals, where genes located in GC-rich regions are richer in «GC» diNs (GpG, GpC, CpC and CpG) than sequences located in GC-poor regions (Bernardi et al. 1985, Hanai & Wada 1988). Con-versely, the reciprocal is true for «AT» diNs (ApA, ApT, TpA and TpT), which are more frequent in genes located in GC-poor regions of the genome. To understand how the constraints imposed by this extremely AT-rich genome is expressed at the dou-blet level, we analyzed the diNs O/E ratios in ev-ery region.
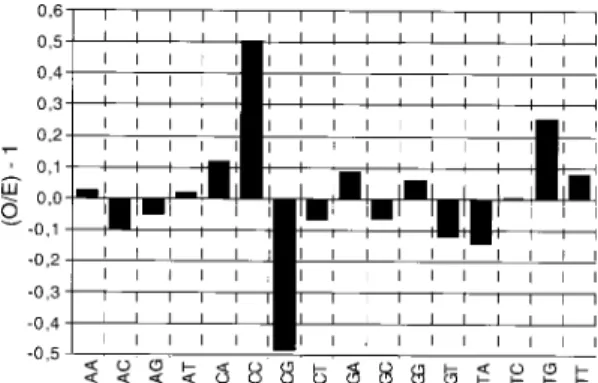
The ratios for exons are shown in Fig. 4, and the analyses for 5'- UTR, introns and 3'- UTR are displayed in Fig. 5. In the two cases, the ratios are expressed as (O/E)-1. The actual percentage of doublets for each region analyzed is presented in Table IIIa.
In exons (Fig. 4) more than half of the dou-blets display ratios around ±10% of the expected values. This is the case for ApA, ApG, ApT, CpT, GpA, GpC, GpG, TpC and TpT. «AT» diNs are the most frequent and comprise 52.3% of all dou-blets (Table IIIa). This strong bias in diN
prefer-ences in translated regions implies a bias in amino acids usage towards residues coded by GC-poor codons, which is indeed found (Musto et al. 1995). On the other hand, «GC» diNs are the less frequent doublets (7.3%) but CpC is 50% over the expected values whereas, as noted, GpC and GpG fluctuate (although in opposite directions) ±10% around the expected values.
CpG is the least frequent diN, whereas TpG and CpA are over the expected values. It has been argued that the methylation of CpG on the C resi-due, giving rise to 5mCpG, followed by deamina-tion and mutadeamina-tion to T can explain both the underrepresentation of CpG and the excess of TpG and CpA (Salser 1977, Bird 1980). In this connec-tion, it should be noted that the presence of 5mC has been reported in P. falciparum (Pollack et al. 1991), and hence might explain, at least partially, the CpG avoidance and TpG and CpA excess.
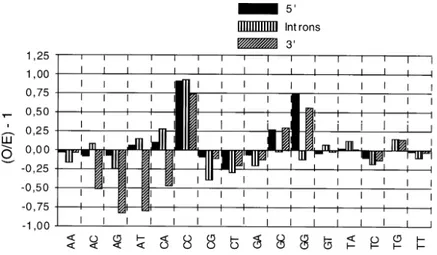
DiN O/E ratios of non-coding sequences are displayed in Fig. 5, and the corresponding percent-ages are shown in Table IIIa. In Fig. 5 it can be seen that ten diNs display biases in the same direc-tion in the three non-coding regions, but usually with rather different ratios. The most biased diN is CpC, which is always over the expected values. ApG and CpG are consistently underrepresented, but the avoidance of the former is clearer in 3'-UTR, whereas the supression of the latter is evi-dent in introns. ApT and CpA show similar biases, since the two are over the expected values in 5'-UTR and introns but depleted in 3'- 5'-UTR. Among the six pairs of complementary diNs, four (ApA/ TpT; ApC/GpT; ApG/CpT and GpA/TpC) display the same biases in the three non-translated regions, whereas this is not the case for CpA/TpG and CpC/ GpG.
Concerning the diNs percentages (Table IIIa), it is evident that, as is the case with exons, the three non-translated regions are extremely rich in «AT» diNs, which together represent about 75% of all
TABLE II
Base frequencies (%) in Plasmodium falciparum
Nucleotide frequencies
A C G T
I 38.9 (6.1) 11.0 (3.4) 28.8 (7.2) 21.3 (5.9) II 42.9 (8.0) 17.0 (5.5) 13.2 (3.5) 27.0 (6.7) III 43.0 (6.0) 8.4 (3.8) 8.6 (3.9) 40.0 (7.5) tot 41.6 (4.4) 12.1 (3.1) 16.8 (3.1) 29.4 (4.9)
5´ 40.3 (10.1) 7.3 (3.1) 6.4 (4.1) 45.9 (10.6) Int 39.7 (5.3) 5.9 (2.0) 7.2 (1.5) 47.3 (6.4) 3´ 45.2 (8.2) 6.7 (2.6) 7.5 (3.1) 40.6 (9.0)
I, II and III are first, second and third codon position, respectively. tot are total values for exons. 5´, Int and 3´ are 5´ UT. introns and 3´ UT, respectively. Standard deviations are given in parentheses.
839 839839 839839 Mem Inst Oswaldo Cruz, Rio de Janeiro, Vol. 92(6), Nov./Dec. 1997
than the other three diNs. But in spite of this dif-ference, the frequencies of doublets and the order of preferences are very similar in non-coding DNA. This is clearly shown in Table IIIb, where the diNs are sorted according to their frequencies in each region.
A very important point is that the similarities of diNs frequencies is not limited to non-translated regions but extends to exons. Indeed, it can be seen in Table IIIb that the four most frequent doublets in all regions are the «AT» diNs, whereas «GC» diNs are always the least represented. This point is not a trivial one, since the frequencies of doublets in exons reflects the amino acids composition of the proteins; and further confirms that the extreme GC-poorness of the genome impose strong com-positional constraints which operate in the same direction on the whole genome, on both coding and non-coding sequences (Bernardi & Bernardi 1986).
The diNs biases reported here are similar to the ones described earlier when fewer DNA sequence data were available. Indeed, Hyde and Sims (1987) analyzed 30 Kb of coding DNA, 3 Kb of 5'- UTR, 6.3 of 3'- UTR and 1.1 kb of intron sequences. Although we found some differences, specially in non-translated sequences, the degree of similarity is such that we propose that the biases described here are representative of the whole genome and will not change dramatically when more data be-come available.
DISCUSSION
The genome of P. falciparum is the most AT-rich nuclear genome known, since its GC level is only 18% (Goman et al. 1982, Pollack et al. 1982, McCutchan et al. 1984). Therefore, it is an excel-lent model to analyze compositional constraints
Fig. 5: weight-averaged (Observed/Expected)-1 dinucleotide frequencies for the total sum of 5'- UTR (5’), introns and 3'- UTR (3’).
TABLE III Dinucleotides frequencies a)
diN exons 5´ UT Introns 3´ UT
AA 18.6 17.5 13.3 17.9
AC 4.3 2.6 2.6 2.9
AG 6.5 2.7 2.0 2.4
AT 13.0 19.3 22.0 19.5
CA 5.4 3.4 3.2 3.4
CC 1.9 1.1 0.8 1.0
CG 0.9 0.5 0.3 0.6
CT 3.1 2.2 1.9 2.3
GA 7.5 2.8 2.1 2.9
GC 1.8 0.7 0.5 0.7
GG 2.7 1.0 0.5 0.9
GT 4.2 2.8 3.5 3.1
TA 11.0 18.6 21.4 18.5
TC 3.3 2.7 2.2 2.6
TG 6.0 3.2 3.8 3.8
TT 9.7 18.8 20.1 17.4
b)
Exons
AA>AT>TA>TT>GA>AG>TG>CA>AC>GT>TC>CT>GG>CC>GC>CG 5´UT
AT>TT>TA>AA>CA>TG>GT=GA>AG=TC>AC>CT>CC>GG>GC>CG Introns
AT>TA>TT>AA>TG>GT>CA>AC>TC>GA>AG>CT>CC>GG=GC>CG 3´UT
AT>TA>AA>TT>TG>GA>GT>AC=GA>TC>AG>CT>CC>GG>GC>CG
a) Dinucleotide (diN) frequencies, expressed as percentages, in exons, 5´UT, introns and 3´UT. b) DiNs sorted according to their frequencies in each region considered.
840 840 840 840
840 The Genome of Plasmodium falciparum • Héctor Musto et al.
(Bernardi & Bernardi 1986) and their effects, both on coding and non-coding sequences.
In a previous paper (Musto et al. 1995) we re-ported that the biases in base composition of dif-ferent codon positions and codon preferences are not only almost identical in housekeeping and an-tigen sequences, but biased towards A and T. At the same time, the amino acids frequencies showed the same trend, i.e., the most preferred residues are those encoded by codons having A and/or T in first and second codon positions. Further, these biases are almost identical in S. aureus, and probably the only genome feature that the two organisms have in common is the extreme low genomic GC level. In this paper, we report an updated analysis of the compositional (GC%) distribution, base con-tents and diNs frequencies of the three codon po-sitions, exons, introns, 5'- UTR and 3'- UTR se-quences. Two points seem to be of relevance.
First, since previous reports (Hyde & Sims 1987, Weber 1988, Musto et al. 1995) the number of different genes available increased dramatically, and parameters like the compositional distributions, base contents and dinucleotide biases did not change; so it is possible to conclude that the val-ues reported here are representative of the proper-ties of all genes, and probably of the whole ge-nome, of P. falciparum.
Second, it seems clear that the architecture of tranlated (both housekeeping and antigens, see Musto et al. 1995) and non-translated sequences, including introns, seems to be very similar. Indeed, all the regions analyzed have in common features like (i) the rather homogeneous and very similar compositional patterns (compare the histograms of GC levels of third codon positions, introns, 5'- UTR and 3'- UTR), (ii) the evident GC-poorness, (iii) the individual base distributions and (iv) the dou-blet frequencies. In all likehood, these features underlie the great similarity of codon usage and amino acids frequencies among different genes (see above).
If we take into consideration that all these char-acteristics are very similar to those found in S. aureus (Musto et al. 1995, Musto et al. unpublished results), the most obvious conclusion is that among the various factors that certainly contribute to the compositional features of the coding and non-cod-ing sequences, the most relevant are the composi-tional constraints (Bernardi & Bernardi 1986) which operate on the genome (or on isochores, in compositionally heterogeneous genomes) as pre-viously proposed (for reviews, see Bernardi 1993a, b, 1995).
In conclusion, we postulate that as more DNA sequence data accumulate, it will be found that translated sequences from genomes with similar
GC% levels, will display similar features (codon usage, amino acids frequencies, bases distribution) regardless of the taxonomic proximity of the ge-nomes considered.
REFERENCES
Bernardi G 1993a. The vertebrate genome: isochores and evolution. Mol Biol Evol 10: 186-204.
Bernardi G 1993b. The isochore organization of the hu-man genome and its evolutionary history - a review. Gene 135: 57-66.
Bernardi G 1995. The human genome: organization and evolutionary history. Annu Rev Genetics 29: 445-476. Bernardi G, Bernardi G 1986. Compositional constraints
and genome evolution. J Mol Evol24: 1-11. Bernardi G, Olofsson B, Filipski J, Zerial M, Salinas J,
Cuny G, Meunier-Rotival M, Rodier F 1985. The mosaic genome of warm-blooded vertebrates. Sci-ence228: 953-956.
Bird AP 1980. DNA methylation and the frequency of CpG in animal DNA. Nucleic Acids Res8: 1499-1504.
D’Onofrio G, Bernardi G 1992. A universal composi-tional correlation among codon positions. Gene110: 81-88.
Goman M, Langsley G, Hyde J, Yankovsky N, Zolg J, Scaife J 1982. The establishment of genomic DNA libraries for the human malaria parasite Plasmodium falciparum and identification of indivudual clones by hybridisation. Mol Biochem Parasitol5: 391-400. Gouy M, Gautier C 1982. Codon usage in bacteria: cor-relation with gene expressivity. Nucleic Acids Res 10: 7055-7074.
Gouy M, Milleret F, Mugnier C, Jacobzone M, Gautier C 1984. ACNUC: a nucleic acid sequence data base and analysis system. Nucleic Acids Res12: 121-127. Grantham R, Gautier C, Gouy M, Jacobzone M, Mercier R 1981. Codon catalog usage is a genome strategy modulated for gene expressivity. Nucleic Acids Res 9: r43-r74.
Grosjean H, Sankoff D, Jou W, Fiers W, Cedergren R 1978. Bacteriophage MS2 RNA: a correlation be-tween the stability of the codon: anticodon interac-tion and the choice of code words. J Mol Evol12: 113-119.
Hanai R, Wada A 1988. The effects of guanine and cy-tosine variation on dinucleotide frequency and amino acid composition in the human genome. J Mol Evol 27: 321-325.
Hanai R, Wada A 1990. Doublet preference and gene evolution. J Mol Evol30: 109-115.
Hunter C 1993. Sequence-dependent DNA structure. The role of base stacking interactions. J Mol Biol230: 1025-1054.
Hyde J, Sims P 1987. Anomalous dinucleotide frequen-cies in both coding and non-coding regions from the genome of the human malaria parasite Plasmodium falciparum. Gene 61: 177-187.
841 841841 841841 Mem Inst Oswaldo Cruz, Rio de Janeiro, Vol. 92(6), Nov./Dec. 1997
Ikemura T 1981b. Correlation between the abundance of Escherichia coli transfer RNAs and the occur-rence of the respective codons in its protein genes: a proposal for a synonymous codon choice that is op-timal for the E. coli translation system. J Mol Biol 151: 389-409.
Ikemura T 1982. Correlation between the abundance of yeast tRNAs and the occurrence of the respective codons in protein genes. J Mol Biol158: 573-597. McCutchan T, Dame J, Miller L, Barnwell J 1984.
Evo-lutionary relatedness of Plasmodium species as de-termined by the structure of DNA. Science225: 808-811.
Musto H, Rodríguez-Maseda H, Bernardi G 1995. Com-positional properties of nuclear genes from Plasmo-dium falciparum. Gene 152: 127-132.
Nussinov R 1984. Doublet frequencies in evolutionary distinct groups. Nucleic Acids Res12: 1749-1763. Pollack Y, Katzen A, Spira D, Golenser J 1982. The
genome of Plasmodium falciparum. I: DNA com-position. Nucleic Acids Res10: 539-546.
Pollack Y, Kogan N, Golenser J 1991. Plasmodium falciparum: evidence for a DNA methylation pat-tern. Exp Parasitol72: 339-344.
Salser W 1977. Globin mRNA sequences: analysis of base pairing and evolutionary implications. Cold Spring Harbor Symp Quant Biol40: 985-1002. Saul A, Battistutta D 1988. Codon usage in Plasmodium
falciparum. Mol Biochem Parasitol27: 35-42. Sharp P, Tuohy T, Mosurski K 1986. Codon usage in
yeast: cluster analysis clearly differentiates highly and lowly expressed genes. Nucleic Acids Res14: 5125-5143.
Shields X, Sharp P 1987. Synonymous codon usage in Bacillus subtilis reflects both translational selection and mutational constraints. Nucleic Acids Res15: 8023-8040.
Weber JL 1987. Analysis of sequences from the ex-tremely A+T-rich genome of Plasmodium falciparum. Gene52: 103-109.