EXPLORATORY MULTIVARIATE STATISTICAL METHODS
APPLIED TO PHARMACEUTICAL
INDUSTRY CRM DATA
by
Jorge Manuel Santos Freire Tavares
Dissertation submitted in partial fulfilment of the requirements for the degree of Mestre em Estatística e Gestão de Informação
[Master of Statistics and Information Management]
Instituto Superior de Estatística e Gestão de Informação da
EXPLORATORY MULTIVARIATE STATISTICAL METHODS
APPLIED TO PHARMACEUTICAL
INDUSTRY CRM DATA
Dissertation supervised by Professor Doutor Fernando Lucas Bação
Professor Doutor Pedro Simões Coelho
Acknowledgements
To Professor Fernando Lucas Bação and Professor Pedro Simões Coelho for their orientation
and support during the execution of this work.
To my friends and family, because of my needed absences to do this work, thank you very much
ABSTRACT
An analysis of the current CRM systems in the Pharmaceutical Industry, the way the
pharmaceutical companies developed them and a comparison between Europe and United States was done in this study. Overall the CRM in the pharmaceutical industry is far-behind, when
compared with other business areas, like consumer goods, finance (banking) or insurance
companies, being pharmaceutical CRM specifically less developed in Europe when compared to
United States.
One of the big obstacles for the success of CRM in the pharmaceutical industry is the poor
analytics applied to the current CRM programs. Improving Sales and Marketing Effectiveness
by apllying, multivariate exploratory statistical methods, specifically Factor Analysis and
Clustering into pharmaceutical CRM data from a Portuguese pharmaceutical company was the main goal of this thesis. Their overall usefulness when applied to the business was
demonstrated, and specifically in relation to the cluster methods, SOMs outperformed the
hierarchical methods by producing a more meaningful business solution.
RESUMO
Neste estudo, foi feita uma análise dos sistemas de CRM actualmente utilizados na indústria farmacêutica, a maneira como as empresas farmacêuticas os desenvolvem, fazendo uma
comparação entre a Europa e os Estados Unidos da América. Na sua globalidade o CRM na
indústria farmacêutica está menos desenvolvido quando comparado com outras áreas de
negócio, tais como o grande consumo, banca ou seguradoras, sendo ainda menos desenvolvido o CRM farmacêutico na Europa quando comparado com os Estados Unidos.
Um dos grandes obstáculos para o sucesso do CRM na indústria farmacêutica é a fraca análise
de dados feita nos actuais programas de CRM. Melhorar a eficiência nos processos associados
ao marketing e ás vendas, usando métodos exploratórios de análise multivariada, especificamente Análise Factorial e Análise de Clusters, aplicados a um conjunto de dados
proveniente de uma empresa farmacêutica Portuguesa, é o principal objectivo desta tese. A
utilidade destes métodos quando aplicados no contexto da área de negócio em estudo
demonstrou a sua utilidade e especificamente em relação á análise de clusters, globalmente os métodos hierárquicos foram inferiores na produção de uma solução válida para a área de
Key Words
Customer Relatationship Management
Pharmaceutical Industry
Exploratory Multivariate Statistical Methods
Factor Analysis
Hierarchical Cluster analysis
Self- Organizing Map
Palavras- Chave.
Gestão de Relacionamento do Cliente
Indústria Farmacêutica
Analise de Dados Exploratória Multivariada
Análise Factorial
Análise Hierárquica de Clusters
Abbreviations
BMU Best Matching Unit
CLTV Customer Life Time Value
CRM Customer Relationship Management
DTC Direct to Consumer Advertising
ERP Enterprise Resourse Planing
HMO Health Maintainance Organization
IMS International Marketing Services
PAF Principal Axis Factoring
PCF Principal Components Factoring
PhRMA Pharmaceutical Research and Manufacturers of America
qe Average quantization error
SFA Sales Force Automation
SOM Self- Organizing Map
te Topographic error
U-Matrix Unified Matrix
Table of contents
1. INTRODUCTION... 1
1.1. Context... 1
1.2. Motivation... 2
1.3. Objectives ... 3
1.4. Structure of the dissertation ... 4
2. LITERATURE ANALYSIS... 5
2.1. CURRENT PHARMACEUTICAL ENVIRONMENT... 7
2.1.1 Characteristics of the United States of America Pharmaceutical Market... 7
2.1.2 Characteristics of the European Pharmaceutical Market... 7
2.1.3 Direct-To-Consumer advertising United States of America versus Europe and the changing dynamics of promoting pharmaceutical drugs ... 8
2.2. ANALYSIS OF THE CURRENT CRM PROGRAMS IN THE PHARMACEUTICAL INDUSTRY. ... 11
2.2.1 General Overview of CRM Programs in the Pharmaceutical Industry ... 11
2.2.2 Sales Force Automation Systems in Pharmaceutical Industry ... 14
2.2.3 CRM Programs focusing in online strategies and communication technologies ... 19
2.2.4 CRM focusing in Supply Chain and Demand Management Integration ... 22
2.2.5 Differences between the current CRM programs in Europe and United States ... 23
3. METHODOLOGY... 25
3.1 BUSINESS PURPOSE OF APPLIYING MULTIVARIATE TECHNIQUES IN PHARMACEUTICAL CRM... 25
3.2 DESCRIPTION OF THE CRM DATA FILE USED. ... 26
3.3 FACTOR ANALYSIS ... 28
3.3.1 Factor Model ... 28
3.3.2 Factor Indeterminacy... 30
3.3.3 Factor Rotations... 31
3.3.4 Data Matrix... 37
3.3.5 Factor Extraction Methods ... 37
3.3.6 Methods to evaluate if data is appropriate for factor analysis ... 40
3.3.7 Determining the number of factors... 41
3.3.8 Factor Solution Quality ... 44
3.3.9 Factor Scores ... 45
3.3.10 Factor Analysis versus Principal Components Analysis ... 46
3.3.11 Exploratory versus Confirmatory Factor Analysis ... 47
3.4.1 Introduction ... 48
3.4.2 Agglomerative Methods ... 48
3.4.3 Distance Measures... 51
3.4.4 Techniques to decide the number of Clusters... 56
3.4.5 Assess Reliability and Validity... 58
3.5 SELF-ORGANIZING MAPS ... 61
3.5.1 Introduction ... 61
3.5.2 Basic SOM Learning Algorithm: ... 63
3.5.3 Neighbourhood Functions ... 63
3.5.4 U- Matrix ... 64
3.5.5 Component Planes ... 65
3.5.6 SOM Quality ... 65
3.5.7 Market Segmentation using Self- Organizing Maps ... 66
3.5.8 SOM Implementation in MATLAB ... 67
4. RESULTS ... 70
4.1. DESCRIPTIVE REPORTING... 70
4.2. CHARACTERIZATION OF THE RELATIONSHIP BETWEEN BUSINESS ATTRIBUTES. ... 75
4.3 CUSTOMER SEGMENTATION... 91
5. CONCLUSIONS AND FUTURE DEVELOPMENTS ... 110
6. REFERENCES... 115
APPENDIX A ... 118
APPENDIX B ... 131
APPENDIX C ... 138
List of tables
Table 1- Overview of the regional market differences between Europe and United States (CGEY &
Young and INSEAD 2002) ...10
Table 2- CRM dataset variables measured in 2004. ...27
Table 3- KMO measure of appropriateness for factor analysis ...41
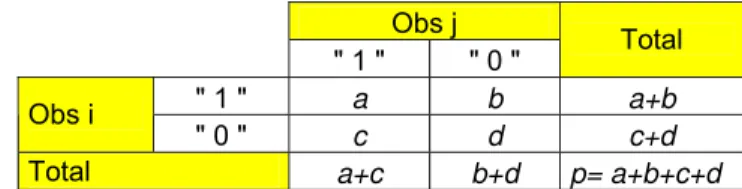
Table 4- Crosstabs with the values used for the association measures...52
Table 5- SOM parameters in SOM toolbox in MATLAB (Vesanto et al. 2000) ...67
Table 6- Descriptive statistics per variable per region ...71
Table 7- Correlation Matrix of the variables in analysis ...74
Table 8- Factor Analysis KMO and Bartlett’s Test for all the observations...76
Table 9- Factor Analysis KMO and Bartlett’s Test excluding outliers...76
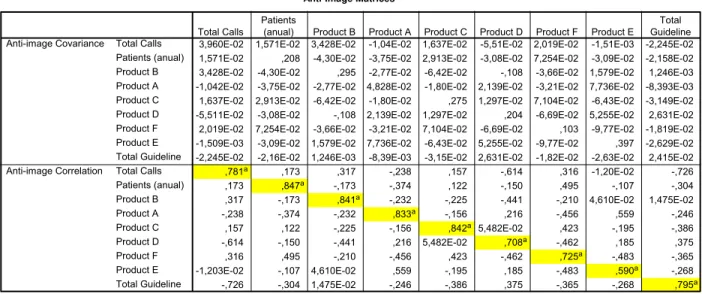
Table 10- PCF Factor Analysis Anti- image Matrices for all the observations...77
Table 11 - PCF Factor Analysis Anti- image Matrices for all the observations...77
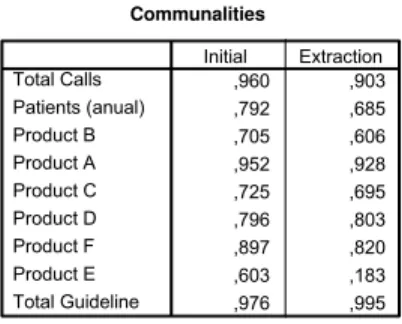
Table 12 - Factor analysis Communalities for PCF two factors extraction method...79
Table 13- PCF Factor Analysis Eigenvalues for two factor extraction ...79
Table 14- PCF Factor Matrix for two factor extraction ...80
Table 15- PCF Varimax Rotation Factor Matrix- two factor extraction...81
Table 16- PCF Reproduced and Residual Correlation Matrices for two factors extraction...81
Table 17- Factor analysis Communalities for PCF three factors extraction method ...82
Table 18- PCF Factor Analysis Eigenvalues for three factor extraction ...82
Table 19- PCF Factor Matrix for three factor extraction...83
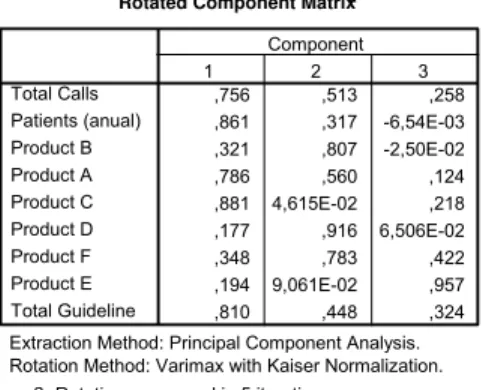
Table 20- PCF Varimax Rotation Factor Matrix for three factor extraction ...83
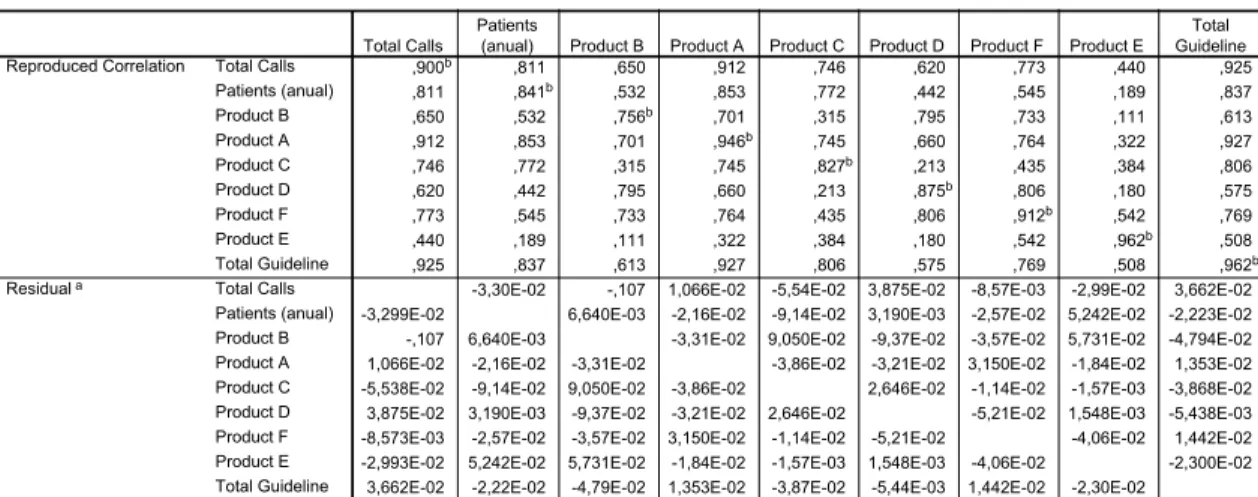
Table 21-PCF Reproduced and Residual Correlation Matrices for three factors extraction ...84
Table 22- Factor analysis Communalities for PAF two factors extraction method...85
Table 23- Factor analysis Communalities for PAF two factors extraction method...85
Table 24- PAF Factor Matrix for two factor extraction ...85
Table 25-PAF Varimax Rotation Factor Matrix- two factor extraction...86
Table 26-PAF Reproduced and Residual Correlation Matrices for two factors extraction...86
Table 27- Factor analysis Communalities for PAF two factors extraction method...87
Table 28- PAF Factor Analysis Eigenvalues for three factor extraction ...87
Table 29- PAF Factor Matrix for three factor extraction...87
Table 30- PAF Varimax Rotation Factor Matrix for three factor extraction ...88
Table 31- PAF Reproduced and Residual Correlation Matrices for three factors extraction ...88
Table 32- RMSR calculated for the different methods. ...89
Table 33- Factor labels and comments...89
Table 34- Dendogram solutions for the entire data set using the five clustering methods ...92
Table 35- Values for the last cluster solutions using the Mojena criteria ...93
Table 36- Custer solutions obtained according to the selection technique and the clustering method ...93
Table 37- Cluster solutions using the different clustering methods...94
Table 38- Characteristics of the top 6 hospitals ...94
Table 39- Cophenetic Correlation Coeficients for the 5 different clustering methods...95
Table 40- Dendogram solutions for the data set without outliers using the five clustering methods 96 Table 41- Values for the last cluster solutions without outliers using the Mojena criteria...97
Table 42- Custer solutions obtained according to the selection technique and the clustering method used excluding the outliers ...98
Table 43- Cluster solutions using the different clustering methods without using the outliers ...98
Table 44- Dashboard for the 5 cluster solution with ward method including all observations...99
Table 45- Dashboard for the 5 cluster solution with ward method excluding the outliers ...100
Table 46- Dashboard for the 5 cluster solution with ward method excluding the outliers ...101
Table 47- Average quantization (qe) and topological errors (te) obtained. ...105
Table 48- Dashboard with the SOM clustering solution ...106
Table 49- Dashboard with the SOM clustering solution with churners...107
List of figures
Figure 1-The changing network of prescribing influence makers ...9
Figure 2- Traditional push promotional channels in Pharmaceutical Industry ...14
Figure 3- Projection of vectors onto a two-dimentional space in a orthogonal factor model ...32
Figure 4- Oblique factor model-pattern loading...36
Figure 5- Oblique factor model- structure loading...36
Figure 6- Oblique factor model-pattern and structure loadings...37
Figure 7- Cattell's scree test example ...42
Figure 8- Linkage methods; (a) single linkage; (b) complete linkage; average linkage adapted from (Branco 2004)...49
Figure 9- Dendogram for hypothetical data ...56
Figure 10- U-matrix ...65
Figure 11- Component planes...65
Figure 12- Map lattice and discrete neighbourhoods of the centremost unit. a) hexagonal lattice, b) rectangular lattice. The innermost polygon corresponds to 0 neighbourhood, the second to 1 neighbourhood and the biggest to 2 neighbourhood. Adapted from (Vesanto et al. 2000)...68
Figure 13- Example of training of a SOM in a 2D input space. Note that the initial positions (in black) of the BMU and its neighbouring units are updated (in grey) according to the data patter (cross) presented to the SOM. Adapted from (Vesanto et al. 2000) ...68
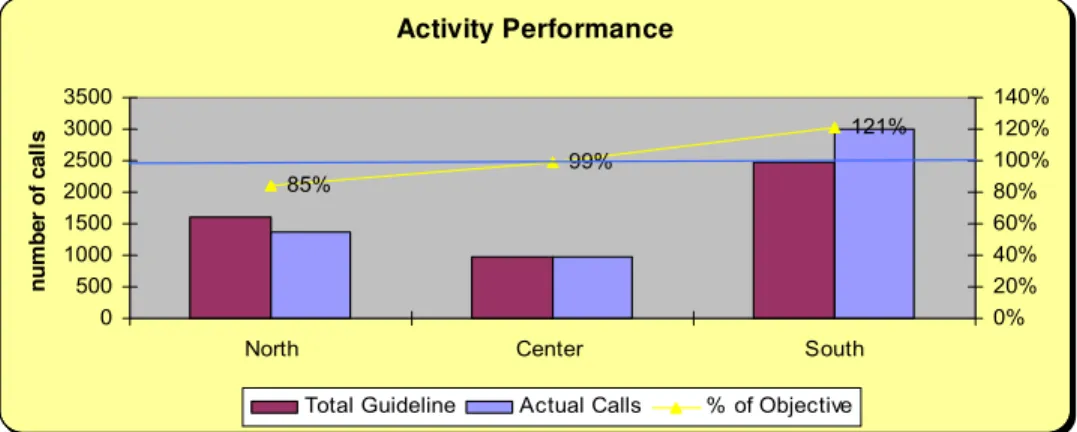
Figure 14- Activity performance...72
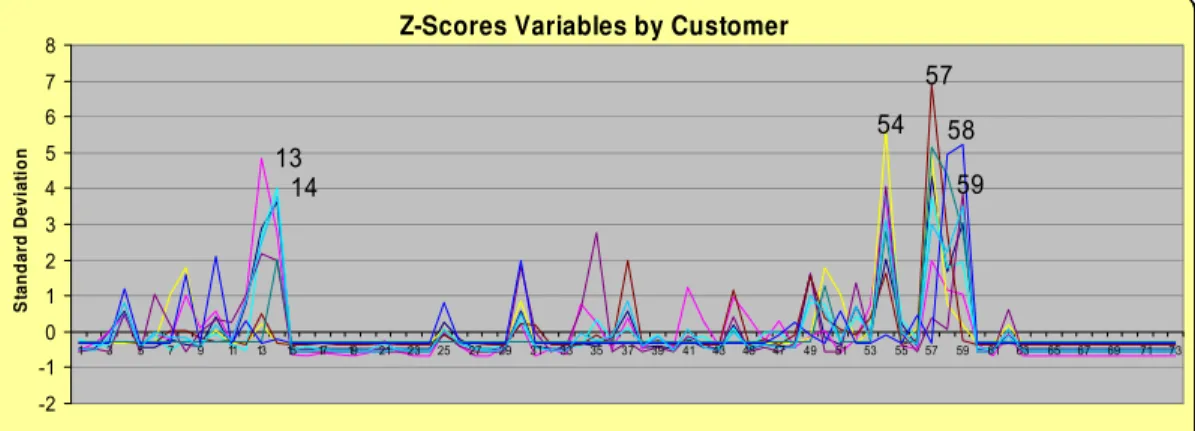
Figure 15- Z-Scores per variable per customer...73
Figure 16- Factor analysis scree plot ...78
Figure 17- Factor analysis Parallel analysis ...78
Figure 18-Agglomeration coefficient graphs for the 5 clustering methods...92
Figure 19- Agglomeration coefficient graphs for the 5 clustering methods without outliers ...97
Figure 20- Component planes for the original variables...103
Figure 21- U-matrix with neurons labelled...104
Figure 22- U-matrix with the hits and clusters pointed out. Small distances are represented at blue while large are at red ...104
Figure 23- SOM component planes ...105
1. INTRODUCTION
______________________________________________________________________
1.1. Context
IMS, the world biggest supplier of pharmaceutical drug sales information, estimates that the
total value of the pharmaceutical market reached more than 560 thousand of millions US dollars in 2006 (IMS 2007), making the pharmaceutical industry one of the most important businesses
in the world.
There are two types of medicines, the ethical drugs (prescribed by the physician) and the over
the counter drugs (OTCs) that are sold without the need of a medical prescription. In the OTCs, the pharmaceutical industry can advertise directly to the patient, in the case of the ethical drugs,
only the healthcare professionals can receive promotion and scientific information in the
European Union.
In the USA it is possible to promote the ethical drugs directly to the patient, but like in Europe,
these drugs are prescribed by the physician, and for that reason the physician is the main target
of the pharmaceutical companies. The OTCs represent less than 10% of the total global market,
being the ethical drugs the main slice of the market. The ethical drugs can be divided in drugs
that are sold in Retail Pharmacies or in Hospitals.
With very restricted rules of advertising and promotion, and with the power of decision, mainly
centralized in the physicians, the pharmaceutical industry never developed advanced models of
market analysis (Carpenter 2006), like the other markets (ex: mass market, banking, insurance companies, automobile industry, telecommunications, etc).
Nevertheless times are changing, patients have more access to information mainly trough
internet, and also with the cost containment measures that many European countries are
applying, including Portugal, the physicians are no longer the sole decision makers in the process of prescription. The health authorities are pushing the generics into the market,
advertising them to the consumers, and allowing the pharmacists to replace under certain
conditions a brand ethical drug for a generic. In Hospitals the board of directors are also pushing
physicians, to achieve their sales goals. Now with the new stakeholders both in the retail and hospital market, the reality is becoming more complex to be managed by the pharmaceutical
companies.
This thesis will focus in Customer Relationship Management in Pharmaceutical Industry.
Usually when looking to the Market, the pharmaceutical companies divide their clients in three different types:
1. The hospitals or other institutions that buy pharmaceutical drugs.
2. The health professionals.
3. The patients (mainly in the USA).
The Pharmaceutical companies, very often segment the Hospitals using bivariate matrix’s (like
ABC type matrix), and the health professionals in targeted professionals and non-targeted
professionals. The target professionals are also usually ranked (ex: ABC) by prescribing or influence to prescribe importance of a certain drug (Lerer and Piper 2003). Other external
influencers are gaining growing importance such as the Health Authorities or any other private
insurance institution (particularly in the United States) that are responsible for the
reimbursement of drugs, because very often it is required their approval before a drug can enter in the market (Datamonitor 2006).
1.2. Motivation
The reason for the choice of the thesis topic, it is related to the fact that is starting to be an important debate in the pharmaceutical industry, the need to have more sophisticated analysis
that can increase the efficiency of both marketing strategies and sales force activity in the field.
It was one of the main topics of the last European Sales Force Effectiveness Summit that took
place in Barcelona during March 2006.
Many pharmaceutical companies invested large amount of money in implementing Customer
Relationship Management (CRM) Tools. These systems should help pharmaceutical companies to deal with the increase complexity of the market, providing segmentations of their clients
based on their customer profiles, but research from international analysts suggests that, across
all pharmaceutical industries, as much as 80 per cent of current CRM programmes will fail to
deliver satisfactory returns for the companies that have bough into them (Carpenter 2006). We can easily conclude that there is a lot to be done in terms of CRM and market analysis in the
Most of the European pharmaceutical companies are using their CRM systems as Sales Force
Automation Tools (SFA) producing basic reports, using only descriptive statistics (Carpenter
2006; Lerer and Piper 2003). Still in the Pharmaceutical Industry the product focus strategy is
predominant versus the customer centric approach (Lerer and Piper 2003). Is still common in
the pharmaceutical industry to have sales forces promoting only one product, but considering that the estimated average cost of a sales representative visit to a physician in Europe is 150
Euros (Lerer and Piper 2003), and with the strong cost-containment governmental measures in
Europe concerning pharmaceutical drugs, the high margins in the pharmaceutical industry are
going down, so that approach will not be feasible in the future (Lerer and Piper 2003). Currently the pharmaceutical industries are trying to find ways to save money and improve their
operational effectiveness in order to try to protect their margins. CRM in the pharmaceutical
industry should help pharmaceutical industry to improve their sales and marketing effectiveness
by accessing and enabling synergies between the existing drugs in the promotional effort (factor
analysis technique could be used for this purpose), and by developing customer segmentations (using clustering techniques) that use all the critical business variables to segment the customers
not only by their value (current standard in pharmaceutical industry) but also by their specific
characteristics. A dataset from a CRM system from a Pharmaceutical Company operating in the
Portuguese hospital market is available to conduct the analysis mentioned above. The lack of studies using multivariate statistical techniques in pharmaceutical CRM, when simple
descriptive statistics seem to be insufficient to provide the best business direction in a market
that must study more deeply the combined interaction of the business attributes to get a higher
sales and marketing efficiency is also an extra motivation for this thesis.
1.3. Objectives
The aim of this study is:
1. Do an analysis of the current CRM systems in the Pharmaceutical Industry, the way the pharmaceutical companies developed them, and make a comparison between Europe
and United States.
2 Evaluate if exists or not relationships between the different business attributes (related
to the pharmaceutical business) in order to improve sales and marketing effectiveness of the company by evaluating synergies and patterns established between the products and
the other business attributes in order to give strategic marketing insights and also to
3 Provide customer segmentation that promotes synergies between business attributes and enables alignment between sales and marketing strategies.
It will be our aim to find relationships between the business variables in the company CRM
dataset (product sales per hospital; sales representatives activities per hospital; number of
chemotherapy patients treated per hospital) in order to give evidence to the marketing department which variables correlate together and can help driving the sales of the different
products, and also to deploy multi-product sales force that will promote products that share
common business characteristics, factor analysis will be used to help achieving these objectives.
Secondly we will segment company customers (Hospitals) not only by value but also by their overall characteristics by using multivariate clustering techniques. Our analysis focus in the
European perspective of CRM, where CRM strategies where mainly developed around SFA
tools, with a specific focus in the Oncology Portuguese Hospital Market.
1.4. Structure of the dissertation
The structure of the dissertation is organized as follows. The introduction (Chapter 1) presents
the context, the goals and the purpose of the study and summarizes the structure of the
dissertation.
In Chapter 2 an analysis of the pharmaceutical market with an emphasis in United States and
Europe, together with a detailed analysis of the Customer Relationship Management in the
pharmaceutical industry, making a comparison between Europe and United States, is done.
In Chapter 3, the business purposeof applying multivariate techniques in pharmaceutical CRM
is described together with the description of the dataset used in our thesis. Also theoretical
concepts of exploratory multivariate techniques, specifically Factor Analysis and Clustering
techniques are described.
In Chapter 4, Factor Analysis and Clustering techniques are applied to real pharmaceutical
CRM data and the results and findings are discussed. The multivariate statistical techniques are
used according with the business needs and a comparison of hierarchical clustering methods with Self-Organizing Maps is performed. In this chapter is also shown how the type of data used
can influence the decisions regarding the different multivariate statistical methods applied.
2.
LITERATURE ANALYSIS
______________________________________________________________________
The total value of the pharmaceutical market reached more than 560 thousand of millions US
dollars in 2006 (IMS 2007), making the pharmaceutical industry one of the most important businesses in the world.
Being a business area with a large financial capacity, many pharmaceutical companies invested
large amount of money in implementing Customer Relationship Management (CRM) Tools. These systems should help pharmaceutical companies to deal with the increase complexity of
the market, providing segmentations of their clients based on their customer profiles, but in fact
most of the CRM programs implemented failed to deliver satisfactory returns for the companies
that have bough into them (Carpenter 2006). It is rumoured that one major pharmaceutical
company spent 200 million dollars on a CRM system that was never launched because it failed to meet expectations (Lerer and Piper 2003).
Although other methods are also used to promote drugs, notably events, symposia and medical
journal advertising, sales force detailing remains the dominant approach, consuming over 70 per cent of marketing budgets, so it was expected that the CRM programs could help
pharmaceutical companies to gain efficiencies in the sales force in order to reduce costs in an
area with a big impact in the overall pharmaceutical companies budgets, but weak analytics
applied to CRM-SFA systems did not enabled their correct usage neither to gain efficiency or to
improve customer segmentation (Lerer and Piper 2003).
One of the big issues in the pharmaceutical marketing it is the product focus approach that it is
still dominant versus the customer centric approach that it is critical for the successes of a CRM
program. Together with the excessive product focus approach it is the use of basic and poor segmentations (bivariate segmentations) that are an obstacle to the pharmaceutical companies
knowledge of their customers. Others industries, like for example consumer goods use tools, to
collect information about the consumers and use more complex analysis to get a deeper
understanding about their needs (Lerer 2002). Pharmaceutical industry should adapt the best
Understanding customer’s needs is essential to maintain their loyalty and also to increase their
value by giving them the products or services that will satisfy them (Kotler and Keller 2007).
Pharmaceutical companies should maximize the synergies between the products in their
portfolio (Lerer and Piper 2003).
Currently a good customer segmentation should identify not only the high value customers but
segment them by their characteristics (Pepers and Rogers 2006), identify the midsize customers,
because usually they demand good service in a reasonable way, pay nearly full price, and are
often the most profitable and identify the low value customers, specifically the ones that the company should not invest promotional effort (Kotler and Keller 2007). In the current hospital
market that is the source of our pharmaceutical company dataset, pharmaceutical companies are
facing tender negotiations per hospital resulting from the current governmental
cost-containment pressures what is changing the hospital market to a type of market similar to other
industries like the consumer goods (Garrat 2006; Lerer and Piper 2003), and if the segmentation above applies very well to the consumer goods industry it should also make sense to apply to
the pharmaceutical market.
The pharmaceutical market is a highly regulated area where two big markets have a dominant position in the world, the European and the United States markets. The way the pharmaceutical
market is structured the current changes in the pharmaceutical market, and the differences
between the European and the United States markets are subject to further analysis ahead in the
literature review. Subsequently to the analysis of the pharmaceutical environment, an analysis of
the current CRM programs is done and the differences between the current CRM programs in Europe and United States are also analysed taking in consideration how the differences between
the two markets could have influenced the development of the CRM programs. Overall the
literature review plays a key role in this thesis and it will be fundamental to accomplish the first
2.1. CURRENT PHARMACEUTICAL ENVIRONMENT
______________________________________________________________________
2.1.1 Characteristics of the United States of America Pharmaceutical Market
In 2006, the North American market (United States and Canada, but with more than 93 per cent
of the sales coming from USA) was dominating, representing 47 percent of worldwide drug
revenues (266 thousand of millions dollars), followed by Europe with 30 percent and Japan with 11 percent (IMS 2007). American pharmaceutical companies focus on core competencies and
are today called “life science companies”. Supported by high revenues, they are leaders in the
development and commercialization of innovative therapy approaches. The relative position of
the United States as a place of innovation has increased over the past decade. During the past few decades, investment in R&D has continued to grow in the United States. Accompanying
this increased investment is a doubling of the number of drugs in clinical or later development,
from more than 1300 in 1997 to more than 2700 in 2005. In the United States the drug pipeline
growth contrasts with trends in Europe, where rigid government policies have discouraged
continued pharmaceutical discovery (PhRMA 2006).
Price competition is very strong in this liberal environment. However, due to pressure applied
by the Health Maintenance Organizations (HMOs) Pharmaceutical Benefit Managers (PMB) on
the reduction of drug prices, prices have remained fairly stable since the mid-1990s (Schulman et al 1996). The U.S. pharmaceutical market is characterized by an uptake of new products
relying on price premium and marketing access; generics and therapeutic substitution (the use of
generics by physicians is encouraged by HMOs); an expansion of access and usage; and an
emerging parallel trade (Lerer and Piper 2003).
2.1.2 Characteristics of the European Pharmaceutical Market
Europe’s pharmaceutical market share represented 30 percent of the total world market in 2006
(IMS 2007), accounting for 169 thousand of millions dollars. Europe is composed of countries with different health care systems, and different laws for controlling pharmaceutical production,
logistic, distribution and sales.
There are five big markets in Europe, Germany and France represent about half of the European market together with Italy, Spain and the United Kingdom they represent 75 percent of the
There is an intensified cost-containment policy in Europe and the pharmaceutical industry is a target for savings. This leads to an active encouragement of generics and restrictions in
reimbursement of new drugs. The medical drug prices differ due to the different approaches
used by the E.U. member states for regulating pharmaceutical prices. The cheapest medicines
are found in the poorer countries such as Portugal and Greece. The prices in the Netherlands,
Denmark, Ireland, the United Kingdom and Belgium are the highest (Garratt 2006; Lerer and Piper 2003).
2.1.3 Direct-To-Consumer advertising United States of America versus Europe and the changing dynamics of promoting pharmaceutical drugs
Most probably the biggest difference between Europe and the United States in the area of
promoting drugs is the fact that the United States allows advertising of prescription drugs to the
public.
In the United States pharmaceutical companies have been aggressively targeting consumers since 1997 when pharmaceutical advertising regulations were relaxed. Since then United States
pharmaceutical companies spent huge amounts of money in direct-to-consumer (DTC)
advertising, in the year 2000 an estimated 2300 million dollars was spent on DTC advertising
(Lerer and Piper 2003).
Contrary to some reports in 2001, the European Union maintained the ban on DTC advertising.
Instead, European Union commissioners debated a provision allowing pharmaceutical
companies to provide the patients with non promotional data about prescription drugs for specific chronic diseases (Lerer and Piper 2003). For example in Portugal the pharmaceutical
industry is allowed to give drug information to a patient if requested specifically by the patient.
Both in Europe and United States, the sales reps are finding harder than ever to gain access to
physicians to detail drugs. Some countries like France and Portugal are also imposing
governmental measures to limit the access of sales reps (sales representatives) to physicians
(Datamonitor 2006). Because of these difficulties, pharmaceutical companies have been exploiting new marketing channels to reach the health professionals like the Internet and the
E-Learning (Datamonitor 2006; Lerer and Piper 2003).
While physicians remain an important target for promoting activities the growing influence of
other stakeholders, such as nurses, pharmacists and patients is having impact on prescribing
the United States) that are responsible for the reimbursement of drugs are important targets for the pharmaceutical companies (Datamonitor 2006).
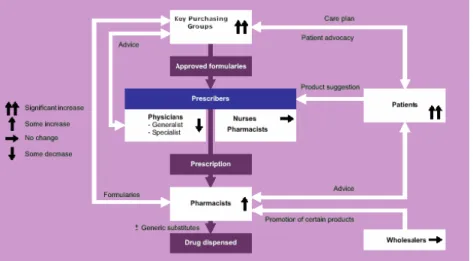
Figure 1-The changing network of prescribing influence makers
The diagram above explains very well how the different stakeholders influence the prescription process, and how their influence in the process is being changed by the current environment.
The physicians are currently losing influence in the process because the key purchasing groups
(hospitals, insurers, governments, HMOs), both in Europe and United States are tightening
cost-containment policies by using restricted formularies, encouraging generic substitution and
limiting reimbursement, limiting the options available for the physician to prescribe. In the United States and United Kingdom is possible to other health professionals, like nurses and
pharmacists with complementary training to prescribe certain pharmaceutical drugs
(Datamonitor 2006), but specifically the pharmacists are growing their influence because many
European Governments are allowing direct substitution by a generic in a pharmacy by a pharmacist when a brand drug loses patent and a generic is already available (Redwood 2007).
The patients influence as grown a lot in the last years, patients are now searching information
about the quality and safety of the pharmaceutical drugs and influencing the physicians in the
drugs they prescribe (Datamonitor 2006; Lerer and Piper 2003). One recent survey showed that
sales representatives and consumers have similar influencing powers on physicians prescribing
decisions both in United Sates and Europe (Datamonitor 2006). Another survey conducted in the United States revealed that 71 per cent of patients who requested a specific drug were indeed
prescribed that product (Lerer and Piper 2003).
treatment develop by the pharmaceutical company Novartis, can to a great extent be attributed to the activism of leukaemia patients and their families, who demanded that the drug, after
showing near-spectacular efficacy in early clinical trails be made available without delay (Lerer
and Piper 2003). The fact that DTC advertising in Europe is not allowed does not stops
European patients to access Internet and get the same type of information that most of the
United Sates patients receive (Datamonitor 2006; Lerer and Piper 2003).
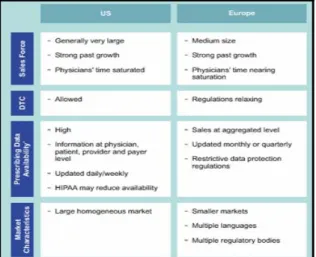
Table 1- Overview of the regional market differences between Europe and United States (CGEY & Young and INSEAD 2002)
The table above resumes most of what as been already mentioned in this study about the characteristics of the United States and European Market. Nevertheless it is important to
emphasis that the physician’s time spent with sales reps, specially the high prescribers, is
saturated in the United Sates and near saturation in Europe, because both in Europe and United
States the pharmaceutical companies increased their sales force size every year in the last decade. The sales forces in South Europe countries are usually bigger in size because the
physicians in Southern European countries are usually more available to interact more often
with the sales representatives from the pharmaceutical companies than their colleges from
Central and North Europe countries (Datamonitor 2006; Lerer and Piper 2003).
Another very important difference between United States and Europe is regarding prescribing
data availability, because in Europe in opposition to United States there are strong privacy laws and the customer sales data is presented at aggregated level, stripped of personal identification
information. But even in United Sates, regulatory authorities are study some measures to control
2.2. ANALYSIS OF THE CURRENT CRM PROGRAMS IN THE
PHARMACEUTICAL INDUSTRY.
______________________________________________________________________
2.2.1 General Overview of CRM Programs in the Pharmaceutical Industry
Customer relationship management is not a new concept in this industry indeed traditionally the
pharmaceutical industry, established with the physicians a close relationship through the
personalized contact made by their sales representatives. Long time relationship between the sales representative and the physician resulted in knowledge about the physician needs by the
sales representative that very often was not shared systematically trough the organization (Lerer
and Piper 2003).
Because of the historical and still current high importance of physicians for the pharmaceutical companies as a key target group together with head offices desire to keep in touch with their
sales forces and understand what was happening in the field, resulted that most of the original
CRM systems evolved out of sales force automation tools in the late 1990s (Carpenter 2006;
Lerer and Piper 2003). The problem is that many of the CRM implementations using sales force automation tools (SFA) were badly implemented and designed (Carpenter 2006; Lerer and Piper
2003; Weinstein and Ramko 2003) and the sales representatives consider them, according to a
2004 study conducted in the United States, only as a mean for head offices to check up on
employees activities, a waste of time entering data, together with little value coming out of the
CRM systems (Carpenter 2006).
A 2001 study revealed that initially, Pharmaceutical companies focused on IT- driven single
point solutions using SFA and Call Center Automation to improve the operational effectiveness
of marketing, sales and customer service, stating the interviewees that these were mainly CRM implementations focusing in SFA applications (CGEY and INSEAD 2002). According to the
same study 57 percent of the executives interviewed expect CRM to grow in the next five years
and 76 percent of the pharmaceutical companies have already made some kind of CRM
investment (CGEY and INSEAD 2002). Showing that from the beginning, CRM investment by the Pharmaceutical Industry was taken seriously.
Nevertheless a 2002 survey found that 71 percent of pharmaceutical companies did not have an
executive in charge of customer relationship management, 75 percent implemented CRM in
implementation and development of CRM systems in the pharmaceutical companies, being the most critical ones (Lerer and Piper 2003; Weinstein and Ramko 2003):
• The lack of a holistic approach together with a non-effective multi-channel strategy.
• Lack or incorrect assessment of ROI.
• Poor integration of data gathered from different sources such as the sales force,
customer information or service centers.
• Corporate culture factors.
A more recent report explains that pharmaceutical companies now employ one or more CRM executives, but on the other hand many executives with CRM title come from the IT
environment and do not always embrace the idea of CRM as the wider philosophy of effective
customer relations (Carpenter 2006). Also more recent studies and reports from the
pharmaceutical companies reveal a bigger effort to try to implement multi-channel strategies in
their CRM systems and development of more sophisticated CRM programs (Bard 2007; Carpenter 2006; Eyeforpharma 2006).
One of the big issues in the pharmaceutical marketing it is the product focus approach that it is
still dominant versus the customer centric approach that it is critical for the successes of a CRM
program (Lerer 2002).
Currently pharmaceutical companies concentrate their CRM programs in two target groups
physicians and patients, but most of them don’t consider both target groups together when
implementing a CRM program (Datamonitor 2006; Weinstein and Ramko 2003).
One of the problems when analysing CRM in the pharmaceutical market reported recently by the Gartner Group is the fact that few case studies have been written about CRM in
pharmaceutical companies when compared with others sectors (Thompson 2005). The
pharmaceutical industry is often reluctant in giving detailed information about their commercial
strategies including CRM programs, most probably because the pharmaceutical market is highly regulated and the pharmaceutical companies tend to protect themselves. So when a
pharmaceutical company talks about a specific CRM program is possible that sometimes they
are not revealing all the information.
In one study 78% of the companies describe themselves as having basic segmentation models (CGEY and INSEAD 2002), recent reports and case studies presented by the pharmaceutical
segmentation models or any type of data mining techniques in their CRM databases, but some of them are already using OLAP cubes to make analysis in their CRM databases (Bard 2007;
Carpenter 2006; Eyeforpharma 2006).
In contrast to operational CRM, analytical CRM is still very poorly used by pharmaceutical
companies. Very often pharmaceutical companies try to collect large amounts of data through their sales representatives that generate inaccurate final outputs, by the initially bad data quality,
weak statistical models used, or both (Lerer and Piper 2003).
The use of interactive web-sites targeting both health professionals and patients and the use of direct to consumer advertising in the United States made possible the use of collaborative CRM
programs in the pharmaceutical industry, being more developed in the United States than in
Europe (Bard 2007; Carpenter 2006; Lerer and Piper 2003).
Analytical CRM compared with operational (most widely used in pharmaceutical companies) and collaborative CRM is the less developed of all in the pharmaceutical industry. One of the
big problems is that in pharmaceutical industry, CRM is not regarded as a market research tool
and the non-involvement of market research departments in the CRM projects leads to a loss of
analytical potential for the CRM programs (CGEY and INSEAD 2002).
These systems should help pharmaceutical companies to deal with the increase complexity of
the market, providing segmentations of their clients based on their customer profiles, but
research from international analysts suggests that, across all pharmaceutical industries, as much
as 80 per cent of current CRM programmes will fail to deliver satisfactory returns for the companies that have bough into them (Carpenter 2006).
In terms of the strategic focus of implementing CRM, the pharmaceutical companies try to
focus in one or more of the three following groups, but initially the usually try to develop only one (Lerer and Piper 2003):
• Sales Force Automation Systems.
• Online strategies and communication technologies: Focusing in health professionals and
patients.
2.2.2 Sales Force Automation Systems in Pharmaceutical Industry
The traditional overarching pharmaceutical marketing model is one of push, where the company
uses salespeople to influence physicians, pharmacists and key purchasing groups to prescribe,
stock or buy the product (Lerer and Piper 2003). In the current reality the salespeople continue to be key drivers of sales, but the traditional sales representatives have been developing more
competences, and now exists sales representatives for physicians that are generalists or
specialists. Today the pharmaceutical industry is using account management teams with much
more relevance than in the past to ensure that the company pharmaceutical drugs are on the healthcare provider’s formulary.
Opinion Leader Management
Sales Representative
Account Manager
Physician
Pharmacist
Hospital
Opinion Leader
Journal advertising.
events
Consumer advertisingDTC
Sales Representative
Account Manager
Physician
Pharmacist
Hospital
Opinion Leader
Journal advertising.
events
Consumer advertisingDTC
Sales Functions
Marketing Functions
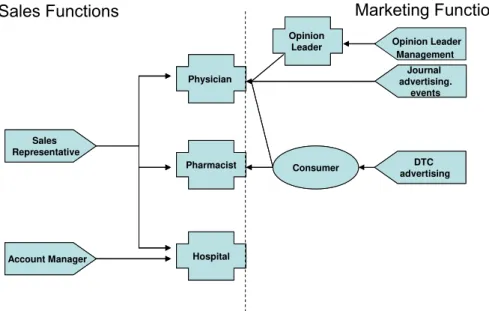
Figure 2- Traditional push promotional channels in Pharmaceutical Industry
Basically a push strategy is when we approach a customer and a pull strategy is when we give
the customer a reason to approach us. Only recently with the use of digital technology such as
interactive websites and emails, the pharmaceutical companies started using pull promotional channels and not only the traditional push promotional channels that are explained in figure 2.
Also important to understand is the term detailing, that is generally used to describe the sales
representative drug promotion process (Lerer and Piper 2003).
There are approximately 225.000 pharmaceutical sales representatives worldwide, in the United
States sales forces nearly doubled in size between 1996 and 2001, but the number of detailing
visits to physicians rose by only 15 per cent, as physicians time with sales representatives is
dominant approach, consuming 70 per cent of marketing budgets, which costs about 150 € per sales representative visit (Lerer and Piper 2003).
Pharmaceutical companies aim to build sustainable partnership with target physicians, but this
must be achieved at the lowest possible cost, as margin pressure increases, companies are faced
with difficult resources allocation choices such as between putting more resources into gaining market share in the highly competitive segment of high-prescribing physicians or developing
new market opportunities. The SFA systems are seen by the pharmaceutical companies as a
mean to improve the sales force effectiveness by helping the companies to determine the right
size for their sales force, targeting the key customers and get information from the field, all of these at the lowest possible cost (Carpenter 2006; Lerer and Piper 2003). Looking to the high
costs of the sales forces in the pharmaceutical companies is easy to understand why in the late
1990s most of the original CRM systems in the pharmaceutical were focused in SFA tools.
The first SFA systems focused in the traditional push promotional systems exclusively in the interaction of the sales functions with there clients (hospitals, pharmacists, physicians). The
initial SFA systems didn’t have any connection with the activities of the marketing functions
and there was no possibility of interaction and share of information between the push
promotional channels related to the sales functions and marketing functions (Carpenter 2006; Lerer and Piper 2003).
The SFA are seen by the Pharmaceutical companies as the right mean to direct the sales forces
to the key customers and check the sales force performance. Pharmaceutical companies segment
their customers specially the physicians by their prescribing potential, these information can be supplied at physician level in the United States by external vendors, but in Europe because of
legal restrictions the information is provided at territory level. In Europe because of the
restrictions the pharmaceutical companies rely on the sales representatives and their sales
managers to identify the physician’s high prescribers in their territories, and update the information in the physician’s database in the SFA systems (Lerer and Piper 2003).
Another important use for the SFA systems is helping determine the size of the sales forces in
terms of sales representatives. Pharmaceutical companies usually buy an external database from
an external vendor with all the physician audience, if it is in the United States they might get
information about the number of prescriptions per physician but in Europe they will have to rely
prescribers and then hire the rest of the team according to the company needs (CGEY 2002; Lerer and Piper 2003).
Pharmaceutical companies usually use a basic segmentation model based on prescribing
physician potential to focus their sales representatives effort (Dolgin 2007) and determine the
sales force size use the following formula (Dolgin 2007; Kotler and Keller 2007):
∑
=
×
=
ni
Ci
Vi
K
N
1
1
N- Number of Sales Representatives;
Vi- Number of visits needed per time period, per segment;
Ci- Number of customers per segment;
K- Total number of calls that a sales representative can do in a certain time period;
It is essential to know how many visits or calls (usual name for a visit in the Pharmaceutical
Industry) are required per physician in each segment in a certain time period, and this information can be obtained by the pharmaceutical company by external market research
studies, conducting analysis of internal data collected over time or using empirical assumptions.
Also important it is to know the number of calls that a sales representative can do in a certain
time period, this number is usually calculated taking in account the audience size, the geographic dimension of territory and the average detailing time (Dolgin 2007).
The first step is to define the physicians that are possible prescribers of the product or products
promoted by the sales force and will be targets (usually this is defined by the physician
speciality), and define the ones that are non-targets and will not be visited by the sales
representatives of that specific sales force.
The target physicians are usually segmented in high prescribers (segment A), medium
prescribers (segment B) and low prescribers (segment C), and each segment usually have a
reference value of average calls per physician to be accomplished. Another important metric that is usually monitored by the SFA systems is the total coverage of the sales representative
audience and the coverage per segment (Morgan 2005). The objective is to have the highest
coverage and average frequency calls in the high prescribers (Dolgin 2007; Morgan 2005).
Particularly in Europe where the information at physician level is not available from external
prescribing potential, giving guidance to the sales representatives about how the range of estimated prescriptions per month a sales representative should consider in order to classify a
physician in segment A, B or C in the company SFA system (Morgan 2005). The information is
usually updated periodically in the system, together with the targets for the number of calls and
coverage for the physicians in each segment (Dolgin 2007). This very simplistic segmentation
approach is the most commonly used by the pharmaceutical companies in their SFA systems (CGEY 2002; Lerer and Piper 2003; Morgan 2005).
Generic pharmaceutical companies are also actively targeting pharmacists because in some
European countries they have the power to substitute brand drugs by generics when the generic is available and because of this fact they have their SFA systems adapted also to target
pharmacists. Not only generic companies, but also pharmaceutical companies with OTC drugs
consider the pharmacist a key element, in this case because this type of pharmaceutical drugs
don’t require a medical prescription and the patient very often asks for advice to the pharmacist
(CGEY and INSEAD 2002).
The initial SFA systems were regarded by the salespeople as a mean more for management
information, entering data, command and control, than to aid the sales people in the field (Lerer
and Piper 2003).
More recent SFA systems are focusing in getting not only information in what the physicians
prescribe, but why they prescribe. Again the sales force is regarded as a very important source
of customer behavioural data in order to produce needs based segmentation models. The first
problem is that some sales representatives are not willing to share their customers in depth knowledge built up over the years because they are afraid of losing power inside of the
organization (Lerer and Piper 2003). Another frequent problem is that the pharmaceutical
companies ask the sales representatives to enter data in the SFA systems about values,
behaviours and attitudes of physicians but at a certain point they struggle with large amounts of data that is collected without clear rationale or strategy that produce a final output that is often
opaque and tenuous (CGEY and INSEAD 2002; Lerer and Piper 2003).
A basic classification of the data collected and incorporated in the CRM SFA systems and other
CRM components in today pharmaceutical environments is commonly accepted as (CGEY and INSEAD 2002; Lerer and Piper 2003):
• Descriptive data: databases of customers including demographics, prescription behavior
• Activity data: sales calls, samples and promotional items, meetings and corporate events
invitations, requests for information and so on. This can be divided into activities of
various parties such as the sales representatives, physician and even the consumer.
• Sales data: this can be divided into company-generated (direct sales) or secondary
(external vendor like IMS) data.
• Profiling data: data specifically collected and used for segmentation purposes, it can be
for example, needs based data or behavior data collected directly from the SFA systems, or through new channels like interactive web sites.
Even if the more recent CRM SFA systems generally have not been able to produce meaningful
physician’s needs-based segmentation models, they are incorporating more user-friendly
interfaces, and are linking the SFA systems to receive data from other functions such as
customer service or marketing, making the relationship between the sales representative and the
SFA system more interactive and productive (Carpenter 2006; Lerer and Piper 2003).
Many of the current CRM SFA systems are using new technologies to improve the effectiveness
of the sales rep work. The initial CRM systems required that every day the sales representative
had to update and connect through their computer at home all the information related to the customer interaction during the day. Many of the current SFA systems offer the pharmaceutical
companies PDAs and Wireless PDAs with specific SFA software that can be used by the sales
representatives in the field to update directly the last call information in the PDA, for example
when they are waiting to be received by another physician (Carpenter 2006; Lerer and Piper
2003). Because only a small amount of sales representatives work time is spent in front of customers, the rest is spent preparing, travelling, sitting in waiting rooms and doing
administrative time, the SFA mobile solutions are very well received by the sales
representatives as way to manage more effectively their time (Lerer and Piper 2003).
Another component that some SFA systems incorporate is an account management tool to be
used by the account managers particularly in the Hospital market (Dolgin 2007). More than the
frequency of calls made, this specific component focus in storing vital information collected by
the account managers about the account, objectives and activities developed by the account managers in the accounts and behaviour information related to the different health professionals
that work in that account, and can influence the purchasing decisions in that specific health
2.2.3 CRM Programs focusing in online strategies and communication technologies
Online activities increasingly represent a diverse range of resources and applications including
websites, email, webcasts and others that are accessible 24 hours a day, seven days a week. The pharmaceutical industry is using the online channel to develop specific CRM programs that
target health professionals or patients. Internet is a relatively inexpensive channel to develop
CRM programs compared to the traditional detailing done by the sales forces, what motivated
pharmaceutical companies to develop web based strategies to communicate with their costumers
(Bard 2007). In the United States where DTC advertising is allowed is frequent to see TV and newspaper ads promoting a certain pharmaceutical drug and directing the consumer to a specific
product or pharmaceutical company website where the consumer can get more information
(Lerer and Piper 2003). This a good example of traditional channels working together with
online channels, that could be very useful to develop a more close relationship between the consumer or patient and the pharmaceutical company (Lerer and Piper 2003).
The internet permits consumers in countries that ban DTC advertising to prescription
pharmaceutical drugs, like in Europe, to visit product websites in the United States and, despite
warnings found on pharmaceutical sites (saying that the information is exclusively for United States citizens), there is little to prevent the free global transfer of consumer oriented
information on prescription drugs, giving to the European consumers the possibility to access
the same type of information about prescription drugs that the United States consumers receive
(Lerer and Piper 2003).
Some clinical trials require tens of thousands of participants and relying on investigators and
other physicians to identify and refer trial subjects is not a highly efficient approach. E-Clinical
trials it is a new process where a company uses Internet to recruit patients and uses web based
technology to establish effective communication between patients, investigators and the pharmaceutical companies that sponsor the trial. This is a highly regulated area in terms of data
privacy, pharmaceutical companies are investing in E-Clinical Trials but their integration in a
company global CRM program is a topic that is not yet fully understood (Lerer and Piper 2003).
Pharmaceutical companies are using digital technologies to target health professionals and
patients. In the United States the pharmaceutical industry spent in 2005 an estimate of five
public in the United Sates believes that too much money is spent in DTC, and part of this money could be spent in making pharmaceutical drugs more affordable (Datamonitor 2006).
The pharmaceutical companies are investing both in Europe and United States in internet sites
targeting the patients, in the case of United States this approach is now regarded as being
considerable more affordable than investing in TV advertising, because more than 35% of all internet users, survey the web to search for health information (Lerer and Piper 2003).
The local European web sites of pharmaceutical companies, avoid doing DTC advertising of
prescription drugs, but in some conditions the pharmaceutical companies can provide non-promotional information about drugs for chronic diseases and they are allowed to answer to
specific questions posted in a web site or by email to a patient that is taking a pharmaceutical
drug supplied by the company if the answer is provided by a health professional working for the
pharmaceutical company (Lerer and Piper 2003).
Currently almost all pharmaceutical companies have product-focused or disease specific
websites aiming the consumer or patient. In Europe because of the ban on DTC the local
European websites focus in disease awareness campaigns using unbranded health information,
nevertheless many use creative procedures to overcome the regulation limitation (Lerer and Piper 2003). A good example is the pharmaceutical company Organon that avoids mentioning
in their European websites the brand names of their pharmaceutical drugs, but when they are
talking about hormonal contraceptive vaginal ring, they are obviously talking about Nuvaring® their own product because this is the only contraceptive of it’s kind in Europe without
mentioning the contraceptive brand name, they are promoting a contraceptive option that they are the sole providers.
In the case of OTC in Europe it is possible to have product specific websites, and they have
already been implemented by several pharmaceutical companies to promote directly their brands to the public. In the United States the internet is a channel used to DTC, so it is frequent
to have website that promote a pharmaceutical drug and disease awareness and the same time.
In the United states it’s possible to have a pharmaceutical company corporate website that have
all this features or in other cases the pharmaceutical companies have separate product websites
(Lerer and Piper 2003).
The internet allowed a very important channel for the pharmaceutical companies to interact with
the patients and develop patient relationship management (PRM) programs. PRM can be
industry are designed to either support lifestyle programmes, such as smoking cessation and weight reduction or for chronic diseases (Lerer and Piper 2003). In the next sections specific
European and American examples of PRM are described.
The American Medical Association released findings that showed that many of the United
States physicians in 2001, about 80%, were using internet (Lerer and Piper 2003) for medical research and other professional activities, being a very common tool today for the vast majority
of the them, in Europe the initially acceptance as not so big like the United States, but now is
also a very important tool for the European physicians, with high acceptance (Bard 2007). In a
recent survey in Europe even if generally the physicians still consider the sales representative as a very important source of information, yet 50 per cent of all survey responders admit that they
prefer to receive information electronically; via email, webcasts, product sites or corporate sites
provided directly by pharmaceutical companies.
E-detailing is one of the activities that the pharmaceutical companies are incorporating in their websites, or even in PDA or laptop to help the sales representative in their detailing process.
E-detailing is the digital enablement of information delivery to health professionals, creating new
digital channels for interaction between the pharmaceutical company and the physicians (Lerer
and Piper 2003). A recent survey shown that e-detailing is already reaching regularly more than 50 per cent of the American physicians, where in Europe the market is still relatively young in
terms of development and uptake, with less than 40 per cent of European physicians saying that
they have participated in an e-detailing programme in the past 12 months (Bard 2007).
Physicians portals are typical implementations of eCRM programs that can be incorporated in the company corporate website or be a stand alone website. These websites are only accessible
to physicians or in some cases also other health professionals and require a previous registration
and only after a check-up process to confirm if it is really a certified health professional the user
will receive a password to access the areas in the website that are reserved to health professionals.
A recent survey indicates that 38 per cent of physicians who regularly go on-line say they
frequently change their prescribing behaviour as a result of information they have accessed
electronically (Bard 2007).
Some companies are also adopting Customer Service Center (CSC) multi-channel strategies as
part of an improved CRM package, using Internet, automated response, web tools, as compared
Others industries, like for example consumer goods used e-tools, to collect information about
the consumers and get a deeper understanding about their needs. In the area of analytics and
customer understanding using e-tools in the pharmaceutical industry one report mentioned that
only two or three companies are getting positive results without mentioning their name, but
saying that they are the exceptions (Lerer 2002). Again without using the correct analytics the pharmaceutical industry can’t maximize the return of their CRM investments.
2.2.4 CRM focusing in Supply Chain and Demand Management Integration
In some specific pharmaceutical companies after the implementation of ERP systems, they took
the opportunity to make the integration of supply chain and demand chain elements (Oracle and Peppers&Rogers Group 2007).
Pharmaceutical companies that deal with products of low differentiation, such as generic
products, medical devices and some types of hospital products see an effective integration of supply chain and demand a very effective way of saving money by optimizing their supply
chain and at the same time deliver high quality services that increase their sales revenue (Oracle
and Peppers&Rogers Group 2007).
A good example is Baxter Medication Delivery a division of Baxter, a global provider of medical products and services. Baxter Medication delivery packages up and ships a host of
products such as Intravenous (IV) solutions and frozen drugs to hospitals and physician offices
and it also negotiates with Group Purchasing Organizations on behalf of clients (Oracle and
Peppers&Rogers Group 2007).
Baxter Medication Delivery Operation Manager and CRM lead stated that the product line and
competitive pricing are always going to be important, but what really sets the brand are the
service and support that come with those products (Oracle and Peppers&Rogers Group 2007).
Baxter products are the type of products of low differentiation that require a very effective supply chain management, we are talking about IV solutions and frozen drugs, that require very
effective supply because any failure in the supply chain can damage the products irreversibly.
Baxter CRM solutions used a SFA system that enables the sales representative to have access to the company product stocks and orders per customer, information about contract compliance, to
customer service. The implementation of the system also enabled the company to better forecast their future sales and to better plan the manufacturing of products (Oracle and Peppers&Rogers
Group 2007).
2.2.5 Differences between the current CRM programs in Europe and United States
The possibility to make direct-to-consumer advertising in the United States enabled the
pharmaceutical industry to develop more sophisticated CRM programs than in Europe. A good
example it’s a loyalty program implemented by Novartis in United States. The program is
known as BP Success Zone and started in 2004 and promotes directly to the patients, the need for them to take medication for controlling their Blood pressure. For enrolling in the program
they also need to be prescribed with a Novartis blood pressure medication by their physician.
Then the patient can request the physician a BP Success Zone Kit in order for him to receive the
program benefits. But first the patient needs to activate their Kit, and for that he needs to fill a
formulary in the internet or do the registration via a call center. The Kit consists of a free sample for one month of medication, a Membership Card for Program discounts and benefits that
includes a 10 dollar discount per pack in any pharmacy and a free Omron® monitor for blood
pressure measurement, ongoing support materials and website access with specific tools for the
program, finally also includes a money back guarantee where patients can receive from Novartis, reimbursement for up to 4 months of out-of-pocket drug costs if, after taking the
maximum dose of Novartis medication for at least 30 days their blood pressure is not controlled
to the goal determined by their healthcare professional they can use a Guarantee Affirmation
Form to get the money back, signed by their healthcare professional, stating that the patient was
not able to reach the blood pressure goal set by him (Novartis 2007).
This is a typical implementation of a loyalty program for a chronic disease with a concept
similar with other examples seen for example in the consumer industry. This example basically
demonstrates the biggest difference between the CRM programs in Europe and United States, the fact that the focus in the patient in the United States is bigger and deeper than in Europe in
terms of CRM programs. In the last European Sales Force Effectiveness Summit for
Pharmaceutical industry held in 2006 (Eyeforfarma 2006), CRM was the main topic, but almost
all the European CRM approaches presented where focused in the physician and in improving
CRM SFA tools. The analytics presented to support the European CRM system were extremely poor, segmentation methodologies were very rudimentary, for example physician segmentation
presented was based on empirical rules without any statistical validation. We can resume that
examples of internet use to target patients in contrast with more sophisticated CRM programs in United States targeting the patients, and CRM programs targeting the physicians and other
health care professionals. The literature review indicates that the CRM programs in the
pharmaceutical industry focus separately health professionals and patients specially in Europe
that fact seems to be evident, in the United States the last examples like the one above