Comparing the performance of different stream classification
systems using aquatic macroinvertebrates
Comparando o desempenho de diferentes sistemas de classificação de riachos utilizando
macroinvertebrados aquáticos
Márlon de Castro Vasconcelos1, Adriano Sanches Melo2 and Albano Schwarzbold3
1Programa de Pós-graduação em Ecologia, Universidade Federal do Rio Grande do Sul – UFRGS, Av. Bento Gonçalves, 9500, CEP 91501-970, Porto Alegre, RS, Brazil
e-mail: [email protected]
2Departamento de Ecologia, Instituto de Ciências Biológicas, Universidade Federal de Goiás – UFG, CP 131, CEP 74001-970, Goiânia, GO, Brazil
e-mail: [email protected]
3Departamento de Ecologia, Instituto de Biociências, Universidade Federal do Rio Grande do Sul – UFRGS, Av. Bento Gonçalves, 9500, CEP 91501-970, Porto Alegre, RS, Brazil
e-mail: [email protected]
Abstract: Aim: We evaluated five stream classification systems observing: 1) differences in richness, abundance and macroinvertebrates communities among stream classes within classification systems; and 2) whether classification systems present better performance using macroinvertebrates. Additionally, we evaluated the effects of taxonomic resolution and data type (abundance and presence) on results. Methods: Five stream classification systems were used, two based on hydroregions, one based on ecoregions by FEOW, a fourth one based on stream orders and the last one based on clusters of environment variables sampled in 37 streams at Rio Grande do Sul state, Brazil. We used a randomization test to evaluate differences of richness and abundance, a db-MANOVA to evaluate the differences of species assemblages and Classification Strength (CS) to evaluate the classifications performance. Results: There were differences of richness and abundance among stream classes within each stream classification. The same result was found for community data, except for stream order classifications in family level. We observed that stream classes obtained for each stream classification differed in terms of environment variables (db-MANOVA). The classification based on environment variables showed higher CS values than other classification systems. The taxonomic resolution was important to the observed results. Data on genera level presented CS values 12% higher than family level for cluster classification, and the data type was dependent on the classification system and taxonomic resolution employed. Conclusion: Our results indicate that classifications based on cluster of environment variables was better than other stream classification systems, and similar results using genera level can be obtained for management programs using family resolution in a geographical context similar to this study.
Keywords: environment classification, classification strength, MRPP, hydroregions, tropical environment.
1. Introduction
Environmental classifications can be understood as a grouping of homogeneous areas in the landscape (Omernik, 1987; Omernik and Bailey, 1997). These classifications are derived from characteristics such as climate, topography and vegetation type and are called ecoregions; when applied to agglomerate river networks are called hydroregions (Hawkins and Vinson, 2000; Van Sickle and Hughes, 2000; Munné and Prat, 2004; Moreno et al., 2006). Likewise, we can use the features of rivers and streams to separate them on systems with similar characteristics, forming types of rivers in order to use them in management programs, research and restoration of water resources (Paavola et al., 2003; Ferréol et al., 2005). The use of ecoregions or classifications derived from environmental variables can provide better descriptions of ecological processes in a particular region than classifications based on other criteria such as size of the watershed, hydroregion or stream order (Hawkins et al., 2000). Moreover, watersheds and hydroregions may facilitate the management of public policies to geographically defined areas (Omernik and Bailey, 1997).
Both ecoregions and hydroregions should exhibit characteristics, such as current speed, stream size and geology of the drainage network, that are associated with patterns of ecological and evolutionary diversity of aquatic macroinvertebrate communities (Richards et al., 1996; Johnson et al., 2007). However, some studies have shown that aquatic organisms present a better response to ecoregion classification systems (Hawkins et al., 2000). In the review of Hawkins et al. (2000), five articles indicated that ecoregions better explained the aquatic communities than competing classifications based, for example, in stream order or hydroregions. In two other studies, however, classifications based on river basins obtained better results.
The results observed among environmental classification schemes may be dependent on the
taxonomic resolution and organism used. Studies using the classification strength (CS) approach
(Smith et al., 1990; Van Sickle, 1997) observed that high taxonomic resolution increases the classification strength. Feminella (2000) observed that the values of CS for hydroregions and ecoregions were similar, but the values observed at the species level were higher than the observed for family. Similar results were observed by Vinson and Hawkins (2000). These authors observed that the values of CS for genera data were more than twice the values for family of aquatic macroinvertebrates for the same classification scheme.
Most studies that evaluated the effects of classifications in aquatic communities were conducted in temperate environments (Waite et al., 2000; Sandin and Johnson, 2000; McCormick et al., 2000; Paavola et al., 2003; Verdonschot and Nijboer, 2004; Verdonschot, 2006; Sánchez-Montoya et al., 2007). Studies in tropical regions that assess the relationship between different stream classification schemes are scarce. Marchant et al. (2000) found in a study in Australia that classifications based on watersheds provided better results than ecoregions. Padial et al. (2012) observed that a posteriori
classifications based on aquatic organisms of different taxonomic groups presented higher CS
values than classifications based on apriori sample period of marginal lakes and connectivity in a flood plain in southern Brazil. Moreover, Pinto et al. (2009) observed that the ecoregions of Paraíba do Sul river in southeastern Brazil presented higher CS
values for fish communities than other classification systems used.
We intend to compare five stream classification systems in terms of: i) differences on richness, abundance and macroinvertebrate community among stream classes of the classifications used and ii) compare the classification strength for macroinvertebrates assemblages of five stream classification of Rio Grande do Sul state. The two objectives were evaluated observing the possible maiores valores que os demais sistemas de classificação. A resolução taxonômica foi um
fator importante, embora os dados no nível de gênero tenham apresentado valores de CS apenas 12% maiores do que aqueles observados para família, para a classificação baseada no agrupamento de variáveis. Conclusão: Nossos resultados indicam que classificações baseadas em variáveis ambientais são melhores do que os outros sistemas de classificação, e que monitoramentos baseados em famílias podem responder tão bem quanto o nível de gênero num contexto geográfico similar ao deste estudo.
around 15 °C and in summer around 26 °C. The rainfall average is 1500 mm, but has periods of drought in some regions, mainly in the south of the state. The vegetation in the northern portion of the state is characterized by patches of forest areas with Araucaria angustifolia, Pinus spp. and native grasslands. In the southern portion, the vegetation is composed predominantly of native fields (IBGE, 1986). The areas occupied by crops, exotic plantation forests and pastures are about 26.000 effects of taxonomic resolution and data type
(abundance and presence-absence data) on the results.
2. Methods
2.1. Study area
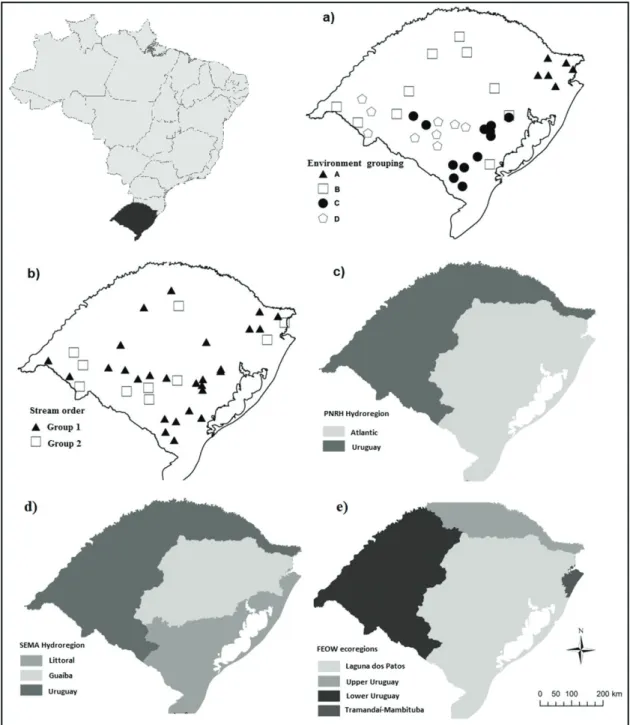
The study was conducted in 38 streams at Rio Grande do Sul state, in southern Brazil (Figure 1). The climate is subtropical with winter temperatures
2006). The state of Rio Grande do Sul includes two of the 12 hydroregions (Figure 1a), the Uruguay and Atlantic hydroregions. The Uruguay included 13 of the studied streams and an area of 174.400 km2 and
the Atlantic hydroregion 24 streams and an area of 142.200 km2.
The third classification system was composed by hydroregions delimited by the Environment Secretary - SEMA of Rio Grande do Sul (Rio Grande do Sul, 2007). According to SEMA, the state has three hydroregions for management purposes: Uruguay River Basin, identical to the PNRH region, Guaiba hydrographic region (84.500 km2) and Littoral basin (57.000 km2). These
three regions include watersheds that drain into, respectively, the Uruguay River, Guaiba Lake and South Atlantic Ocean. The Uruguay and Guaiba Lake regions included 13 sampled streams and the Littoral region included 11 streams.
The fourth system was composed of the freshwater ecoregions of FEOW (Freshwater Ecoregions of the World - http://www.feow.org) (Abell et al., 2008). The FEOW recognizes 25 aquatic ecoregions in Brazil, and four are present in the Rio Grande do Sul state. These are the high and low Uruguay ecoregions, being a division of PNRH and SEMA Uruguay hydroregion, Laguna dos Patos ecoregion and Tamandaí-Mampituba ecoregion. Three sampled streams represented ecoregion high Uruguay, 10 the low Uruguay, and 24 the Laguna dos Patos.
The fifth classification system was based on stream orders defined according to Strahler. The streams from 1st to 3rd orders formed the first class and those of 4th and 5th formed the second
one. According to Vannote et al. (1980), streams of different orders harbor different ecological processes. This way, it can be possible to use stream order as a proxy to the classification of lotic systems. Thus, the class 1 had 27 streams and class 2 had 10 streams.
Aquatic macroinvertebrates were used to validate the classifications used. The individuals were collected in four riffles with a Surber sampler of 25 × 25 cm size and 0.5 mm mesh. We pooled the Surbers samples obtained in each stream to use in statistical analysis. Samples were individualized in plastic containers and preserved with 96% ethanol. At the laboratory, individuals were sorted, counted and identified to taxonomic level of genus. Diptera and Lepidoptera were excluded from analyses because they were identified mostly to family level. km2 (Cordeiro & Hasenack 2009). The northern
region presents the higher altitudes, around 1200 m. The average altitude is 400 m in the central and southern regions (IBGE, 1986).
2.2. Stream classifications
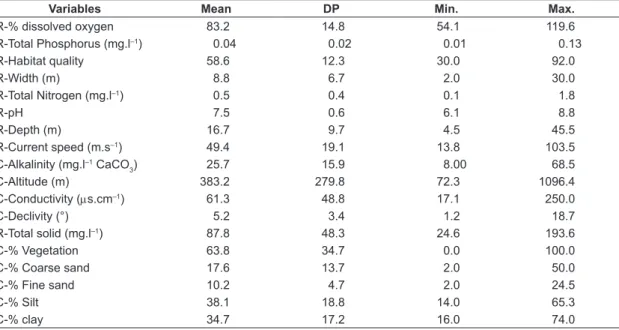
We assessed the performance of five stream classification systems for Rio Grande do Sul state (Figures 2 and 3) to describe the community of aquatic macroinvertebrates. The first classification system is the result of the grouping of environmental variables (Table 1) taken at two scales, stream reach and catchment. At each of the 38 streams, a 50 m segment long was delimited to obtain samples. Within each segment, four riffles consisting of gravel and pebbles, and with minimum distances of 5 m to each other, were randomly selected for sampling of stream velocity and depth. We used the average in the statistical analyzes for the four riffles. We opted to restrict sampling to a single habitat because the streams located in the southern portion of the state usually do not present high diversity of habitats. One sample was taken in each stream regarding other physical and chemical variables (Table 1). Stream width represented the widest section found in the studied reach. We quantified habitat quality using a habitat quality assessment protocol developed by Callisto et al. (2002). After obtaining geographical coordinates for sampling sites, the catchment was manually delimited for each stream segment sampled following the topography and altitude marks using 1:50.000 maps in CartaLinx® software. The watershed level variables were obtained by thematic maps from the Biodiversity Conservation Brazilian Program - PROBIO (Brasil, 2007) in Idrisi® v. Taiga software. The main economic occupation in the watersheds defined in our study was cattle farms, which occupied around 30% of the watershed areas, followed by agriculture (4%) and forestry (2%). The variables were normalized to have the same measurement unit, after which we performed a cluster analysis by Ward’s method based on Euclidean distance. The selection of number of groups followed Pillar (1999). Four sharp groups were identified (A, B, C and D; Figure 1). Group A included 6 streams, B 11, C 12 and group D had 9 streams.
Table 1. Mean, standard deviation, minimum and maximum values for the environmental variables used in the study. R = stream reach variables, C = Catchment variables.
Variables Mean DP Min. Max.
R-% dissolved oxygen 83.2 14.8 54.1 119.6
R-Total Phosphorus (mg.l–1) 0.04 0.02 0.01 0.13
R-Habitat quality 58.6 12.3 30.0 92.0
R-Width (m) 8.8 6.7 2.0 30.0
R-Total Nitrogen (mg.l–1) 0.5 0.4 0.1 1.8
R-pH 7.5 0.6 6.1 8.8
R-Depth (m) 16.7 9.7 4.5 45.5
R-Current speed (m.s–1) 49.4 19.1 13.8 103.5
C-Alkalinity (mg.l–1 CaCO
3) 25.7 15.9 8.00 68.5
C-Altitude (m) 383.2 279.8 72.3 1096.4
C-Conductivity (µs.cm–1) 61.3 48.8 17.1 250.0
C-Declivity (°) 5.2 3.4 1.2 18.7
R-Total solid (mg.l–1) 87.8 48.3 24.6 193.6
C-% Vegetation 63.8 34.7 0.0 100.0
C-% Coarse sand 17.6 13.7 2.0 50.0
C-% Fine sand 10.2 4.7 2.0 24.5
C-% Silt 38.1 18.8 14.0 65.3
C-% clay 34.7 17.2 16.0 74.0
2.3. Data analyses
2.3.1.Variation in the community
The analyses were performed taking into account importance of the taxonomic level (genus, family) and data type (presence-absence, abundance). We used a distance-based Multivariate Analysis of Variance (db-MANOVA) to assess if macroinvertebrate communities differed among stream classes of the classifications adopted in this study. The abundance data was transformed by log (x + 1) before the analyses. We used the Bray-Curtis dissimilarity for abundance and Sørensen dissimilarity for the presence data. The significance values were obtained by 10.000 randomizations. We also evaluated whether macroinvertebrate abundance and richness differed among stream classes of stream classifications using a permutation test with 10.000 randomizations. We also evaluated whether environmental variables differed between classifications through a db-MANOVA using Euclidean distance for the classifications 2 to 5 (except for the classification based on environment variables). The variables were normalized to have the same measurement scale. The db-MANOVA and randomization tests were performed in the MULTIV software (available in http://www. ecologia.ufrgs.br/ecoqua).
2.3.2.Classification strength
We use the Classification Strength (CS) (Smith et al. 1990; Van Sickle, 1997) to evaluate performance of classifications. The CS is obtained by the equation CS = W— – B_, and varies from 0 to 1, where: (W—) is the average of similarities within groups and (B_) the average of similarities between groups. The value of W— is obtained by taking the average of the mean similarities within each group
Wi, where i is any group within the classification (Figure 2). If stream groups within a given classification system are similar, then CS is equal to zero (—W = B_). If groups are distinct, then W— > B_.
CS values close to 1 indicate a strong classification (Hawkins et al., 2000).
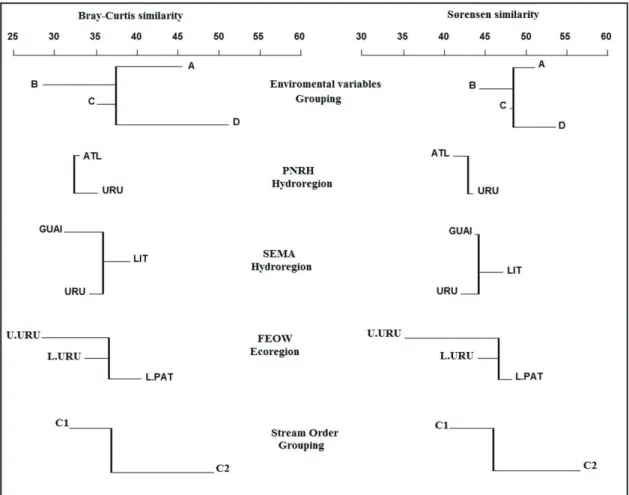
We used the mean similarity dendrogram approach (Van Sickle, 1997) to represent the values observed for B_ and the similarity values for each
stream class (Wi). If the classifications are strong,
the branches of dendrograms, the Wi values, are
relatively long compared to B_ values. The analyses
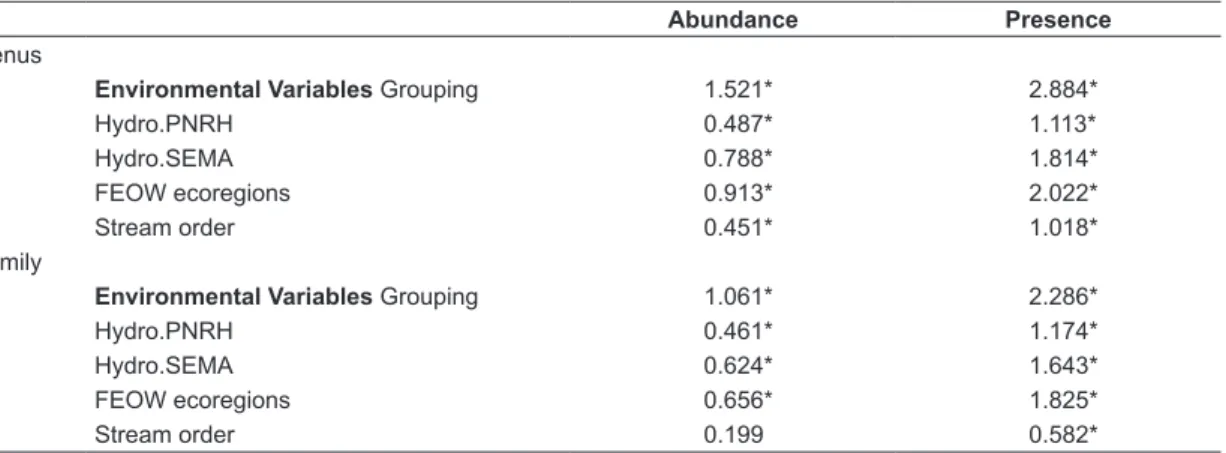
hydroregions and ecoregions classifications. In the PNRH hydroregions, family richness was higher in the Atlantic region. For the ecoregions, family richness was higher in the Laguna dos Patos ecoregion and similar in the other two (Table 3). For abundance data, differences were observed in the stream order classification, the higher values also observed in class 2. The communities differed between the classes of stream classifications used in this study, independent of the taxonomic resolution and the data type used. The exception was family abundance data that were similar among stream classes defined by stream order (Table 4). In general, the CS values were numerically low for the five classifications used and ranging from 0.1% to 6.2% (significant results Table 5). The taxonomic resolution and data type were important to the result observed, and the CS values for the
genus and family depended on the classification system used (Table 5). For taxonomic resolution the macroinvertebrates identified to genera had is repeated n times, and the distribution of δalt
is compared to δobs. The statistic tests the null hypothesis δalt = δobs. We use 10.000 permutations in the tests. Estimates of CS and MRPP were
made with Bray-Curtis similarity for abundance data, and Sørensen similarity for presence-absence data. The CS values were obtained in MEANSIM v.6 software (www.epa.gov/wed) and MRPP statistics in MULTIV software. The mean similarity dendrograms were obtained from a plot with the result of the meandist function for vegan package in R environment (R Development Core Team, 2009).
3. Results
The abiotic variables differed among stream classes of the classifications adopted (b-MANOVA; P < 0.05) (Table 2). The observed values of genera richness were similar among groups of classifications except for the stream order classification, which was higher in class 2 than class 1. For families, differences among groups were observed between the PNRH
CS value higher than family data for the stream classification schemes, except for abundance on hydro-PNRH approach. The stream classification obtained by grouping of environmental variables was better than the other classifications used. The mean dendrograms for abundance show arms, i.e.
Wi values, relatively longer than presence-absence data. This indicates that groups based on abundance data are more similar internally than those observed for the presence-absence data (Figures 2 and 3). The relatively short arms observed in some classifications and values lower than the global mean between groups similarity (B_), show that these groups are more heterogeneous and, thus, contribute to the low CS values observed. In relation to taxonomic resolution, arms of the dendrograms obtained with genus data tended to be longer than those obtained with family data.
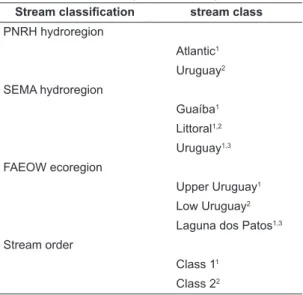
Table 2. Environment variables differences among stream class within stream classifications. Environment variable groping is not showed. The similar superscript numbers indicates environment similarity. For an α = 0.05 and 10.000 randomizations (db-MANOVA).
Stream classification stream class
PNRH hydroregion
Atlantic1
Uruguay2
SEMA hydroregion
Guaíba1
Littoral1,2
Uruguay1,3
FAEOW ecoregion
Upper Uruguay1
Low Uruguay2
Laguna dos Patos1,3
Stream order
Class 11
Class 22
watersheds that drain into the Uruguay River and the Atlantic Ocean. Thus, we could expect similar results. Our results also show that the taxonomic resolution and data type were important when evaluating the change in macroinvertebrates community and classifications strength (CS). The genus level obtained higher values than family when we observed the classification scheme. Added to this, the data type (presence-absence and
4. Discussion
The classifications used in this study were able to capture both the environmental and aquatic macroinvertebrates community variation. Except for the classifications resulting from the grouping of environmental variables and stream orders, the other classifications, the two hydroregions and the ecoregion are different arrangements of the
Table 3. Sum of Squares values for permutation test of genus and family richness and abundance (n = 37 streams).
Genus richness Family richness Abundance
Environmental Variables Grouping 0.08 0.07 0.12
Hydro.PNRH 0.07 0.17* 0.12
Hydro.SEMA 0.07 0.06 0.12
FEOW ecoregions 0.07 0.06* 0.12
Stream order 0.07* 0.07 0.11*
* Significant values for an α = 0.05.
Table 4. Sum of Squares values for db-MANOVA results by community differences among stream classifications (n=37).
Abundance Presence
Genus
Environmental Variables Grouping 1.521* 2.884*
Hydro.PNRH 0.487* 1.113*
Hydro.SEMA 0.788* 1.814*
FEOW ecoregions 0.913* 2.022*
Stream order 0.451* 1.018*
Family
Environmental Variables Grouping 1.061* 2.286*
Hydro.PNRH 0.461* 1.174*
Hydro.SEMA 0.624* 1.643*
FEOW ecoregions 0.656* 1.825*
Stream order 0.199 0.582*
* Significant values for an α = 0.05.
Table 5. Classification Strength (CS) results to genus and family. —W = mean similarity within groups (%). B_ = simi-larity between groups (%).
Abundance Presence-absence
W —
B _
CS W— B
_
CS
Environmental Variables Grouping
Genus 41.3 35.1 6.2* 49.7 43.9 5.8*
Family 54.2 48.7 5.5* 64.4 59.3 5.1*
Hydro-PNRH
Genus 34.8 35.8 –1.0 43.9 43.7 0.2*
Family 48.7 48.1 0.6* 59.4 59.6 –0.2
Hydro-SEMA
Genus 35.6 35.6 0.0 45.1 44.0 1.1*
Family 49.3 49.9 -0.6 60.5 60.2 0.3*
FEOW ecoregions
Genus 37.7 36.8 0.9* 46.4 45.8 0.6*
Family 49.8 51.4 –1.6 61.0 60.9 0.1*
Stream order
Genus 37.5 36.3 1.2* 46.0 45.4 0.6*
genus level were higher than those seen for family level. On the other hand, Houghton (2003) showed that CS values obtained between classifications based on watersheds and ecological provinces were different, and the latter showed higher values when comparisons were done for the same spatial scale between the classifications.
The differences between the classification approaches observed in this study are explained primarily by environmental differences among stream classes within each classification. Environmental variables have different values among stream classes within each classification system. For ecoregions, upper Uruguay ecoregion was similar to the Laguna dos Patos. When evaluating the differences in the community of aquatic invertebrates, the results corresponded to the differences in environmental variables. Thus, the environmental characteristics between stream classes are important to determine the macroinvertebrate community. Waite et al. (2000) showed that when ecoregions were divided by stream order, the macroinvertebrates responded primarily to the slope and stream order, and after them to the landscape characteristics summarized by ecoregion. Likewise, Houghton (2003) attributed the differences observed among the CS values to the environmental gradients observed between watershed classes and ecological classifications. The author noted that the stream classes of watershed are more heterogeneous than classes within ecological provinces (Houghton, 2003). Waite et al. (2000) emphasize that the use of classifications based solely on watersheds (hydroregions) or ecoregions is not enough to classify the streams and local features, such as water chemistry, which must be added as criteria.
Environmental heterogeneity and rarity may explain our results. Van Sickle and Hughes (2000) attributed part of their results regarding differences among the ecoregions to taxa distribution among stream classes of the classifications used. The taxa may be abundant in a class and rare or absent in other classes within the classification used. The same explanation is used by Heino and Mykra (2006). These authors observed weak overlap of river types defined by geomorphology in Finland, and attributed the individual responses of species to environmental gradients, as well as the effect of rarity. Macroinvertebrates are associated with some environment conditions. For example, pH and discharge can affect positively Seriscostoma personatum (Trichoptera) and negatively Leuctra niga (Plecoptera) (Townsend et al., 1993 pg. 529, abundance) showed slightly similar results among
classifications schemes, the abundance data were higher to presence-absence results. The exception was hydroregion by PNRH, which showed an inversion when we observed the same taxonomic level. The classification strength values observed for the family in general were smaller than those observed for genus when observing the same stream classification (Van Sickle and Hughes, 2000; Sandin and Johnson, 2000; Houghton, 2003). Previous studies have shown that when CS values are not
similar between taxonomic levels, the finer level had higher CS value (Hawkins et al., 2000). Houghton (2003) showed that the values of CS for genus level were about 17% higher than that observed for family. The CS values recorded in our study between genus and family levels shows a reduction of approximately 12% in the values of CS value.
Houghton (2003) argues that it is more likely that two types of rivers contain the same taxon when we use a coarser taxonomic resolution (family) when compared to the use of genus and species. In fact, our data included more families shared (70%) among stream classes of the classifications based on watersheds than that using genera (60%). These slightly similar values can explain the weak performance of the hydroregions for family level data. Higher taxonomic resolutions, such as genus and species, tend to be more sensitive to subtle changes in the environment than family (Resh and Unzicker, 1975; Cranston, 1990).
show that although the classification systems are able to account for the variation of communities of aquatic invertebrates, classifications based on watersheds were inferior compared to those based on environmental characteristics. However, use of both approaches in conjunction must be further evaluated. The use of the FEOW ecoregions should be better evaluated because [ ] the upper Uruguay ecoregion had only three streams sampled, thus additional streams must be sampled in this region. The CS values of family resolution were lower than that of genus level, but the values were not very different. We recommend that biomonitoring programs on large scales may use information on family-level based and presence-absence data. Though the genus results were better, family resolution provides rapid identification and processing, which reduces the final cost and produces similar responses to genus level when covering large geographic extensions.
Acknowledgement
The Geoprocessing Laboratory of the Universidade Federal do Rio Grande do Sul provided the catchment data. Coordenação de Aperfeiçoamento de Pessoal de Nível Superior (CAPES) conceded a student fellowship to MCV. ASM received a research fellowship (307479/2011-0) and research grants (474560/2009-0 and 558187/2009-9) from the Conselho Nacional de Desenvolvimento Científico e Tecnológico (CNPq).
References
ABELL, R., THIEME, M., REVENGA, C., BRYER, M., KOTTELAT, M., BOGUTSKAYA, N., COAD, B., MANDRAK, N., CONTRERAS-BALDERAS, S., BUSSING, W., STIASSNY, MLJ., SKELTON, P., ALLEN, GR., UNMACK, P., NASEKA, A., NG, R., SINDORF, N., ROBERTSON, J., ARMIJO, E., HIGGINS, J., HEIBEL, TJ., WIKRAMANAYAKE, E., OLSON, D., LOPEZ, HL., REIS RED., LUNDBERG, JG, SABAJ PEREZ, MH. and PETRY, P. 2008. Freshwater ecoregions of the world: A new map of biogeographic units for freshwater biodiversity conservation. BioScience, vol. 58, p. 403-414. http://dx.doi.org/10.1641/B580507
Brasil. Ministério do Meio Ambiente. Secretária de Biodiversidade e Florestas. 2007. PROBIO Cobertura Vegetal do Bioma Pampa – Relatório Técnico. Brasilia. 31 p.
Brasil. Ministério do Meio Ambiente. Secretária de Recursos Hídricos. 2006. Plano Nascional de Recursos Hídricos - PNRH: Síntese execultiva. Brasilia. 143 p. table 3), so the organism responses to environmental
conditions determine their occurrence and abundance. Heino and Mykra (2006) argued that widespread species decrease the between-group heterogeneity and the rare species decrease within-group similarity, resulting low CS value. When
evaluated a posteriori, the taxa occurrence between the two stream classes of the hydroregions defined by PNRH, for example, of the 77 genera identified, 10 were exclusive of the Uruguay hydroregion,
Alisotrichia, Abtrichia and Leucotrichia (Trichoptera), Agriogomphus, Cacoides and Perithemis (Odonata), Cryptonynpha, Homothraulus and Hydrosmilodon
(Ephemeroptera) and Belostoma (Heteroptera). The South Atlantic hydroregion presented 19 exclusive taxa, including 11 genera of Trichoptera. Despite these exclusivities, these rare taxa occurred in up to 25% of the sites in both hydroregions, while other taxa occurred in similar proportions in both hydroregions. The stream classes defined by cluster of environmental variables presented marked differences both in occurrence and in abundance, but mainly in the taxa abundance among the four stream classes.
JOHNSON, RK., FURSE, MT. HERING, D. and SANDIN L. 2007. Ecological relationships between stream communities and spatial scale: implications for designing catchment-level monitoring programmes. Freshwater Biology, vol. 52, p. 939-958. http://dx.doi. org/10.1111/j.1365-2427.2006.01692.x
MARCHANT, R., WELLS, F. and NEWALL, P. 2000. Assessment of an ecoregion approach for classifying macroinvertebrates assemblages from streams in Victoria, Australia. Journal of North American Benthological Society, vol. 19, no. 3, p. 497-500. http://dx.doi.org/10.2307/1468110
McCORMICK, FH., PECK, DV. and LARSEN., DP. 2000. Comparison of geographic classification schemes for Mid-Atlantic stream fish assemblages. Journal of the North American Benthological Society, vol. 19, no. 3, p. 385-404. http://dx.doi. org/10.2307/1468102
MORENO, JL., NAVARRO, C. and DE LAS HERAS, J. 2006. Abiotic ecotypes in south-central Spanish rivers: Reference conditions and pollutions. Environmental Pollution, vol. 143, p. 388-396. PMid:16458399. http://dx.doi.org/10.1016/j. envpol.2005.12.012
MIELKE, PW. JR., BERRY, KJ. and JOHNSON, ES. 1976. Multiresponse Permutation Procedures for A Priori Classifications. Communications in Statistical Theory and Methods, vol. A5, p. 1409-1424. MUNNÉ, A. and PRAT, N. 2004. Defining river
types in a Mediterranean area: A methodology for the implementation of the EU Water Framework Directive. Environmental Management, vol. 34, no. 5, p. 711-729. PMid:15633032. http://dx.doi. org/10.1007/s00267-003-0098-y
OMERNIK, JM. 1987. Ecorregions of the conterminous United States. Annals of the Association of American Geographers, vol. 77, p. 118-125. http://dx.doi. org/10.1111/j.1467-8306.1987.tb00149.x
OMERNIK, JM. and BAILEY, RG. 1997. Distinguishing between watersheds and ecoregions. Journal of the American Water Resources Association (formerly Water Resources Bulletin), vol. 33, no. 5, p. 935-949. http:// dx.doi.org/10.1111/j.1752-1688.1997.tb04115.x PAAVOLA, R., MUOTKA, T., VIRTANEN, R.,
HEINO, J. and KREIVI, P. 2003. Are biological classifications of headwater streams concordant across multiple taxonomic groups?. Freshwater Biology, vol. 48, p. 1912-1923. http://dx.doi.org/10.1046/ j.1365-2427.2003.01131.x
PADIAL, AA., SIQUEIRA, T., HEINO. J., VIEIRA, LCG., BONECKER., CC., LANSAC-TÔHA, FA. RODRIGUES, LC., TAKEDA, AM., TRAIN, S., VELHO, LFM. and BINI, LM. 2012. Relationships between multiple biological groups and classification schemes in a Neotropical floodplain. Ecological Indicators, vol. 13, p. 55-65.
CALLISTO, M., FERREIRA, WR., MORENO, P., GOULART, M. and PETRUCIO, M. 2002. Aplicação de um protocolo de avaliação rápida da diversidade de habitats em atividades de ensino e pesquisa (MG-RJ). Acta Limnologica Brasiliesia, vol. 14, no. 1, p. 91-98.
CORDEIRO, JLP. and HASENACK, H. 2009. Cobertura vegetal atual do Rio Grande do Sul. In PILLAR, VD., MÜLLER, SC., CASTILHOS, ZMS. and JACQUES, AVA., org. Campos sulinos: conservação e uso sustentável da biodiversidade. Brasília: MMA. 403 p.
CRANSTON, PS. 1990. Biomonitoring and invertebrate taxonomy. Environmental Monitoring and Assessment, vol. 14, p. 265–273. PMid:24243328. http://dx.doi. org/10.1007/BF00677921
FERRÉOL, M., DOHET, A., CAUCHIE, HM. and HOFFMAN, L. 2005. A top-down approach for a stream typology based on abiotic variables. Hydrobiologia, vol. 551, p. 193-208. http://dx.doi. org/10.1007/s10750-005-4461-2
FEMINELLA, JW. 2000. Correspondence between stream macroinvertebrate assemblages and 4 ecoregions of the southeastern USA. Journal of the North American Benthological Society, vol. 19, no. 3, p. 442-461. http://dx.doi.org/10.2307/1468106 HAWKINS, CP. and VINSON, MR. 2000. Weak
correspondence between landscape classifications and stream invertebrate assemblages: implications for bioassessments. Journal of North American Benthological Society, vol. 19, no. 3, p. 501-517. http://dx.doi.org/10.2307/1468111
HAWKINS, C P., NORRIS, RH., GERRITSEN, J., HUHES, RM., JACKSON, SK., JOHNSON, RK. and STEVENSON, RJ. 2000. Evaluation of the use of landscape classification for the prediction of freshwater biota: synthesis and recommendations. Journal of North American Benthological Society, vol. 19, no. 3, p. 541-556. http://dx.doi.org/10.2307/1468113
HEINO, J. and MYKRA, H. 2006. Assessing physical surrogates for biodiversity: Do tributary and stream type classifications reflect macroinvertebrate assemblage diversity in running waters. Biological Conservation, vol. 129, p. 418-426. http://dx.doi. org/10.1016/j.biocon.2005.11.009
HOUGHTON, DC. 2003. Evaluation of Minnesota geographic classification based on caddsfly (Trichoptera) data. Great Lakes Entomologist, vol. 36, p. 76-92.
Society, vol. 19, no. 3, p. 462-474. http://dx.doi. org/10.2307/1468107
SMITH, PR., PONTASCH, KW. and CAIRNS, J. 1990. Community similarity and the analysis of multispecies environmental data: a unified statistical approach. Water Research, vol. 24, p. 507-514. http:// dx.doi.org/10.1016/0043-1354(90)90236-Y TOWNSEND, CR., HILDREW, AG. and FRANCIS,
J. 1993. Community structure in some southern English streams: the influence of physicochemical factors. Freshwater biology, vol. 13, p. 521-544. VAN SICKLE, J. 1997. Using mean similarity
dendrograms to evaluate classifications. Journal of Agricultural, Biological and Environmental Statistics, vol. 2, p. 370-388. http://dx.doi. org/10.2307/1400509
VAN SICKLE, J. and HUGHES RM. 2000. Classification strengths of ecoregions, catchments, and geographic clusters for aquatic vertebrates in Oregon. Journal of the North American Benthological Society, vol. 19, no. 3, p. 370-384. http://dx.doi. org/10.2307/1468101
VERDONSCHOT, PFM. and NIJBOER, RC. 2004. Testing the European stream typology of the Water Framework Directive for macroinvertebrates. Hydrobiologia, vol. 516, 35-54. http://dx.doi. org/10.1023/B:HYDR.0000025257.30311.b7 VERDONSCHOT, PFM. 2006. Evaluation of the use
of Water Framework Directive typology descriptors, reference sites and spatial scale in macroinvertebrate stream typology. Hydrobiologia, vol. 566, p. 39-58. http://dx.doi.org/10.1007/s10750-006-0071-x VINSON, MR and HAWKINS, CP. 1998. Biodiversity
of stream insects: Variation at local, basin, and regional scales. Annual Review of Entomology, vol. 43, p. 271-293.
WAITE I. R., HERLIHY, AT., LARSEN, DP. and KLEMM, DJ. 2000. Comparing strength of geographical and non-geographical classifications on stream benthic macroinvertebrates in the Mid-Atlantic Highlands, USA. Journal of the North American Benthological Society, vol. 19, no. 3, p. 429-441. http://dx.doi.org/10.2307/1468105
Received: 26 April 2013 Accepted: 25 November 2013 PILLAR, VD. 1999. How sharp are classifications?
Ecology, vol. 80, p. 2508-2516. http://dx.doi. org/10.1890/0012-9658(1999)080[2508:HSAC] 2.0.CO;2
PINTO, BCT., ARAUJO, FC., RODRIGUES, VD. and HUGHES, RM. 2009. Local and ecoregion effect on fish assemblages structure in tributaries of the Rio Paraíba do Sul, Brazil. Freshwater Biology, vol. 54, p. 2600-2615. http://dx.doi.org/10.1111/j.1365-2427.2009.02269.x
R Development Core Team. 2009. R: A Language and Environment for Statistical Computing. Vienna: R Foundation for Statistical Computing. Available from: <http://www.R-project.org>.
RESH, VH. and UNZICKER, JD. 1975. Water quality monitoring and aquatic organisms: the importance of species identification. Journal (Water Pollution Control Federation. Vol. 47, p. 9-19.
RICHARDS, C., JOHNSON, LB. and HOST, GE. 1996. Landscape scale influences on stream habitats and biota. Canadian Journal of Aquatic Science, vol. 53, p. 295-311. http://dx.doi. org/10.1139/f96-006
Rio Grande do Sul. Governo do Estado. Secretária Estadual do Meio Ambiente. 2007. Elaboração do Plano Estadual de Recursos hídricos do Rio Grande do Sul: Relatório Síntese da Fase A – RSA. Diagnóstico e Prognóstico Hídrico das Bacias Hidrográficas do Rio Grande do Sul. Porto Alegre. 143 p. Elaboração: Ecoplan Engenharia.
SÁNCHEZ-MONTOYA, MM., PUNTÍ, T., SUÁREZ, ML., VIDAL-ABARCA, MR., RIERADEVALL, M., POQUET, JM., ZAMORA-MUÑOZ, C., ROBLES, S., ÁLVAREZ, M., ALBA-TERCEDOR, J., TORO, M., PUJANTE, AM., MUNNÉ, A. and PRAT, N. 2007. Concordance between ecotypes and macroinvertebrates assemblages in Mediterranean streams. Freshwater Biology, vol. 52, p. 2240-2255. http://dx.doi.org/10.1111/j.1365-2427.2007.01826.x