BGD
11, 11597–11634, 2014
Longitudinal patterns of stream nutrient
chemistry
S. Bernal et al.
Title Page
Abstract Introduction
Conclusions References
Tables Figures
◭ ◮
◭ ◮
Back Close
Full Screen / Esc
Printer-friendly Version Interactive Discussion
Discussion
P
a
per
|
Discus
sion
P
a
per
|
Discussion
P
a
per
|
Discussion
P
a
per
|
Biogeosciences Discuss., 11, 11597–11634, 2014 www.biogeosciences-discuss.net/11/11597/2014/ doi:10.5194/bgd-11-11597-2014
© Author(s) 2014. CC Attribution 3.0 License.
This discussion paper is/has been under review for the journal Biogeosciences (BG). Please refer to the corresponding final paper in BG if available.
Riparian and in-stream controls on
nutrient concentrations along
a headwater forested stream
S. Bernal1, A. Lupon2, M. Ribot1, F. Sabater2, and E. Martí1
1
Center for Advanced Studies of Blanes (CEAB-CSIC), Accés a la Cala Sant Francesc 14, 17300, Blanes, Girona, Spain
2
Departament d’Ecologia, Facultat de Biologia, Universitat de Barcelona, Av. Diagonal 643, 08028, Barcelona, Spain
Received: 16 June 2014 – Accepted: 20 June 2014 – Published: 29 July 2014
Correspondence to: S. Bernal ([email protected])
Published by Copernicus Publications on behalf of the European Geosciences Union.
BGD
11, 11597–11634, 2014
Longitudinal patterns of stream nutrient
chemistry
S. Bernal et al.
Title Page
Abstract Introduction
Conclusions References
Tables Figures
◭ ◮
◭ ◮
Back Close
Full Screen / Esc
Printer-friendly Version Interactive Discussion
Discussion
P
a
per
|
Discus
sion
P
a
per
|
Discussion
P
a
per
|
Discussion
P
a
per
|
Abstract
Headwater streams have a strong capacity to transform and retain nutrients, and thus, a longitudinal decrease in stream nutrient concentrations would be expected from in-stream nutrient removal alone. Yet, a number of other factors within the catchment, including biogeochemical processing within the riparian zone and export to streams, 5
can contribute to stream nutrient concentration, which may overcome the effect of in-stream biogeochemical processing. To explore this idea, we analyzed the longitudinal patterns of stream and riparian groundwater concentrations for chloride (Cl−), nitrate (NO−3), ammonium (NH+4), and phosphate (PO34−) along a 3.7 km reach at an annual scale. The reach showed a gradual increase in stream and riparian width, riparian 10
tree basal area, and abundance of riparian N2-fixing tree species. Concentrations of
Cl− indicated a strong hydrological connection at the riparian-stream edge. However, stream and riparian groundwater nutrient concentrations showed a moderate to null correlation, suggesting high biogeochemical processing at the riparian-stream edge and within the stream. A mass balance approach along the reach indicated that, on av-15
erage, in-stream net nutrient uptake prevailed over release for NH+4 and PO34−, but not for NO−3. On an annual basis, in-stream processes contributed to change stream input fluxes by 11 %, 26 %, and 29 % for NO−3, NH+4, and PO34−, respectively. Yet, longitudinal trends in concentration were not consistent with the prevailing in-stream biogeochem ical processes. During the riparian dormant period, stream concentration decreased 20
along the reach for NO−3, but increased for NH+4 and PO34−. During the riparian vege-tative period, NO−3 and PO34− increased along the reach while NH+4 showed no clear pattern. These longitudinal trends were partially related to riparian forest features and groundwater inputs, especially for NO−3 and PO34−. Our study suggests that even though in-stream biogeochemical processing was substantial, the riparian zone can modulate 25
BGD
11, 11597–11634, 2014
Longitudinal patterns of stream nutrient
chemistry
S. Bernal et al.
Title Page
Abstract Introduction
Conclusions References
Tables Figures
◭ ◮
◭ ◮
Back Close
Full Screen / Esc
Printer-friendly Version Interactive Discussion
Discussion
P
a
per
|
Discus
sion
P
a
per
|
Discussion
P
a
per
|
Discussion
P
a
per
|
1 Introduction
Stream water chemistry integrates hydrological and biogeochemical processes occur-ring within its drainage area, and thus, the temporal variation of stream solute concen-trations at the catchment outlet is considered a good indicator of the response of ter-restrial and aquatic ecosystems to environmental drivers (Bormann and Likens, 1967; 5
Bernhardt et al., 2003; Houlton et al., 2003). Less attention has been paid to the spatial variation of water chemistry along the stream, though it can be considerable important because stream nutrient concentrations are influenced by changes in hydrological flow paths, vegetation cover, and soil characteristics as catchment size increases (Dent and Grimm, 1999; Likens and Buso, 2006). For instance, spatial variation in nutrient con-10
centration along the stream has been attributed to changes in soil nitrification rates (Bohlen et al., 2001), soil organic carbon availability (Johnson et al., 2000), and or-ganic soil depth across altitudinal gradients (Lawrence et al., 2000). Moreover, nutrient cycling within the riparian zone can strongly influence stream nutrient concentrations along the stream not only because these ecosystems are hot spots of biogeochemical 15
processing (McClain et al., 2003; Vidon et al., 2010), but also because processes oc-curring in near stream areas have a major influence on stream water chemistry than those occurring in faraway locations (Ross et al., 2012). Finally, biogeochemical pro-cesses within the stream and at the riparian-stream edge can also influence stream nutrient chemistry along the stream (Peterson et al., 2001; Dent et al., 2007).
20
Our understanding of nutrient biogeochemistry within riparian zones and streams is mainly based on field studies performed at the plot scale and at small stream reaches of few hundreds meters. These empirical studies have widely demonstrated the po-tential of riparian and stream ecosystems as sinks or sources of nutrients (Peterson et al., 2001; Sabater et al., 2003; Mayer et al., 2007). Riparian and stream biota are 25
capable to decrease the concentration of essential nutrients, such as dissolved inor-ganic nitrogen and phosphate, either in groundwater or in the stream water column, especially with increasing water storage and residence time (Valett et al., 1996; Hedin
BGD
11, 11597–11634, 2014
Longitudinal patterns of stream nutrient
chemistry
S. Bernal et al.
Title Page
Abstract Introduction
Conclusions References
Tables Figures
◭ ◮
◭ ◮
Back Close
Full Screen / Esc
Printer-friendly Version Interactive Discussion
Discussion
P
a
per
|
Discus
sion
P
a
per
|
Discussion
P
a
per
|
Discussion
P
a
per
|
et al., 1998; Peterson et al., 2001; Vidon and Hill, 2004). Conversely, some riparian forests can become sources rather than sinks of nutrients when N2-fixing species
pre-dominate (Helfield and Naiman, 2002; Compton et al., 2003). Moreover, there is an intimate hydrological link between riparian and stream ecosystems that can result in strong biogeochemical feedbacks between these two compartments as frequently de-5
scribed in the scientific literature (e.g., Morrice et al., 1997; Martí et al., 2000; Bernal and Sabater, 2012). However, studies integrating biogeochemical processes at these two nearby ecosystems are rare (but see Dent et al., 2007).
Despite the impressive body of knowledge showing the potential of riparian zones and stream ecosystems to modify either groundwater or stream nutrient concentra-10
tions, our ability to upscale those reach- and plot-scale measurements is limited be-cause hydrological and biogeochemical processes can vary substantially along the stream (Covino and McGlynn, 2007; Jencso et al., 2010). The assessment of the spa-tial variation in nutrient concentration along the stream can be useful to overcome this limitation and contribute to our understanding of controls on stream nutrient chem-15
istry and ecosystem-level processes (Dent and Grimm, 1999; Lawrence et al., 2000). We propose that the influence of riparian and in-stream biogeochemical processes on stream nutrient chemistry could be inferred from the longitudinal variation of stream nu-trient concentrations and fluxes along natural gradients with an increasing presence of these ecosystems (for instance, from headwaters to the valley bottom). Physiographic 20
features such as riparian and stream size can change markedly across relatively short distances in headwater streams compared to lowland streams (Uehlinger, 2000), which makes headwater catchments good model systems for investigating drivers of longitu-dinal patterns in stream nutrient concentration and their temporal variation.
The goal of this study was to gain a more comprehensive view of the influence of 25
BGD
11, 11597–11634, 2014
Longitudinal patterns of stream nutrient
chemistry
S. Bernal et al.
Title Page
Abstract Introduction
Conclusions References
Tables Figures
◭ ◮
◭ ◮
Back Close
Full Screen / Esc
Printer-friendly Version Interactive Discussion
Discussion
P
a
per
|
Discus
sion
P
a
per
|
Discussion
P
a
per
|
Discussion
P
a
per
|
to the stream as well as in-stream net nutrient uptake along a 3.7 km reach. The upper most site of the reach drained hillslope forests and it had almost no riparian trees while the stream was wider and sandier, and it was flanked by a well-developed riparian forest at the downier most site. We sampled during both, the dormant and vegetative period to investigate if the longitudinal pattern of stream water chemistry was influenced by the 5
seasonality of biological processes. We expected a decrease in nutrient concentrations along the stream reach, and a subsequent decrease in area-specific nutrient fluxes, if nutrient retention at the riparian-stream interface increases from headwaters to the valley bottom. Alternatively, an increasing trend in stream nutrient concentrations and fluxes would indicate a limited ability of this riparian-stream interface to reduce nutrient 10
inputs from adjacent terrestrial ecosystems.
2 Study site
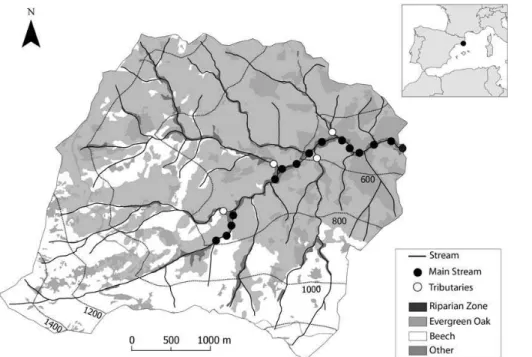
The research was conducted in the Font del Regàs catchment (14.2 km2), located in the Montseny Natural Park, NE Spain (41◦50′N, 2◦30′E, 300–1200 m a.s.l.) during the period 2010–2011 (Fig. 1). Total inorganic N deposition in this area oscillates between 15
15–30 kg N ha−1year−1(Àvila and Rodà 2012). The climate at the Montseny Mountains is subhumid Mediterranean. The long-term mean annual precipitation is 925±151 mm and the long-term mean annual air temperature is 12.1±2.5◦C (mean±SD, period: 1940–2000, Catalan Metereologic Service: http://www.meteo.cat/servmet/index.html). During the study period, mean annual precipitation (975 mm) and temperature (12.9◦C) 20
fall well within the long-term average (data from a meteorological station within the study catchment).
The catchment is dominated by biotitic granite (ICC, 2010) and it has steep slopes (28 %). Evergreen oak (Quercus ilex) and beech (Fagus sylvatica) forests cover 54 % and 38 % of the catchment area, respectively (Fig. 1). The upper part of the catchment 25
(2 %) is covered by heathlands and grasslands (ICC, 2010). Hillslope soils (pH∼6) are
BGD
11, 11597–11634, 2014
Longitudinal patterns of stream nutrient
chemistry
S. Bernal et al.
Title Page
Abstract Introduction
Conclusions References
Tables Figures
◭ ◮
◭ ◮
Back Close
Full Screen / Esc
Printer-friendly Version Interactive Discussion
Discussion
P
a
per
|
Discus
sion
P
a
per
|
Discussion
P
a
per
|
Discussion
P
a
per
|
sandy, with high content of rocks (33–36 %). Soils at the hillslopes have a 3 cm depth O-horizon and a 5 to 15 cm depth A-horizon (averaged from 10 soil profiles).
The riparian zone covers 6 % of the catchment area and on average the slope is
<10 %. Riparian soils (pH∼7) are sandy-loam with low rock content (13 %) and a 5 cm depth organic layer followed by a 30 cm depth A-horizon (averaged from 5 soil profiles). 5
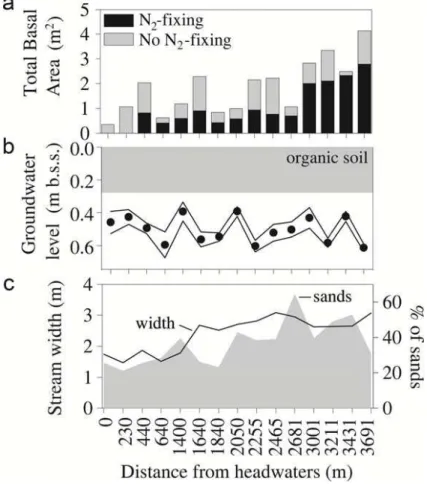
Along the 3.7 km stream reach, the width of the riparian zone increases from 6 to 32 m, and the total basal area of riparian trees increases by 12-folds (based on forest inven-tories of 30 m plots every ca. 150 m) (Fig. 2a).Alnus glutinosa,Robinia pseudoacacia,
Platanus hybrida, andFraxinus excelsior are the most abundant riparian tree species followed by Corylus avellana, Populus tremula, P. nigra, and Sambucus nigra. The 10
abundance of N2-fixing species (A. glutinosa and R. pseudoacacia) increases along the longitudinal profile, representing 0 % and>60 % of the total basal area of ripar-ian trees at the top and at the bottom of the longitudinal profile, respectively (Fig. 2a). During base flow conditions, riparian groundwater (<1.5 m from the stream channel) flows well below the soil surface (0.5±0.1 m) and thus, the interaction with the riparian 15
organic soil is minimal (averaged from 15 piezometers,n=165) (Fig. 2b). During the period of study, riparian groundwater temperature ranged from 5.3◦C to 19.5◦C.
The geomorphology of the stream bed changes along the 3.7 km stream reach. Along the first km of the longitudinal profile, the stream bed is mainly composed by rocks and cobbles (70 %) with a small contribution of sand (∼10 %), whereas at the 20
BGD
11, 11597–11634, 2014
Longitudinal patterns of stream nutrient
chemistry
S. Bernal et al.
Title Page
Abstract Introduction
Conclusions References
Tables Figures
◭ ◮
◭ ◮
Back Close
Full Screen / Esc
Printer-friendly Version Interactive Discussion
Discussion
P
a
per
|
Discus
sion
P
a
per
|
Discussion
P
a
per
|
Discussion
P
a
per
|
3 Materials and methods
3.1 Field sampling and laboratory analysis
We selected 15 sampling sites along the 3.7 km study reach. The distance between consecutive sampling sites ranged from 110 to 600 m (Fig. 1). At each sampling site, we installed a 1 m long PVC piezometer (3 cm Ø) in the riparian zone at∼1.5 m from 5
the stream channel.
We sampled stream water and riparian groundwater from each sampling site every 2 months from August 2010 to December 2011. We used pre-acid washed polyethylene bottles to collect water samples after triple-rinsing them with either stream or ground-water. On each sampling date, we also measured dissolved O2concentration (DO, in
10
mg L−1) and water temperature (T, in◦C) with an YSI ProODO device in both, stream water and in riparian groundwater. We avoid sampling soon after storms to ensure that our measurements were representative of base flow conditions, when the influence of biogeochemical processes at the riparian-stream interface on stream nutrient concen-trations and fluxes is expected to be the highest. On each sampling date and at each 15
sampling site, we measured groundwater table elevation (in m below soil surface) with a water level sensor (Eijkelkamp 11.03.30) as well as wet width (in m), stream dis-charge (Q, in L s−1), and water velocity (m s−1).Q and water velocity were estimated with the slug-addition technique by adding 1 L of NaCl-enriched solution to the stream (electrical conductivity=75–90 mS cm−1,n=11) (Gordon et al., 2004).
20
On each sampling date, we also collect stream water and measuredQ at the four main tributaries discharging to the Font del Regàs stream (Fig. 1). These data was used for mass balance calculations (see below).
Water samples were filtered through pre-ashed GF/F filters (Whatman®), and kept cold (<4◦C) until laboratory analysis (<24 h after collection). Chloride (Cl−) was used 25
as a conservative hydrological tracer and analyzed by ionic chromatography (Com-pact IC-761, Methrom). Nitrate (NO−3) was analyzed by the cadmium reduction method
BGD
11, 11597–11634, 2014
Longitudinal patterns of stream nutrient
chemistry
S. Bernal et al.
Title Page
Abstract Introduction
Conclusions References
Tables Figures
◭ ◮
◭ ◮
Back Close
Full Screen / Esc
Printer-friendly Version Interactive Discussion
Discussion
P
a
per
|
Discus
sion
P
a
per
|
Discussion
P
a
per
|
Discussion
P
a
per
|
(Keeney and Nelson, 1982) using a Technicon Autoanalyzer (Technicon, 1976). Am-monium (NH+4) was manually analyzed by the salicilate-nitropruside method (Baeth-gen and Alley, 1989) using a spectrophotometer (PharmaSpec UV-1700 SHIMADZU). Phosphate (PO34−) was manually analyzed by the acidic molybdate method (Murphy and Riley, 1962) using a spectrophotometer (PharmaSpec UV-1700 SHIMADZU). 5
3.2 Data analysis
The seasonality of biological activity at the riparian-stream interface can strongly affect both, groundwater nutrient concentrations and in-stream biogeochemical processes (Groffman et al., 1992; Hill et al., 2001). Therefore, the data set was separated in two groups based on sampling dates during the vegetative and dormant season (7 and 10
4 sampling dates, respectively). We considered the vegetative period of the riparian forest starting at the beginning of leave out (April) and ending at the peak of leave-litter fall (October), coinciding with the onset and offset of riparian tree evapotranspiration respectively (Nadal-Sala et al., 2013).
3.2.1 Longitudinal patterns in stream discharge, groundwater inputs, and
15
solute concentrations and fluxes
We examined the longitudinal pattern of stream discharge, groundwater inputs, and stream solute concentrations and fluxes along the reach for each season. On each sampling date, the contribution of groundwater inputs to surface water along the reach (Qgw) was estimated as the difference in Q between 2 consecutive sampling
20
sites (Covino et al., 2010). We calculated the instantaneous area-specific stream dis-charge (Qspf, in L km
−2
s−1) at each sampling site. We used Qspf rather than Q in
or-der to compare water and solute fluxes from the 15 nested catchments consior-dered along the 3.7 km stream reach. The instantaneous area-specific solute fluxes (Fspf, in mg km−2s−1) were calculated by multiplyingQspfby stream solute concentration (Csw)
25
BGD
11, 11597–11634, 2014
Longitudinal patterns of stream nutrient
chemistry
S. Bernal et al.
Title Page
Abstract Introduction
Conclusions References
Tables Figures
◭ ◮
◭ ◮
Back Close
Full Screen / Esc
Printer-friendly Version Interactive Discussion
Discussion
P
a
per
|
Discus
sion
P
a
per
|
Discussion
P
a
per
|
Discussion
P
a
per
|
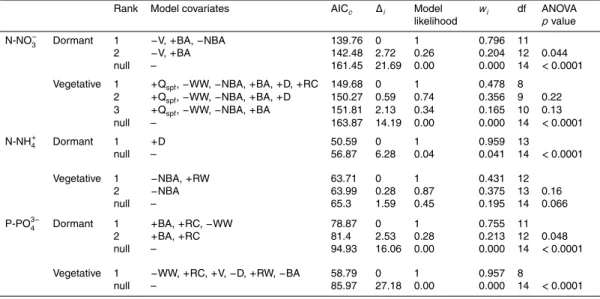
We examined the longitudinal pattern ofQgw,Qspf,Fspf, andCsw by applying simple
linear regression models. Moreover, we evaluated the degree of variability of stream water chemistry along the reach by calculating the coefficient of variation (CV) of stream solute concentrations for both, sampling sites on the same sampling date and sampling dates for each sampling site. Furthermore, we applied generalized linear 5
models (glm) to investigate whether the longitudinal pattern of Csw for each nutrient
was associated to changes in stream geomorphology, riparian groundwater, and ripar-ian forest features. For each nutrient and period, the dependent variable was the mean value obtained from all sampling dates for each sampling site along the reach. The predictor variables were distance to the upper most site (D), riparian groundwater con-10
centration for the same nutrient (RC), as well as a suite of variables related to riparian forest features and stream geomorphology. Total basal area of riparian trees (BA) and riparian width (RW) were included as proxies of the riparian forest size. The relative contribution of the basal area of N2-fixing species to BA (NBA) was included as a proxy of species composition. Stream wet width (SW), water velocity (V), and the percentage 15
of sands in stream bed (S) were included as a proxy of stream geomorphology and the size of the hyporheic zone (a major pool of heterotrophic activity) (Jones and Holmes, 1996).
For a given nutrient, we expected D to be the only significant predictor variable if the longitudinal pattern ofCsw is not related to any of the riparian and stream
predic-20
tors included in the model. We first performed a stepwise model selection based on Akaike’s Information Criteria (AIC) to select the simplest model minimizing the loss of information (min AIC) (Burnham and Anderson, 2001). For each dependent variable, we retained all models that were close to the best available model, that is those mod-els with an∆i <4, being∆i =AICi−minAIC (Burnham and Anderson, 2002). For each
25
nutrient and period, we calculated the relative likelihood (Li) for each retained model to assess which of them was the most likely (i.e., the one that maximizes the likeli-hood) (Burnham and Anderson, 2002). Moreover,Li values were normalized to obtain
BGD
11, 11597–11634, 2014
Longitudinal patterns of stream nutrient
chemistry
S. Bernal et al.
Title Page
Abstract Introduction
Conclusions References
Tables Figures
◭ ◮
◭ ◮
Back Close
Full Screen / Esc
Printer-friendly Version Interactive Discussion
Discussion
P
a
per
|
Discus
sion
P
a
per
|
Discussion
P
a
per
|
Discussion
P
a
per
|
the Akaike weights (wi =Li/Pr r=1
Lr), which can be interpreted as the probability that a model is the best model given the available data and the set of candidate models (Burnham and Anderson, 2001). Finally, we used analysis of variance tests (ANOVA) to calculate the goodness of fit of each retained model and to compare it against the best available model (Zar, 2010).
5
3.2.2 Sources of variation of stream nutrient concentration along the reach
We investigated whether the observed longitudinal patterns were driven either by ri-parian groundwater inputs, in-stream biogeochemical processing, or a combination of both. First, we explored the possibility that changes in stream nutrient concentration along the reach were related to the longitudinal variation of nutrient concentration in 10
riparian groundwater. For each period, we analyzed whether nutrient concentrations differed between stream water and riparian groundwater by using a Wilcoxon paired sum rank test (Zar, 2010). Because redox conditions can strongly control biogeochem-ical processes, we calculated an empirbiogeochem-ical chembiogeochem-ical index (CI) as a proxy of redox conditions and we compared CI values between stream water and riparian groundwa-15
ter. The CI is the logarithm of the ratio between DO and N-NH+4 concentration and thus, it shows lower values under low DO concentration than under fully aerobic conditions (Vázquez et al., 2011).
Moreover, we examined the degree of hydrological interaction at the riparian-stream edge by exploring the relationship between Cl− concentrations measured at riparian 20
BGD
11, 11597–11634, 2014
Longitudinal patterns of stream nutrient
chemistry
S. Bernal et al.
Title Page
Abstract Introduction
Conclusions References
Tables Figures
◭ ◮
◭ ◮
Back Close
Full Screen / Esc
Printer-friendly Version Interactive Discussion
Discussion
P
a
per
|
Discus
sion
P
a
per
|
Discussion
P
a
per
|
Discussion
P
a
per
|
divergences from the 1 : 1 line with the relative root mean square error (RRMSE, in %):
RRMSE=
s n P
i=1
Csw−Cgw
2
n·Cgw
·100 (1)
whereCswandCgware stream and riparian groundwater solute concentrations,
respec-tively,nis the total number of observations, andCgw is the average of Cgw. A strong
5
correlation and a low RRMSE between stream and riparian groundwater Cl− concentra-tions indicate a strong hydrological connection between the two water bodies. Similarly, we examined the correlation between riparian groundwater and stream nutrient con-centrations during the study period. We expected weak correlations and high RRMSE values between nutrient concentrations measured at the two compartments if ground-10
water nutrients are cycled at the riparian-stream edge.
Second, we investigated the influence of in-stream biogeochemical processes on the longitudinal pattern of stream nutrient concentrations by applying a mass balance approach (Roberts and Mulholland, 2007). For each nutrient, we calculated changes in stream flux between consecutive sampling sites (Fsw, in µg m
−1
s−1), beingFsw the net
15
flux resulting from in-stream uptake and release processes along a particular stream segment (von Schiller et al., 2011). We referredFswby unit of stream length in order to
compare net changes in stream flux between consecutive segments differing in length. For each sampling date and for each nutrient,Fswwas approximated with:
Fsw=(Ftop+Fef+Fgw−Fbot)/x, (2)
20
whereFtop and Fbot, are the nutrient flux at the top and at the bottom of each stream
segment, Fgw is the nutrient flux from groundwater inputs, and Fef is the nutrient flux
from effluent inputs for those reaches including a tributary (all in µg s−1).Ftop andFbot
were calculated by multiplyingQ byCsw at the top and at the bottom of the segment,
25
BGD
11, 11597–11634, 2014
Longitudinal patterns of stream nutrient
chemistry
S. Bernal et al.
Title Page
Abstract Introduction
Conclusions References
Tables Figures
◭ ◮
◭ ◮
Back Close
Full Screen / Esc
Printer-friendly Version Interactive Discussion
Discussion
P
a
per
|
Discus
sion
P
a
per
|
Discussion
P
a
per
|
Discussion
P
a
per
|
respectively. Fgw was estimated by multiplying groundwater inputs (Qgw) by nutrient
concentration in riparian groundwater (Cgw). For gaining segments (Qgw>0),Cgwwas
the average between groundwater nutrient concentration at the top and bottom of the reach. For losing segments (Qgw<0), we assumed thatCgwaveragedCtopandCbotof
each segment. For those cases in which stream segments received water from a trib-5
utary,Fefwas calculated by multiplyingQ andCat the outlet of the tributary. Finally,x
(in m) is the length of the segment between two consecutive sampling sites. The same approach was applied for Cl−, which we used as a hydrological reference because it is a conservative solute little affected by biogeochemical processes. For Cl−, we ex-pectedFsw∼0 if upstream water and riparian groundwater inputs account for most of 10
the stream Cl−flux. For nutrients,Fsw can be positive (uptake>release), negative
(up-take<release) or nil (uptake ∼release). Therefore, we expected Fsw6=0 if in-stream
uptake and release processes do not fully counterbalance each other (von Schiller et al., 2011).
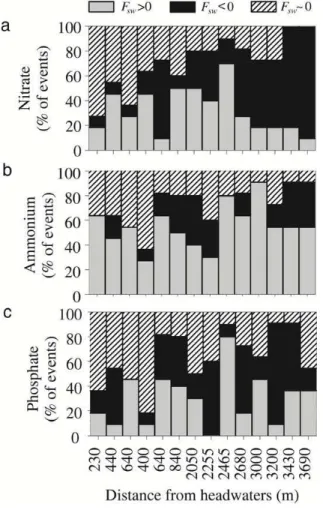
To investigate whether stream segments were consistently acting as net sinks or net 15
sources of nutrients, we calculated the frequency ofFsw>0 andFsw<0 for each
nutri-ent and for each segmnutri-ent during the period of study. For each nutrinutri-ent, we considered
Fsw6=0 when the absolute value ofFsw was larger than its standard error (SE).
More-over, we evaluated the relevance ofFsw compared to input solute fluxes by calculating
the ratio betweenFsw(in absolute values) and the total input flux (Fin) for each segment,
20
solute, and sampling date.Finwas the sum ofFtop,Fef, andFgw(the latter was included
only for gaining segments). We interpreted a high|Fsw/Fin|ratio as a strong potential of
in-stream processes to modify groundwater and upstream inputs.
All statistical analyses were carried out with R packages (stats, MASS). We chose non-parametric tests for our statistical analysis because not all data sets had a normal 25
BGD
11, 11597–11634, 2014
Longitudinal patterns of stream nutrient
chemistry
S. Bernal et al.
Title Page
Abstract Introduction
Conclusions References
Tables Figures
◭ ◮
◭ ◮
Back Close
Full Screen / Esc
Printer-friendly Version Interactive Discussion
Discussion
P
a
per
|
Discus
sion
P
a
per
|
Discussion
P
a
per
|
Discussion
P
a
per
|
4 Results
4.1 Hydrological characterization of the stream reach
During the study period, mean Qspf decreased from 9.8±1.6 [mean±SE] to 6.2±
1.3 L km−2s−1 from the top to the bottom of the reach (linear regression [ln.reg],
r2=0.79, degrees of freedom [df]=14,F =51.4,p <0.0001) (Fig. 3a). There were no 5
statistical differences inQspfbetween the dormant and vegetative period (Wilcoxon rank
sum test,p >0.05), and both seasons showed a similar longitudinal pattern. In contrast toQspf, stream Cl
−
concentrations showed a 40 % increase along the reach (ln.reg,
r2=0.88, df=14,F =44.6,p <0.0001) (Fig. 3b). The two seasons showed a similar longitudinal pattern, though stream Cl− concentrations were lower during the dormant 10
than during the vegetative period (Wilcoxon rank sum test,Z=−6.4,p <0.0001) (Ta-ble 1). During the period of study, the CV of Cl− concentrations for a given sampling site ranged from 22.5 % to 39.6 %, though this variability did not follow a longitudinal pattern (ln.reg,p >0.05).
There was a strong correlation between stream and riparian groundwater Cl− con-15
centrations, and the relationship between them resulted in low RRMSE values for both, the dormant and vegetative periods (Fig. 4a and Table 2). On average, stream seg-ments along the reach gained water from groundwater at a rate of 0.34±0.2 L km−2s−1, which represented ca. 5 % of meanQspf (Fig. 3c). No stream segment was either
con-sistently gaining or losing water over time. All the segments lost water towards the 20
riparian zone at least on one occasion, and 3 of them lost water in>60 % of the sam-pling dates. Stream water loses towards the riparian zone (Qgw<0 L km
−2
s−1) were detected during 39 % and 43 % of the cases during the dormant and vegetative period, respectively.
The mean net change in Cl− flux within stream segments was 0.1±0.04 mg m−1s−1, 25
which was a small fraction of the total Cl− input flux (|Fsw/Fin|<10 %). Thus, the mass
BGD
11, 11597–11634, 2014
Longitudinal patterns of stream nutrient
chemistry
S. Bernal et al.
Title Page
Abstract Introduction
Conclusions References
Tables Figures
◭ ◮
◭ ◮
Back Close
Full Screen / Esc
Printer-friendly Version Interactive Discussion
Discussion
P
a
per
|
Discus
sion
P
a
per
|
Discussion
P
a
per
|
Discussion
P
a
per
|
balance approach indicated that the stream Cl− flux was mainly explained by upstream water and riparian groundwater inputs, and that additional water sources were unlikely.
4.2 Variability of stream nutrient concentrations and fluxes along the reach
Stream nutrient concentrations varied over space (along the stream for the same sam-pling date) and over time (among samsam-pling dates for a single samsam-pling site). On a single 5
date, the CV of stream nutrient concentrations along the reach averaged 27 %, 36 % and 51 % for NO−3, NH+4, and PO34− respectively, being this CV similar between the dor-mant and vegetative period (Wilcoxon rank sum test, for the three nutrientsp >0.05). The CV of stream NO−3 and NH+4 concentrations did not show a longitudinal pattern (in the two cases, ln.reg,p >0.05), while it decreased along the reach for PO34−(r2=0.56, 10
df=14,F =16.9,p <0.005). For a given sampling site, the CV of stream nutrient con-centration during the study period averaged 47 %, 41 %, and 53 % for NO−3, NH+4, and PO34−, respectively. Thus, the variability of stream NO−3 concentrations was higher over time than over space, though differences in concentration between the dormant and vegetative period were not statistically significant (Wilcoxon rank sum test, p >0.05) 15
(Table 1). In contrast, stream NH+4 and PO34− concentrations were higher during the vegetative than during the dormant period (Wilcoxon rank sum test,ZNH4=−3.5 and
ZPO4=−6.6, for both nutrientsp <0.001) (Table 1).
The longitudinal pattern of stream nutrient concentrations differed between seasons. During the dormant period, mean stream NO−3 concentration decreased along the 20
reach from 285±30 to 222±33 µg N-NO−3L−1, especially along the first km (ln.reg,
r2=0.47, df=15,F =11.4,p <0.005) (Fig. 5a). According to the glm results, this de-crease was positively related to the basal area of riparian trees (BA), and negatively related to both, water velocity (V) and abundance of N2-fixing species (NBA) (Table 3).
During the vegetative period, mean stream NO−3 concentrations increased by 60 % 25
BGD
11, 11597–11634, 2014
Longitudinal patterns of stream nutrient
chemistry
S. Bernal et al.
Title Page
Abstract Introduction
Conclusions References
Tables Figures
◭ ◮
◭ ◮
Back Close
Full Screen / Esc
Printer-friendly Version Interactive Discussion
Discussion
P
a
per
|
Discus
sion
P
a
per
|
Discussion
P
a
per
|
Discussion
P
a
per
|
the variability of stream NO−3 concentrations during the vegetative period included vari-ables related to both, stream geomorphology (Qand WW) and riparian features (NBA and BA) (Table 3).
During the dormant period, stream NH+4 concentration increased from 9±1 to 10±2 µg N-NH+4L−1 along the reach (ln.reg, r2=0.42, df=15, F =9.6, p <0.01) 5
(Fig. 5b). In contrast, no clear longitudinal pattern was observed for stream NH+4 con-centrations during the vegetative period (Fig. 5b). None of the predictors included in the glm accounted for the longitudinal variability of stream NH+4 concentrations during either, the dormant or vegetative period (Table 3).
Stream PO34− concentrations showed an increasing longitudinal trend during the 10
two seasons (dormant: ln.reg,r2=0.53,F =14.6, df=14,p <0.01; vegetative: ln.reg,
r2=0.46,F =11.21, df=14,p <0.01) (Fig. 5c). For the two seasons, this longitudinal pattern was partially explained by the concentration of PO34− in riparian groundwater (RC) among other variables related to both, stream geomorphology and riparian fea-tures (Table 3).
15
Stream nutrient fluxes along the reach were strongly influenced by the longitudinal pattern of stream discharge, especially for NO−3 and NH+4 for which the area-specific flux (Fspf) decreased along the reach during the two seasons (Fig. 5a and b). In contrast,
theFspffor PO 3−
4 did not follow any clear longitudinal pattern during either, the dormant
or vegetative period (Fig. 5c). 20
4.3 Sources of longitudinal variation in stream nutrient concentration: riparian groundwater inputs and in-stream nutrient processing
The relationship between stream and riparian groundwater concentrations differed be-tween nutrients and seasons. During the dormant period, stream and riparian ground-water NO−3 concentrations were similar, while mean stream NO−3 was 30 % higher than 25
in riparian groundwater during the vegetative period (Table 1). During the two seasons, stream and riparian groundwater NO−3 concentrations were positively correlated and
BGD
11, 11597–11634, 2014
Longitudinal patterns of stream nutrient
chemistry
S. Bernal et al.
Title Page
Abstract Introduction
Conclusions References
Tables Figures
◭ ◮
◭ ◮
Back Close
Full Screen / Esc
Printer-friendly Version Interactive Discussion
Discussion
P
a
per
|
Discus
sion
P
a
per
|
Discussion
P
a
per
|
Discussion
P
a
per
|
showed relatively small RRMSE (Fig. 4b and Table 2). On average, stream NH+4 con-centrations were 2.5 fold lower than in riparian groundwater (Table 1), and there was no correlation between them during either the dormant or vegetative period (Fig. 4c and Table 2). During the dormant period, stream and riparian groundwater PO34− concen-trations were similar and showed a significant correlation between them (Tables 1 and 5
2). During the vegetative period, PO34− concentrations were 2-fold lower in the stream than in riparian groundwater (Table 1), they showed no correlation, and relatively high RRMSE (Fig. 4d and Table 2). These differences in nutrient concentrations between the two water bodies were accompanied by lower chemical index values in riparian groundwater than in stream water (Table 1).
10
The influence of in-stream biogeochemical processing on stream fluxes differed among nutrients. During the study period, mean Fsw was positive for NH+4 (0.6±
0.2 µg N m−1s−1) and PO43− (0.2±0.4 µg P m−1s−1), indicating that on average the stream was acting as a net sink for these nutrients. In contrast, meanFswwas negative
for NO−3 (−0.5±1 µg N m−1s−1), indicating that in-stream NO−3 release prevailed over 15
uptake. The magnitude ofFswshowed no consistent longitudinal pattern for any nutrient
for either the vegetative or dormant period (for the three nutrients, ln.reg,p >0.05). The capacity of in-stream processes to change stream input fluxes was smaller for NO−3 (|Fsw/Fin|=11±1 %) than for NH+4 and PO
3−
4 (|Fsw/Fin|=27±2 % and 29.5±2 %,
respectively). Yet, the frequency of sampling dates for which in-stream NO−3 uptake 20
and release did not counterbalance each other (Fsw∼0 µg N m− 1
s−1) increase along the reach (Fig. 6a), especially during the vegetative period (ln.reg,r2=0.71, df=13,
F =28.8, p <0.001). This longitudinal pattern was accompanied by an increase in the frequency of dates for which in-stream NO−3 release prevailed over uptake (Fsw<
0 µg N m−1s−1) (ln.reg,r2=0.55, df=13,F =14.6,p <0.01). For NH+4 and PO34−, the 25
BGD
11, 11597–11634, 2014
Longitudinal patterns of stream nutrient
chemistry
S. Bernal et al.
Title Page
Abstract Introduction
Conclusions References
Tables Figures
◭ ◮
◭ ◮
Back Close
Full Screen / Esc
Printer-friendly Version Interactive Discussion
Discussion
P
a
per
|
Discus
sion
P
a
per
|
Discussion
P
a
per
|
Discussion
P
a
per
|
5 Discussion
The aim of this study was to gain understanding on the potential of biogeochemical pro-cesses at the riparian-stream interface (including the riparian zone, the riparian-stream edge, and the stream channel) to modify stream nutrient concentrations. To approach this objective, we adopted a longitudinal approach along a headwater forested stream 5
to investigate whether biogeochemical processes at the riparian-stream interface were capable of controlling stream nutrient chemistry at the ecosystem level. We chose a 3.7 km stream reach that covered a 300 m elevation gradient within a headwater forested catchment showing remarkable changes in riparian characteristics compared to hillslope physiographic features, which remained fairly similar with increasing catch-10
ment size. One of the novelties of this study is that we analyzed longitudinal patterns of stream water together with changes in riparian groundwater to chase the influence of biogeochemical transformation at the riparian-stream edge on stream nutrient chem-istry. Another keen aspect of the study is that we explored the influence of changes in riparian size and composition on stream nutrient concentration. Despite the inherent 15
limitations of performing empirical studies at relatively large spatial scales, our results shed light on the spatial variation of biogeochemical processes at the riparian-stream interface from headwaters to the valley bottom, and further, on their potential to regu-late stream nutrient chemistry at the ecosystem level.
We found that gradual increases in stream width (2-fold), riparian width (5-fold), ripar-20
ian tree basal area (12-fold), and in the abundance of N2-fixing riparian trees (from 0 to
60 % of the total basal area) along the reach were accompanied by changes in stream nutrient concentrations, which could vary from 27–51 % on a single date. Moreover, variability in nutrient concentrations was not random but followed gradual longitudinal patterns, though only during the dormant period for NO−3 and NH+4. Longitudinal pat-25
terns in stream chemistry can result solely from hydrological mixing of different solute concentrations discharging from hillslopes, which is usually accompanied by a reduc-tion in the variability of solute concentrareduc-tions as catchment size increases (e.g., Asano
BGD
11, 11597–11634, 2014
Longitudinal patterns of stream nutrient
chemistry
S. Bernal et al.
Title Page
Abstract Introduction
Conclusions References
Tables Figures
◭ ◮
◭ ◮
Back Close
Full Screen / Esc
Printer-friendly Version Interactive Discussion
Discussion
P
a
per
|
Discus
sion
P
a
per
|
Discussion
P
a
per
|
Discussion
P
a
per
|
et al., 2009). At the Font del Regàs, the CV of stream solute concentrations did not decrease along the reach, suggesting that the observed longitudinal patterns were not simply because of the mixing of hillslope groundwater as the catchment becomes larger. An exception was found for PO34−, an indication that the longitudinal increase in PO34−at Font del Regàs could partially result from mixing of hillslope water sources with 5
different PO34− concentrations as previously described for base cations (Asano et al., 2009).
Stream Cl− concentrations showed a 40 % increase along the reach which was accompanied by a decrease in area-specific stream discharge. Moreover, we found higher Cl− concentrations during the vegetative than during the dormant period, and 10
higher Cl− concentrations at the main stream than at the tributaries. These results sug-gest that the drop in specific discharge and the increase in Cl− concentration along the reach were due to increased evapotranspiration at lower elevations (Grimaldi et al., 2009). Alternatively, a longitudinal decrease in area-specific stream discharge could be explained by an increase in hydrological retention at the valley bottom compared to 15
upstream segments (Covino et al., 2010). However, net groundwater inputs tended to be positive along the reach and showed no consistent longitudinal pattern, suggesting that overall this was a net gaining reach and that an increase in hydrological retention at the valley bottom was unlikely.
5.1 Factors controlling the longitudinal pattern of stream nutrient
20
concentrations and fluxes
Our hypothesis was that nutrient concentrations should decrease along the reach if riparian and stream ecosystems were efficient in taking up nutrients from receiving wa-ters. We found a decreasing longitudinal pattern of stream NO−3 concentrations, though only during the dormant period. On average, stream processes contributed to in-25
BGD
11, 11597–11634, 2014
Longitudinal patterns of stream nutrient
chemistry
S. Bernal et al.
Title Page
Abstract Introduction
Conclusions References
Tables Figures
◭ ◮
◭ ◮
Back Close
Full Screen / Esc
Printer-friendly Version Interactive Discussion
Discussion
P
a
per
|
Discus
sion
P
a
per
|
Discussion
P
a
per
|
Discussion
P
a
per
|
longitudinal decrease in NO−3 concentrations was mainly controlled by riparian ground-water inputs, as also reported for other headground-water streams (Bernhardt et al., 2002; Asano et al., 2009; Scanlon et al., 2010).
During the vegetative period, stream NO−3 concentration increased along the down-iest part of the reach where both, the basal area of riparian trees and the proportion 5
of N2-fixing species were the highest. Previous studies in temperate and boreal forests
have pointed out that N2-fixing species such Alder sp. can increase N availability in
riparian ecosystems (Helfield and Naiman, 2002), or even control hydrological N ex-port at the whole catchment scale (Compton et al., 2003). In Mediterranean regions, the invasive N2-fixingAcacia sp. can have a dramatic impact on soil nutrient cycling,
10
by increasing N availability and decreasing C : N ratios which accelerates both, N and P soil mineralization (Stock et al., 1995). The impact of this species on stream nutri-ent export can become larger when invasion occurs in near-stream areas because soil available nutrients can be quickly leached to the stream (Ross et al., 2012). Support-ing this hypothesis, Lupon et al. (2014) reported immediate increases in stream NO−3 15
concentration at the downiest part of the catchment after periods of high nitrification in these riparian soils, which usually occur in spring and summer. However, we could not establish any positive relationship between the proportion of N2-fixing tree species and stream NO−3 concentrations along the reach. The simplest explanation for the in-crease in stream NO−3 concentrations at the valley bottom was the prevalence of in-20
stream NO−3 release during the vegetative period (64 % of the sampling dates showed
Fsw<0 µg N m− 1
s−1). This finding together with the significant decrease of dates with
Fsw∼0 µg N m− 1
s−1(<6 %) suggest that in-stream nutrient cycling in general, and ni-trification in particular, was enhanced at the valley bottom during the vegetative pe-riod likely because of warming-induced mineralization (Strauss and Lamberti, 2000; 25
Bernhardt et al., 2002). Further studies would be needed for a better understanding of environmental controls favoring in-stream NO−3 release at the valley bottom in this headwater stream.
BGD
11, 11597–11634, 2014
Longitudinal patterns of stream nutrient
chemistry
S. Bernal et al.
Title Page
Abstract Introduction
Conclusions References
Tables Figures
◭ ◮
◭ ◮
Back Close
Full Screen / Esc
Printer-friendly Version Interactive Discussion
Discussion
P
a
per
|
Discus
sion
P
a
per
|
Discussion
P
a
per
|
Discussion
P
a
per
|
Stream nutrient fluxes tended to decrease along the reach, though this pattern was explained mainly by the reduction in specific discharge. In fact, stream nutrient con-centrations increased from the top to the bottom of the reach for all nutrients (except for NO−3 during the dormant period). The most remarkable case was the pronounced longitudinal increase in stream PO34− concentration which even offset the decrease in 5
specific discharge to the point that stream flux did not decrease along the reach for this nutrient. We used spring water samples from a parallel study to evaluate the possibility that the longitudinal increase in stream nutrient concentrations resulted from a propor-tional increase in concentrations in hillslope groundwater (Lupon, unpublished). There were no differences in concentration between springs at low (500–650 m a.s.l.) and high 10
elevations (800–1200 m a.s.l.) for NO−3 and NH+4 (for the two solutes, Wilcoxon rank sum test,p >0.05), while PO34−concentrations tended to be higher and more variable at the formers than at the latters (Wilcoxon rank sum test,p=0.04). These findings together with the small differences in concentration between stream and riparian groundwater further suggest that hillslope groundwater chemistry drove, at least partially, the longitu-15
dinal pattern of stream PO34− concentrations at Font del Regàs. In contrast, differences in NO−3 and NH+4 concentration were as large as, or even larger, between hillslope and riparian groundwater than between riparian groundwater and stream water (Fig. 8a and b), bearing the idea that the biogeochemical cycling of dissolved inorganic nitrogen is high at the riparian-stream interface (e.g. Martí et al., 2000).
20
5.2 Riparian-stream edge and in-stream nutrient transformations
Similar to previous plot-scale studies, stream and riparian groundwater Cl− concentra-tions showed a strong correlation between each other, suggesting a high hydrological connectivity at the riparian-stream edge along the reach (e.g., Butturini et al., 2003). Consequently, one would expect a strong influence of riparian groundwater chem-25
concentra-BGD
11, 11597–11634, 2014
Longitudinal patterns of stream nutrient
chemistry
S. Bernal et al.
Title Page
Abstract Introduction
Conclusions References
Tables Figures
◭ ◮
◭ ◮
Back Close
Full Screen / Esc
Printer-friendly Version Interactive Discussion
Discussion
P
a
per
|
Discus
sion
P
a
per
|
Discussion
P
a
per
|
Discussion
P
a
per
|
tions, this relationship was from moderate to weak for NO−3 and PO−4, and nil for NH+4. Our findings support the well-established idea that biogeochemical processing at the riparian-stream edge and within the stream channel can be high enough to modify nu-trient concentrations from riparian sources (McClain et al., 2003; Harms and Grimm, 2008).
5
This pattern was especially noticeable for streamwater NH+4 that showed no cor-relation with NH+4 concentration in riparian groundwater or with any of the available variables related to the riparian forest. Nitrogen transformations at the riparian-stream edge may be favored by the strong change in redox conditions between groundwa-ter and stream wagroundwa-ter that were more reduced in the former than in the lagroundwa-ter, as typ-10
ically reported in the literature (Hill et al., 1998; Dent et al., 2007). Concordantly, NH+4 concentrations were higher in riparian groundwater than in the stream while the opposite occurred for NO−3 (especially during the vegetative period). Our results suggest fast NH+4 nitrification at the riparian-stream edge and within the stream as environmental conditions become well oxygenated (Jones et al., 1995). Supporting 15
this idea, we found that in-stream uptake prevailed over release along the reach for NH+4 (mean Fsw∼0.6 µg N m−
1
s−1) while the opposite occurred for NO−3 (mean
Fsw∼ −0.5 µg N m− 1
s−1).
Our results highlight that the contribution of in-stream biogeochemical cycling to change input stream fluxes was 2- to 3-folds higher for NH+4 and PO34− (|Fsw/Fin|=26
20
and 29 %, respectively) than for NO−3 (|Fsw/Fin|=11 %). These results support
previ-ous evidence that the former nutrients are cycled more efficiently than the latter in headwater streams (Peterson et al., 2001; Ensign and Doyle, 2006) and thus, that the contribution of in-stream processes to regulate stream nutrient dynamics may be higher for NH+4 and PO34− than for NO−3. However, we found that longitudinal trends in 25
stream nutrient concentration were not consistent with the predominant in-stream pro-cesses, likely because in-stream biogeochemical cycling did not systematically lead to net uptake or release along the reach for a given nutrient. Moreover, our generalized linear model approach indicated that the best candidate models matching NO−3 and
BGD
11, 11597–11634, 2014
Longitudinal patterns of stream nutrient
chemistry
S. Bernal et al.
Title Page
Abstract Introduction
Conclusions References
Tables Figures
◭ ◮
◭ ◮
Back Close
Full Screen / Esc
Printer-friendly Version Interactive Discussion
Discussion
P
a
per
|
Discus
sion
P
a
per
|
Discussion
P
a
per
|
Discussion
P
a
per
|
PO34− concentrations included variables not only related to stream geomorphology but also variables more directly related to the riparian zone such as riparian groundwater and total tree basal area (for NO−3 and PO34−), riparian width (for PO34−), or the pro-portion of N2-fixing species (for NO−3). Similar to previous studies, our results suggest
that groundwater inputs as well as riparian forest features are strong controls of stream 5
water chemistry, and can override the effect of in-stream biogeochemical processing on the longitudinal variation of stream nutrient concentrations (Acuña and Dahm, 2007; Brookshire et al., 2009; Scanlon et al., 2010).
6 Conclusions
The longitudinal approach adopted at the Font del Regàs stream highlights that the 10
potential for biogeochemical transformations at the riparian-stream edge and within the stream was high from the headwaters to the valley bottom. Our study indicates that stream nutrient concentrations along the reach did not mimic riparian groundwater inputs, but that dissolved nutrients underwent through profound biogeochemical trans-formation while travelling throughout the riparian-stream edge and along the stream 15
channel, especially for NH+4, but also for NO−3 and PO34−. Our results support previous studies performed at smaller spatial scales showing that the influence of in-stream bio-geochemical processing on stream nutrient concentrations is more important for NH+4 and PO34− than for NO−3 which shows a more conservative behavior. These results add to the growing evidence that in-stream biogeochemical processes may be taken 20
into consideration in either empirical or modeling approaches in we are to understand drivers of stream nutrient chemistry within landscapes.
Although the influence of in-stream biogeochemical processes on stream nutrient fluxes was remarkable, longitudinal trends in stream nutrient concentration were not consistent with the predominant in-stream processes, likely because the latters did 25
BGD
11, 11597–11634, 2014
Longitudinal patterns of stream nutrient
chemistry
S. Bernal et al.
Title Page
Abstract Introduction
Conclusions References
Tables Figures
◭ ◮
◭ ◮
Back Close
Full Screen / Esc
Printer-friendly Version Interactive Discussion
Discussion
P
a
per
|
Discus
sion
P
a
per
|
Discussion
P
a
per
|
Discussion
P
a
per
|
Moreover, we found that groundwater inputs and riparian forest features were impor-tant drivers of the spatial variation of NO−3 and PO34− concentrations along the stream. Despite the capacity of in-stream processes to transform nutrients, our study shows that the influence of terrestrial sources on the longitudinal variation of stream nutri-ent concnutri-entrations can offset the effect of in-stream nutrient cycling on stream water 5
chemistry.
Author contribution. S. B., F. S., and E. M. designed the experiment. S. B, A. L., M. R., and F. S. carried them out. A. L. performed all laboratory analysis. S. B. analyzed the data set and prepared the manuscript with contributions from A. L., M. R., and E. M.
Acknowledgements. We thank A. Oltra for assisting with GIS, and S. Poblador, E. Martín, and 10
C. Romero for field assistance. S.B. and A.L. were funded by the Spanish Ministry of Econ-omy and Competitiveness (MINECO) with a Juan de la Cierva contract (JCI-2010-06397) and a FPU grant (AP-2009-3711). S.B received additional funds from the Spanish Research Coun-cil (CSIC) with the contract JAEDOC027. M. Ribot was funded by a technical training contract from the MINECO-funded project ISONEF and MED_FORESTREAM (CGL2008-05504-C02-15
02/BOS and CGL2011-30590). Financial support was provided by the European Union-funded project REFRESH (FP7-ENV-2009-1-244121) and the MINECO-funded projects MONTES-Consolider (CSD 2008-00040), and MED_FORESTREAM. The Vichy Catalan Company, the Regàs family and the Catalan Water Agency (ACA) graciously gave us permission for at the Font del Regàs catchment.
20
References
Acuña, V. and Dahm, C. N.: Impact of monsoonal rains on spatial scaling patterns in water chemistry of a semiarid river network, J. Geophys. Res., 112, G04009, doi:10.1029/2007JG000493, 2007.
Asano, Y., Uchida, T. M., Mimasu, Y., and Ohte, N.: Spatial patterns of stream solute concen-25
trations in a steep mountainous catchment with a homogeneous landscape, Water Resour. Res., 45, W10432, doi:10.1029/2008WR007466, 2009.
BGD
11, 11597–11634, 2014
Longitudinal patterns of stream nutrient
chemistry
S. Bernal et al.
Title Page
Abstract Introduction
Conclusions References
Tables Figures
◭ ◮
◭ ◮
Back Close
Full Screen / Esc
Printer-friendly Version Interactive Discussion
Discussion
P
a
per
|
Discus
sion
P
a
per
|
Discussion
P
a
per
|
Discussion
P
a
per
|
Àvila, A. and Rodà, F.: Changes in atmospheric deposition and streamwater chemistry over 25 years in undisturbed catchments in a Mediterranean mountain environment, Sci. Total Environ., 434, 18–27, 2012.
Baethgen, W. and Alley, M.: A manual colorimetric procedure for ammonium nitrogen in soil and plant Kjeldahl digests, Commun. Soil Sci. Plan., 20, 961–969, 1989.
5
Bernhardt, E. S., Hall, R. O., and Likens, G. E.: Whole-system estimates of nitrification and nitrate uptake in streams of the Hubbard Brook Experimental Forest, Ecosystems, 5, 419– 430, 2002.
Bernhardt, E. S., Likens, G. E., Buso, D. C., and Driscoll, C. T.: In-stream uptake dampens effects of major forest disturbance on watershed nitrogen export, P. Natl. Acad. Sci. USA, 10
100, 10304–10308, 2003.
Bohlen, P. J., Groffman, P. M., Driscoll, C. T., Fahey, T. J., and Siccama, T. G.: Plant-soil-microbial interactions in a northern hardwood forest, Ecology, 82, 965–978, 2001.
Bormann, F. H. and Likens, G. E.: Nutrient cycling, Science, 155, 424–429, 1967.
Brookshire, E. N. J., Valett, H. M., and Gerber, S. G.: Maintenance of terrestrial nutrient loss 15
signatures during in-stream transport, Ecology, 90, 293–299, 2009.
Butturini, A., Bernal, S., Nin, E., Hellín, C., Rivero, L., Sabater, S., and Sabater, F.: Influ-ences of stream groundwater hydrology on nitrate concentration in unsaturated riparian area bounded by an intermittent Mediterranean stream, Water Resour. Res., 39, 1110, doi:10.1029/2001WR001260, 2003.
20
Burnham, K. P. and Anderson, D. R.: Kullback–Leibler information as a basis for strong infer-ence in ecological studies, Wildlife Res., 28, 111–119, 2001.
Burnham, K. P. and Anderson, D. R.: Model selection and multimodel inference: a practical information-theoretic approach, 2nd edn., Springer-Verlag, New York, 2002.
Compton, J. E., Robbin Church, M., Larned, S. T., and Hogsett, W. E.: Nitrogen export from 25
forested watershed in the Oregon Coast Range: the role of N2-fixing red alder, Ecosystems, 6, 773–785, 2003.
Covino, T. P. and McGlynn, B. L.: Stream gains and losses across a mountain-to-valley transi-tion: impacts on watershed hydrology and stream water chemistry, Water Resour. Res., 43, W10431, doi:10.1029/2006WR005544, 2007.
30
BGD
11, 11597–11634, 2014
Longitudinal patterns of stream nutrient
chemistry
S. Bernal et al.
Title Page
Abstract Introduction
Conclusions References
Tables Figures
◭ ◮
◭ ◮
Back Close
Full Screen / Esc
Printer-friendly Version Interactive Discussion
Discussion
P
a
per
|
Discus
sion
P
a
per
|
Discussion
P
a
per
|
Discussion
P
a
per
|
Dent, C. L. and Grimm, N. B.: Spatial heterogeneity of stream water nutrient concentrations over successional time, Ecology, 80, 2283–2298, 1999.
Dent, C. L., Grimm, N. B., Martí, E., Edmonds, J. W., Henry, J. C., and Welter, J. R.: Variability in surface-subsurface hydrologic interactions and implications for nutrient retention in an arid-land stream, J. Geophys. Res., 112, G04004, doi:10.1029/2007JG000467, 2007.
5
Ensign, S. H. and Doyle, M. W.: Nutrient spiraling in streams and river networks, J. Geophys. Res., 111, G04009, doi:10.1029/2005JG000114, 2006.
Gordon, N. D., McMahon, T. A., Finlayson, B. L., Gippel, C. J., and Nathan, R. J.: Stream Hydrology: an Introduction for Ecologists, Wiley, West Sussex, UK, 2004.
Groffman, P. M., Gold, A. J., and Simmons, R. C.: Nitrate dynamics in riparian forests: microbial 10
studies, J. Environ. Qual., 21, 666–671, 1992.
Grimaldi, C., Fossey, M., Fauvel, Y., and Merot, P.: High chloride concentrations in the soil and groundwater under an oak hedge in the West of France: an indicator of evapotranspiration and water movement, Hydrol. Process., 23, 1865–1873, 2009.
Harms, T. K. and Grimm, N. B.: Hot spots and hot moments of carbon and nitrogen dynamics 15
in a semiarid riparian zone, J. Geophys. Res., 113, G01020, doi:10.1029/2007JG000588, 2008.
Hedin, L. O., von Fisher, J. C., Ostrom, N. E., Kennedy, B. P., Brown, M. G., and Robert-son, G. P.: Thermodynamic constraints on nitrogen transformations and other biogeochemi-cal processes at soil-stream interfaces, Ecology, 79, 684–703, 1998.
20
Helfield, J. M. and Naiman, R. J.: Salmon and alder as nitrogen sources to riparian forests in a boreal Alaskan watershed, Oecologia, 133, 573–582, doi:10.1007/s00442-002-1070-x, 2002.
Hill, A. R., Labadia, C. F., and Sanmugadas, K.: Hyporheic zone hydrology and nitrogen dy-namics in relation to the streambed topography of a N-rich stream, Biogeochemistry, 42, 25
285–310, 1998.
Hill, W. R., Mulholland, P. J., and Marzolf, E. R.: Stream ecosystem response to forest leaf emergence in spring, Ecology, 82, 2306–2319, 2001.
Houlton, B. Z., Driscoll, C. T., Fahey, T. J., Likens, G. E., Groffman, P. M., Bernhardt, E. S., and Buso, D. C.: Nitrogen dynamics in ice-storm-damaged forest ecosystems: implications 30
for nitrogen limitation theory, Ecosystems, 6, 431–443, 2003.
Institut Cartografic de Catalunya (ICC): Orthophotomap of Catalunya 1 : 25 000, Generalitat de Catalunya, Departament de Política Territorial i Obres, 2010.
BGD
11, 11597–11634, 2014
Longitudinal patterns of stream nutrient
chemistry
S. Bernal et al.
Title Page
Abstract Introduction
Conclusions References
Tables Figures
◭ ◮
◭ ◮
Back Close
Full Screen / Esc
Printer-friendly Version Interactive Discussion
Discussion
P
a
per
|
Discus
sion
P
a
per
|
Discussion
P
a
per
|
Discussion
P
a
per
|
Jencso, K. G., McGlynn, B. L., Gooseff, M. N., Bencala, K. E., and Wondzell, S. M.: Hills-lope hydrologic connectivity controls riparian groundwater turnover: implications of catch-ment structure for riparian buffering and stream water sources, Water Resour. Res., 46, W10524, doi:10.1029/2009WR008818, 2010.
Johnson, C. E., Driscoll, C. T., Siccama, T. G., and Likens, G. E.: Element fluxes and land-5
scape position in a northern hardwood forest watershed ecosystem, Ecosystems, 3, 159– 184, 2000.
Jones, J. B. and Holmes, R. M.: Surface-subsurface interactions in stream ecosystems, Trends Ecol. Evol., 11, 239–242, 1996.
Jones Jr., J. B., Fisher, S. G., and Grimm, N. B.: Nitrification in the hyporheic zone of a desert 10
stream ecosystem, J. N. Am. Benthol. Soc., 14, 249–258, 1995.
Keeney, D. R. and Nelson, D. W.: Nitrogen-inorganic forms. Methods of soil analysis. Part 2. in: Agronomy Monography, 9, ASA and SSSA, Madison, WI, 643–698, 1982.
Lawrence, G. B., Lovett, G. M., and Baevsky, Y. H.: Atmospheric deposition and watershed nitrogen export along an elevational gradient in the Castkills Mountains, New York, Biogeo-15
chemistry, 50, 21–43, 2000.
Likens, G. E. and Buso, D. C.: Variation in streamwater chemistry throughout the Hubbard Brook Valley, Biogeochemistry, 78, 1–30, doi:10.1007/s10533-005-2024-2, 2006.
Lupon, A., Bernal, S., and Sabater, F.: Environmental factors controlling pulses of soil nitrogen cycling in hillslopes and riparian Mediterranean forests, Biogeochemistry, in review, 2014. 20
Martí E., Grimm, N. B., and Fisher, S. G.: Pre- and post-flood retention efficiency of nitrogen in a Sonoran Desert stream, J. N. Am. Benthol. Soc., 16, 805–819, 1997.
Martí, E., Fisher, S. G., Schade, J. D., and Grimm, N. B.: Flood-frequency and stream-riparian linkages in arid lands, in: Streams and Ground Waters, edited by: Jones, J. B. and Mulhol-land, P. J., Academic Press, London, UK, 2000.
25
Mayer, P. M., Reynolds Jr., S. K., McCutchen, M. D. and Canfield, T. J.: Meta-analysis of nitrogen removal in riparian buffers, J. Environ. Qual., 36, 1172–1180, doi:10.2134/jeq2006.0462 , 2007.
McClain, M. E., Boyer, E. W., Dent, C. L., Gergel, S. E., Grimm, N. B., Groffman, P. M., Hart, S. C., Harvey, J. W., Johnston, C. A., Mayorga, E., McDowell, W. H., and Pinay, G.: 30
![Table 1. Average ± SE of stream and riparian groundwater solute concentrations and chemical index (Cl = ln [DO] / [NH 4 ]) for both, the dormant and vegetative period](https://thumb-eu.123doks.com/thumbv2/123dok_br/18366929.354833/29.918.100.585.250.499/table-average-riparian-groundwater-concentrations-chemical-dormant-vegetative.webp)