Planktonic production and respiration in a subtropical lake
dominated by Cyanobacteria
Tonetta, D.
a*
, Laudares-Silva, R.
band Petrucio, MM.
aaLaboratório de Ecologia de Águas Continentais, Programa de Pós-Graduação em Ecologia, Departamento de Ecologia e Zoologia, Universidade Federal de Santa Catarina – UFSC,
Campus Universitário, s/n, Trindade, CEP 88040-900, Florianópolis, SC, Brazil
bLaboratório de Ficologia, Departamento de Botânica, Universidade Federal de Santa Catarina – UFSC, Campus Universitário, s/n, Trindade, CEP 88040-900, Florianópolis, SC, Brazil
*e-mail: denisetonetta@yahoo.com.br
Received: October 10, 2013 – Accepted: December 17, 2013 – Distributed: May 31, 2015
(With 7 figures)
Abstract
Planktonic primary production and respiration rates were estimated in a subtropical coastal lake dominated by Cyanobacteria in order to investigate the temporal and vertical variation in this lake and to evaluate its relationships with limnological variables and phytoplankton. Light and dark bottles were incubated at four different depths in the central part of the lake and were performed bimonthly from June/2009 to December/2010. No significant difference was evident among depths in relation to phytoplankton, limnological variables and metabolic rates. However, the highest production rates were recorded at the surface, and decreased towards the bottom, coupled with phytoplanktonic photosynthetic capacity. Wind induced mixing in Peri Lake played an important role in nutrient and phytoplankton redistribution, characterizing this lake as polymictic. According to density and biovolume, the phytoplankton community was dominated by filamentous Cyanobacteria, especially Cylindrospermopsis raciborskii (Woloszynska) Seenayya and Subba-Raju. This study has shown that both water temperature and nutrient availability drive phytoplankton growth and consequently the temporal variation in metabolic rates, where respiration is higher than primary production.
Keywords: subtropical coastal lake, primary production, respiration, phytoplankton, Cylindrospermopsis raciborskii.
Produção e respiração planctônicas em uma lagoa subtropical
dominada por cianobactérias
Resumo
As taxas de produção primária e respiração planctônicas foram estimadas em um lago costeiro subtropical dominado por cianobactérias, com o objetivo de investigar a variação temporal e vertical nesta lagoa e avaliar suas relações com as variáveis limnológicas e os grupos fitoplanctônicos. Garrafas claras e escuras foram incubadas em quatro diferentes profundidades na parte central da lagoa e foram realizadas bimensalmente de junho/2009 a dezembro/2010. Nenhuma diferença significativa foi encontrada entre as profundidades amostradas, em relação ao fitoplâncton, variáveis limnológicas e taxas metabólicas. No entanto, as maiores taxas de produção foram registradas na superfície, diminuindo com o aumento da profundidade, juntamente com a capacidade fotossintética do fitoplâncton. A ação do vento na lagoa do Peri promoveu a homogeneidade de nutrientes e do fitoplâncton na coluna d’água, caracterizando-o como polimítico. De acordo com a densidade e biovolume, a comunidade fitoplanctônica foi dominada por cianobactérias filamentosas, especialmente Cylindrospermopsis raciborskii (Woloszynska) Seenayya and Subba-Raju. Este estudo demonstrou que a temperatura da água combinada com a disponibilidade de nutrientes influencia a comunidade fitoplanctônica, determinando a variação temporal das taxas metabólicas, onde a respiração é maior que a produção primária.
Palavras-chave: lagoa costeira subtropical, produção primária, respiração, fitoplâncton, Cylindrospermopsis raciborskii.
1. Introduction
Primary production studies in the tropics and subtropics are scarce, but are essential for understanding energy and nutrient flows. Previous studies reveal that high temperature and light availability, in the tropics, favors high planktonic
Phytoplankton productivity is sensitive to nutrient, especially phosphorus availability (Tadonléke, 2010; Kerimoglu et al., 2013). Phosphorus enrichment and light availability sustain the pelagic chlorophyll a and primary production, while in oligotrophic lakes phytoplanktonic growth and production are frequently constrained by nutrient limitation (Carpenter et al., 2001; Liboriussen and Jeppesen, 2003).
Light availability is also a factor that determines the vertical distribution of photosynthetic organisms and their production rates. According to light extinction coefficient in water column, generally at the surface occurs photoinhibition, followed by subsurface of maximum phytoplankton density and primary production, which decreases towards the bottom, where the decomposition processes are more intense (Wondie et al., 2007; Tilahun and Ahlgren, 2010). However, some Cyanobacteria species are capable of regulating their position in the water column through gas vesicles in order to improve their photosynthetic efficiency (Moura et al., 2011).
A short review on Brazilian lakes reveals that the factors affecting primary production are different in each environment. For example, Barbosa (1979) analyzing Carioca Lake verified that the seasonal variation was mainly related to nutrient supply rather than light and temperature. Meanwhile Moreira and Knoppers (1990) recorded the temperature as the principal factor, where low primary production values were recorded during the winter and high values during the summer. On the other hand, Henry et al. (1998) stated that precipitation was the factor responsible for changes in the water quality and consequently the production rates. According to Bassoli
(2006) in Brazilian environments including lakes, reservoirs and flood lakes the maximum production rate does not exceed 300 mgC m–2 day–1.
Hennemann and Petrucio (2011) in a temporal study of nutrient and chlorophyll a distribution demonstrated that Peri Lake is spatially homogeneous, P-limited and polymitic. In addition the Cyanobacteria Cylindrospermopsis
raciborskii (Woloszynska) Seenayya and Subba-Raju has been recorded in this lake since 1994 (Komárková et al., 1999). Subsequently the phenotypic plasticity of filamentous Cyanobacteria could explain its expansion to diverse environments (Bonilla et al., 2012), therefore it is important to clarify the variables affecting Cyanobacteria and their relation to the production rates.
Thus, the purposes of this study were to examine the temporal and vertical variation of the metabolic rates (primary production and respiration) in Peri Lake, and its relationship with phytoplankton and limnological variables.
2. Material and Methods
2.1. Study area
The Peri Lake (27°44’S and 48°31’W) is a natural coastal lake, located in the southeast of Santa Catarina Island, Brazil, within an area of the Peri Lake Municipal Park protected by environment legislation (shaded area in Figure 1). The lake has a surface area of 5.07 km² and average and maximum depths of 4.2 m and 11.0 m respectively. It is a freshwater lake without marine influences, and it is the source of drinking water to human supply in part of the Santa Catarina Island. The main tributaries are the Cachoeira Grande and Ribeirão Grande Streams (A and B letters in Figure 1).
Figure 1. Map and location of the Peri Lake, Santa Catarina Island, Brazil, showing the incubation station (central dot). Letter A represents Cachoeira Grande Stream and letter B represents Ribeirão Grande Stream. Adapted from Hennemann
2.2. Sampling procedure
Water samples for abiotic and biotic variables, as well as primary production and respiration measurements were collected bimonthly (from June/2009 to December/2010) at four depths (surface, ~ 1.0m, ~ 3.0m and ~ 6.0m), considering that no thermal stratification was detected at a temporal scale according to a previous study by Hennemann and Petrucio (2011). Since no stratification of the water column was recorded, we considered the whole water column mixed to estimate the Zeu:Zmix ratio as an index of light availability.
Monthly maximum and average wind speed and total accumulated precipitation data were obtained from the REDEMET/Florianópolis (Rede de Meteorologia do Comando da Aeronáutica – Aeroporto de Florianópolis/ Hercílio Luz, SC).
Water temperature, conductivity, pH and dissolved oxygen were measured in situ, at four depths using a multiparameter probe (YSI-85). Immediately after collection, total alkalinity was determined by Gran’s titration method (Mackereth et al., 1978). Water samples were frozen at –20ºC for total nitrogen (TN) and total phosphorus (TP) determinations (Valderrama, 1981). Additionally, the TN:TP molar ratio was used to indicate which nutrient would potentially limit primary production in Peri Lake, using the classification proposed by Guildford and Hecky (2000), in which TN:TP > 50 represents lakes P-limited. Filtered water samples were preserved with phosphoric acid for dissolved organic carbon determination (Shimadzu TOC-5000A).
Water samples were filtered (Millipore AP40 glass fibre) and filters were kept frozen at –20ºC to chlorophyll a determinations, corrected for pheophytin, by extraction using 90% acetone (Lorenzen, 1967).
2.3. Planktonic net primary production (NPP) and respiration (R)
Planktonic production and respiration were estimated by the dissolved oxygen method in light and dark bottles incubations (Winkler method, in Wetzel and Likens, 2000). Two light and two dark bottles were incubated at each depth for three to five hours from 9:00 A.M. to 12:00 or 02:00 P.M. The dissolved oxygen variation was used to determine respiration rates (R) in dark bottles (initial concentration minus final concentration) and net primary production (NPP) in light bottles (final concentration minus initial concentration). Data in mgO2 L
–1 h–1, were converted to carbon consumption using the respiratory quotient (RQ = 1.0). Data in mgC m–3 h–1 are shown as negative values representing respiration rates. The values of primary production were converted to carbon productivity using the photosynthetic quotients (PQ = 1.2), and values in mgC m–3 h–1 are shown as positive values (Wetzel and Likens, 2000).
Assimilation number (AN in mgC (mgChla h)–1), an indication of photosynthetic efficiency (Ryther and Yentsch, 1957), was estimated from the ratio between NPP rates and chlorophyll a concentration.
Phytoplankton samples from the four depths were preserved with 1.6% formalin. The counting was carried out using an inverted microscope according to Utermöhl (1958) and as reported in Hasle (1978). For density (ind. mL−1) at least 400 individuals of dominant species were counted in their naturally occurring form: cells, colonies, cenobia or filaments. Biovolume (mm3 L–1) was obtained through geometric approximation, multiplying each species density by the mean volume of its cells considering, whenever possible, the mean dimension of 20 individual specimens of each species or genus (Sun and Liu, 2003). Dominant and abundant species were determined according to Lobo and Leighton (1986).
2.4. Statistical analyses
A nonparametric analysis of variance (Kruskal-Wallis) was used to evaluate the existence of significant (p < 0.05) differences, at spatial (depths) and temporal (months) scales, of limnological variables, metabolic rates and phytoplankton community. Relationships among phytoplankton group’s biovolume, limnological variables and metabolic rates were assessed by Spearman correlation. All analyses were completed using software Statistica 7 (StatSoft).
3. Results
3.1. Limnological variables
During the study period, temporal variation of water temperature was assessed, and showed a pattern representing subtropical areas from the Austral hemisphere. The summer months (January-March) were warmer than winter months (June-August), in which the highest water temperature was recorded in February/2010 (28.8°C) and the lowest in June/2009 (17.4°C; Figure 2).
No significant difference was evident among the four depths for physical and chemical variables (p>0.05). Considering the temporal variation the increase in water temperature in December/2009 and February/2010 coincides with the maximal chlorophyll a, the minimal dissolved oxygen concentrations, and the TN:TP ratio (Figure 2).
Temporally, total phosphorus and nitrogen and, chlorophyll a concentrations ranged from 7.3 to 39.1 µg L–1, from 138.7 to 992.4 μg L–1 and, from 12.8 to 24 μg L–1, respectively. Peri Lake was identified as an oligotrophic and mesotrophic environment, when phosphorus and chlorophyll a are, respectively, the used criterions for trophic status. The TN:TP ratio indicated that Peri Lake was limited by P, except for December/2010.
The temperature difference between the surface and ~ 6.0m was <0.2°C in most sampled months. Temporally, the mixing zone ranged from 7.5 m to 9.5 m and the euphotic zone (calculated from a Secchi disk) ranged from 2.4 m to 3.6 m, which resulted in a Zeu:Zmix ratio that clearly reveals light limitation in the lake during the entire study period (Figure 3).
was observed in June/2009, while precipitation reached 169.9 mm in April/2010 (Figure 3).
3.2. Net primary production (NPP) and respiration (R)
Maximum values of primary production rates were recorded in October/2009 (74.2 mgC m–3 h–1), during a period of high dissolved organic carbon and TN:TP ratio, and in February/2010 (66.3 mgC m–3 h–1), during a period of high temperature and chlorophyll a. The lowest NPP in August/2010 (19.1 mgC m–3 h–1) coincided with the lowest water temperature and dissolved organic carbon concentrations. The decline in NPP in October/2010 (20.9 mgC m–3 h–1) and
December/2010 (23.6 mgC m–3 h–1; Figure 4; black bars) was also related to a drop in water temperature, dissolved organic carbon and TN:TP ratio (Figure 2).
The highest mean net production rates were observed at the surface (49.8 mgC m–3 h–1), similar to rates recorded at ~ 1m depth (mean: 47.8 mgC m–3 h–1). These values decreased at ~ 3m depth (mean: 37.7 mgC m–3 h–1) and were the lowest at ~ 6m depth (mean: 33.7 mgC m–3 h–1). Although there were no statistical differences among depths (p>0.05) the months were statistically different (p<0.05; Figure 4; black bars).
Figure 3. Mixing zone, euphotic zone, Secchi disk depth during the sampling in the Peri Lake. Maximum and mean wind speed and precipitation accumulated from June/2009 to December/2010.
The assimilation number (AN) was highly variable temporally (p<0.05; Figure 4; black dots) with the highest values in October/2009 (5.4 mgC (mgChla h)–1) and the lowest values in December/2010 (1.1 mgC (mgChla h)–1). However, no difference was recorded among the depths (p>0.05), in which the optimal photosynthetic efficiency was at the surface (mean of 2.7 mgC (mgChla h)–1) and the lowest at ~ 6m depth (mean of 1.9 mgC (mgChla h)–1).
In October/2009 the highest respiration rate (64.1 mgC m–3 h–1) was recorded, coinciding with high TN:TP and dissolved organic carbon. The lowest respiration rate was recorded in October/2010 (17.7 mgC m–3 h–1), a period of low TN:TP and dissolved organic carbon. The highest respiration was found at ~ 1m depth (mean: 36.0 mgC m–3 h–1) and the lowest at ~ 6m depth (mean: 25.8 mgC m–3 h–1; Figure 4; white bars; p>0.05). Similar to NPP, respiration rates did not show spatial statistical difference (p>0.05), but temporally were statistically different (p<0.05; Figure 4; white bars).
During the whole study period, the mean daily respiration rate was higher than the mean daily primary production value. Thus, Peri Lake can be considered as a heterotrophic lake, where the respiration rates are on average 0.79 g C m–3 day–1 (Figure 5; gray bars) and the NPP rates are on average 0.33 g C m–3 day–1 (Figure 5; black bars).
NPP had a strong positive correlation with DOC (r=0.63, p=<0.05) and water temperature (r=0.32, p<0.05). On the other hand, respiration was positively related to both TN (r=0.52, p<0.05) and TP (r=0.36, p<0.05). However a negative correlation was recorded between R, wind (r=-0.50, p<0.05), and chlorophyll a (r=-0.42, p<0.05; Table 1).
3.3. Phytoplankton community
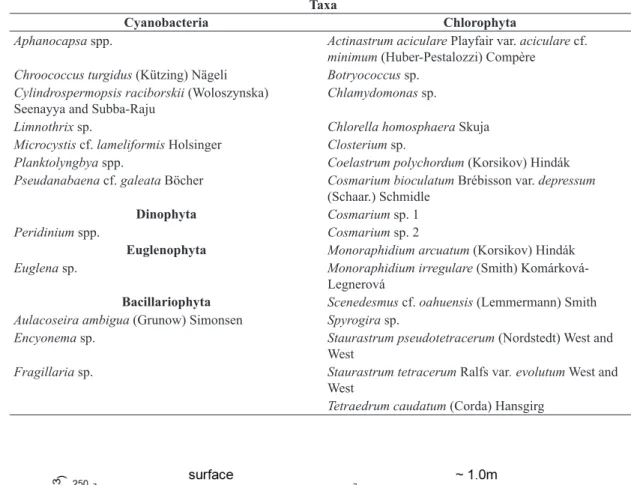
Altogether 28 freshwater phytoplankton taxa including species or genus were identified, from five taxonomical classes (Table 2). Chlorophyta was the most diverse class (16 taxa), followed by Cyanobacteria (7 taxa),
Bacillariophyta (3 taxa), Dinophyta and Euglenophyta (1 taxa each). However, Cyanobacteria were the most important group both in terms of density (90.0%) and biovolume (91.6%). Chlorophyta was the second class in importance to algae density (9.6%) and to biovolume (5.4%). Dinophyta, Bacillariophyta and Euglenophyta together contributed to 0.4% of the density and 3.0% of the biovolume (Figures 6 and 7). The low Cyanobacteria density and biovolume in low temperature months promoted a slight increase in Chlorophyta density and biovolume.
The greatest density values were recorded in October/2009 (230 × 103 ind. mL–1; Figure 6), a period of the high primary production rates, when Cylindrospermopsis
raciborskii contributed to 197 × 103 ind. mL–1. This species was dominant during all the study, with exception of December/2009 when Limnothrix sp. was predominant and the greatest Cyanobacteria biovolume was registered (97.6 mm3 L–1; Figure 7).
Similar to the metabolic rates and limnological variables the density and biovolume did not present significant
Table 1. Spearman correlation performed between NPP, R, limnological variables and phytoplankton. Abbreviations: TN: total nitrogen; TP: total phosphorus; WT: water temperature; Cond: conductivity; Chla: chlorophyll a; Wind: wind mean
speed; DOC: dissolved organic carbon; bCyano: Cyanobacteria biovolume; bChloro: Chlorophyta biovolume; bOther: Bacillariophyta + Dinophyta + Euglenophyta biovolume.
NPP R TN TP WT Cond Chla Wind DOC bCyano bChloro
R -0.11
TN 0.18 0.52*
TP -0.22 0.36* 0.21
WT 0.32* -0.18 -0.61* -0.08
Cond 0.08 0.07 -0.04 0.04 0.26
Chla 0.11 -0.42* -0.54* -0.06 0.46* -0.02
Wind -0.23 -0.50* -0.62* -0.03 0.27 0.12 0.34*
DOC 0.63* 0.28 0.27 -0.01 0.41* 0.09 -0.11 -0.44*
bCyano 0.51* 0.46* 0.36* 0.22 0.35* 0.20 0.12 -0.48* 0.73*
bChloro 0.09 0.12 -0.07 -0.34* 0.18 -0.10 -0.02 -0.47* 0.10 -0.02
bother -0.01 0.09 0.19 -0.05 -0.18 0.05 -0.17 0.03 0.00 -0.10 -0.03
Significant correlations are marked with * (p<0.05, n=40).
Table 2. Phytoplanktonic species observed in Peri Lake from June/2009 to December/2010. Taxa
Cyanobacteria Chlorophyta
Aphanocapsa spp. Actinastrum aciculare Playfair var. aciculare cf.
minimum (Huber-Pestalozzi) Compère
Chroococcus turgidus (Kützing) Nägeli Botryococcus sp.
Cylindrospermopsis raciborskii (Woloszynska) Seenayya and Subba-Raju
Chlamydomonas sp.
Limnothrix sp. Chlorella homosphaera Skuja
Microcystis cf. lameliformis Holsinger Closterium sp.
Planktolyngbya spp. Coelastrum polychordum (Korsikov) Hindák
Pseudanabaena cf. galeata Böcher Cosmarium bioculatum Brébisson var. depressum (Schaar.) Schmidle
Dinophyta Cosmarium sp. 1
Peridinium spp. Cosmarium sp. 2
Euglenophyta Monoraphidium arcuatum (Korsikov) Hindák
Euglena sp. Monoraphidium irregulare (Smith) Komárková-Legnerová
Bacillariophyta Scenedesmus cf. oahuensis (Lemmermann) Smith
Aulacoseira ambigua (Grunow) Simonsen Spyrogira sp.
Encyonema sp. Staurastrum pseudotetracerum (Nordstedt) West and West
Fragillaria sp. Staurastrum tetracerum Ralfs var. evolutum West and West
Tetraedrum caudatum (Corda) Hansgirg
Figure 6. Phytoplanktonic group’s total density at pelagic region of Peri Lake, from June/2009 to December/2010. (The
difference among depths (p>0.05), but a significant temporal variation was observed (p<0.05).
The temporal variation in cyanobacterial biovolume was positively correlated to the variation in TN (r=0.36, p<0.05) and water temperature (r= 0.35, p<0.05). Due to the strong positive correlation found between Cyanobacteria biovolume and DOC (r= 0.73, p<0.05), we suggest that DOC is of autochthonous origin. The Chlorophyta biovolume was negatively correlated to wind (r= –0.47, p<0.05) and TP (r= –0.34, p<0.05). The wind also negatively affected the Cyanobacteria (r= –0.48, p<0.05), and the cyanobacterial biovolume was correlated to both NPP and R (r= 0.51, p<0.05; r= 0.46, p<0.05; respectively; Table 1). Other significant correlations are highlighted in Table 1.
4. Discussion
4.1. Vertical variation
The Peri Lake features, such as its position along shorelines, its exposure to local wind, and its relative shallowness, prevented water column stratification, as was observed by Hennemann and Petrucio (2011) in Peri Lake, as well as in other environments (Amarasinghe and Vijverberg, 2002; Wondie et al., 2007; Montero et al., 2011). Regarding the vertical variation of primary production, the highest values were recorded at the surface, decreasing towards to ~ 6m depth, even though these changes were
not significant. This slight difference among depths is associated with light availability, high at the surface, since chlorophyll a and phytoplankton density were similar among the surface and ~ 1.0m.
Although Cyanobacteria species are capable of regulating their position in the water column through gas vesicles, the water turbulence, induced by the wind speed, mixed phytoplankton into the entire water column, reducing the light limitation effects (Petersen et al., 1997), explaining the little difference in primary production recorded along the entire water column, especially at ~ 6m depth. These light limitation tolerance is common to some Cyanobacteria species, for example, in Carioca Lake, Planktolyngbya
limnetica was centered at a depth where light penetration is less than 1% (Reynolds et al., 1983). Hodoki et al. (2011) also have showed that, although Cyanobacteria have low photosynthetic capacity, it keeps photosynthetic rates below 1% of light incident.
4.2. Temporal variation
The magnitude of temporal variability in phytoplankton biomass and primary production has been estimated using different indices. Melack (1979) used the coefficient of variation (CV=SD/X×100), which gives a relative measure of variability and is not sensitive to extreme values. Photosynthetic rates coefficient of variation in Peri Lake (47%) was similar to respiration’s coefficient of Figure 7. Phytoplanktonic group’s biovolume at pelagic region of Peri Lake, from June/2009 to December/2010. (The
variation (51%) and these values resemble to NPP and R of subtropical lakes, intermediate between equatorial and temperate systems (Beaver and Crisman, 1991).
The production rates and assimilation numbers from Peri Lake showed lower values than other tropical lakes (Erikson et al., 1998; Stenuite et al., 2007; Arst et al., 2008; Tilahun and Ahlgren, 2010; Montero et al., 2011), but were similar to Brazilian lakes, such as some lakes in the middle of the Rio Doce basin (Petrucio et al., 2006), Carioca Lake (Barbosa, 1979), and Guarapina Lake, in southeastern Brazil (Moreira and Knoppers, 1990). Although, the production rates of Peri Lake are within the range of data derived from Bassoli (2006), it was lower than some environments, such as Paranoá Lake (Cavalcanti et al., 1992) and Jurumirim Reservoir (Henry et al., 1998), the latter classified as oligotrophic. The respiration rates in Peri Lake were also lower than Itapeva Lake, which varied from 49.9 mgC m–3 h–1 to 131.1 mgC m–3 h–1 (Cardoso and Marques, 2009). The relative low metabolic rates and photosynthetic efficiency can be a result of some environmental features, such as oligotrophy status, P– and light limitation, as well as low photosynthetic capacity of Cyanobacteria.
The oligotrophic condition, P– and light limitation in Peri Lake resulted in heterotrophy (R>NPP) in all sampled months, typical of oligotrophic lakes (Cole et al., 1994). Since the environment is limited by light (due turbid, high algal biomass or sediment re-suspension), and the phytoplankton individuals remain a longer time in the dark (Tonetta et al., 2013), high respiration rates and low primary production rates are expected.
Cyanobacteria were the major phytoplankton contributors in Peri lake, in particular C. raciborskii, a species recorded in different regions of the world, especially in Brazilian lakes of different trophic status (Crosseti and Bicudo, 2008; Dantas et al., 2012). The low underwater light and nutrient deficiency in Peri Lake determined the Cyanobacteria species belonging from Sn (C. raciborskii) and S1 (Limnothrix sp. and Planktolyngbya spp.) functional groups (Reynolds et al., 2002; Padisák et al., 2009). The life strategies, competitiveness and phenotypic plasticity of these species ensure the predominance over other phytoplankton groups (Bonilla et al., 2012).
During the sampling period, a high decrease in nitrogen conditions and phosphorous affected respiration more than primary production. The first peak in NPP was recorded in October/09, which was related to high TN and Cyanobacteria. In December/09 the TN concentration decreased but the Cyanobacteria maintained high biovolume, density and consequently NPP was high. However, in February/10 both Cyanobacteria density and biovolume decreased and an increase in Chlorophyta density and biovolume was recorded. Although during this period the TN concentration was low, the NPP was similar to December/09, which suggests a more efficient use of this nutrient by Chlorophyta than Cyanobacteria.
TN and TP exhibited stronger correlations with R and Cyanobacteria than NPP, suggesting that initially,
the Cyanobacteria dominance and its temporal variation are determined by nutrient (coupled with temperature), consequently determining the production rates. This is corroborated by strong correlation between NPP and DOC, since Fontes et al. (2013) have indentified that filamentous Cyanobacteria played an important role in releasing DOC. Although the statistical significance was weak, TN was positively correlated to NPP while TP was negatively correlated.
Phytoplankton productivity and respiration were sensitive to temperature variations. In general, the response to water temperature was positive in primary production and negative in respiration, but this response depended of the nutrient availability, since the metabolic processes is dependent on many factors (Tadonléke, 2010). Tonetta et al. (2013) have also demonstrated that changes in water temperature and nutrient availability drive temporal variation in phytoplankton in Peri Lake.
Thus, the results of this study suggest that the phytoplankton in Peri Lake is adapted to environmental conditions through a combination of physical and chemical features. The wind induces mixing and can play an important role in the redistribution of nutrient and phytoplankton characterizing this lake as polymictic. The temporal variations of nutrient, especially nitrogen, and water temperature were strong and resulted in marked differences in the growth of phytoplankton groups and consequently in metabolic rates, where respiration is higher than primary production.
Acknowledgements
This study was funded by CNPq – Brazil (Conselho Nacional de Desenvolvimento Científico e Tecnológico; CNPq Universal Process: 473572/2008-7) and the first author was supported by CAPES (Coordenação de Aperfeiçoamento de Pessoal de Nível Superior). We would like to thank Danilo Funke (FLORAM – Peri Lake Municipal Park) and Alex Pires De Oliveira Nuñer (LAPAD – UFSC) for help in field and lab equipments and the PPGECO (Programa de Pós-Graduação em Ecologia – UFSC). We are also grateful to the very constructive comments of reviewers.
References
AMARASINGHE, PB. and VIJVERBERG, J., 2002. Primary production in a tropical reservoir in Sri Lanka. Hydrobiologia, vol. 487, no. 1, p. 85-93. http://dx.doi.org/10.1023/A:1022985908451. ARST, H., NÕGES, T., NÕGES, P. and PAAVEL, B., 2008. Relations of phytoplankton in situ primary production, chlorophyll concentration and underwater irradiance in turbid lakes. Hydrobiologia, vol. 599, no. 1, p. 169-176. http://dx.doi. org/10.1007/s10750-007-9213-z.
BASSOLI, F., 2006. Produção fitoplanctônica em ecossistemas límnicos brasileiros: síntese e cenário atual. Rio de Janeiro: Universidade Federal do Rio de Janeiro. 117 p. Masters Dissertation. BEAVER, JR. and CRISMAN, TL., 1991. Temporal variability in algal biomass and primary productivity in Florida lakes relative to latitudinal gradients, organic color and trophic state. Hydrobiologia, vol. 224, no. 2, p. 89-97. http://dx.doi.org/10.1007/BF00006865. BERMAN, T., STONE, L., YACOBI, YZ., KAPLAN, B., SCHLICHTER, M., NISHRI, A. and POLLINGHER, U., 1995. Primary production and phytoplankton in Lake Kinneret: a
long-term record (1972-1993). Limnology and Oceanography, vol. 40, no. 6, p. 1064-1076. http://dx.doi.org/10.4319/lo.1995.40.6.1064. BONILLA, S., AUBRIOT, L., SOARES, MCS., GONZÁLEZ-PIANA, M., FABRE, A., HUSZAR, VLM., LÜRLING, M., ANTONIADES, D., PADISÁK, J. and KRUK, C., 2012. What drives the distribution of the bloom-forming cyanobacteria Planktothrix agardhii and Cylindrospermopsis raciborskii? FEMS Microbiology Ecology, vol. 79, no. 3, p. 594-607. http://dx.doi. org/10.1111/j.1574-6941.2011.01242.x. PMid:22092489 CARDOSO, LS. and MARQUES, DM., 2009. Hydrodynamics-driven plankton community in a shallow lake. Aquatic Ecology, vol. 43, no. 1, p. 73-84. http://dx.doi.org/10.1007/s10452-007-9151-x. CARPENTER, SR., COLE, JJ., HODGSON, JR., KITCHELL, JF., PACE, ML., BADE, D., COTTINGHAM, KL., ESSINGTON, TE., HOUSER, JN. and SCHINDLER, DE., 2001. Trophic cascades, nutrients, and lake productivity: whole-lake experiments. Ecological Monographs, vol. 71, no. 2, p. 163-186. http://dx.doi.
org/10.1890/0012-9615(2001)071[0163:TCNALP]2.0.CO;2. CAVALCANTI, CGB., ALVES, VRE. and IKAWA, NG., 1992. Variação especial da produtividade primária no lago Paranoá Brasília, DF. Acta Limnologica Brasiliensia, vol. 4, p. 327-341. COLE, JJ., CARACO, NF., KLING, GW. and KRATZ, TK., 1994. Carbon dioxide supersaturation in the surface waters of lakes. Science, vol. 265, no. 5178, p. 1568-1570. http://dx.doi. org/10.1126/science.265.5178.1568. PMid:17801536
CROSSETI, LO. and BICUDO, CEM., 2008. Adaptations in phytoplankton life strategies to imposed change in a shallow urban tropical eutrophic reservoir, Garças Reservoir, over 8 years. Hydrobiologia, vol. 614, p. 91-105. http://dx.doi.org/10.1007/ s10750-008-9539-1.
DANTAS, EW., BITTENCOURT-OLIVEIRA, MC. and MOURA, AN., 2012. Dynamics of phytoplankton associations in three
reservoirs in northeastern Brazil assessed using Reynolds’ theory.
Limnologica, vol. 42, no. 1, p. 72-80. http://dx.doi.org/10.1016/j. limno.2011.09.002.
ERIKSON, R., HOOKER, E., MEJIA, M., ZELAYA, A. and VAMMEN, K., 1998. Optimal conditions for primary production in a polymictic
tropical lake (Lake Xolotlán, Nicaragua). Hydrobiologia, vol. 382, no. 1/3, p. 1-16. http://dx.doi.org/10.1023/A:1003271614344. FONTES, MLS., TONETTA, D., DALPAZ, L., ANTÔNIO, RV. and PETRUCIO, MM., 2013. Dynamics of planktonic prokaryotes and dissolved carbon in a subtropical coastal lake. Frontiers in Microbiology, vol. 4, p. 71.
GUILDFORD, SJ. and HECKY, RE., 2000. Total nitrogen, total phosphorus, and nutrient limitation in lakes and oceans: Is there a common relationship? Limnology and Oceanography, vol. 45, no. 6, p. 1213-1223. http://dx.doi.org/10.4319/lo.2000.45.6.1213.
HASLE, G., 1978. The inverted microscope method. In SOURNIA,
A. (Ed.). Phytoplankton Manual. Paris: Unesco Publishers. p. 88-96. Monographs on oceanographic methodology, no. 6. HENNEMANN, MC. and PETRUCIO, MM., 2011. Spatial and temporal dynamic of trophic relevant parameters in a subtropical coastal lagoon in Brazil. Environmental Monitoring and Assessment, vol. 181, no. 1-4, p. 347-361. http://dx.doi.org/10.1007/s10661-010-1833-5. PMid:21190080
HENRY, R., NUNES, MA., MITSUKA, PM., LIMA, N. and CASANOVA, SMC., 1998. Variação espacial e temporal da produtividade primária pelo fitoplâncton na represa de Jurumirim
(rio Paranapanema, SP). Revista Brasileira de Biologia = Brazilian Journal of Biology, vol. 58, no. 4, p. 571-590. http://dx.doi. org/10.1590/S0034-71081998000400005.
HODOKI, Y., OHBAYASHI, K., KOBAYASHI, Y., OKUDA, N. and NAKANO, S., 2011. Temporal variation in cyanobacteria species composition and photosynthetic activity in experimentally induced blooms. Journal of Plankton Research, vol. 33, no. 9, p. 1410-1416. http://dx.doi.org/10.1093/plankt/fbr040.
KERIMOGLU, O., STRAILE, D. and PEETERS, F., 2013. Seasonal, inter-annual and long term variation in top–down versus bottom–up regulation of primary production. Oikos, vol. 122, no. 2, p. 223-234. http://dx.doi.org/10.1111/j.1600-0706.2012.20603.x. KOMÁRKOVÁ, J., LAUDARES-SILVA, R. and SENNA, PAC., 1999. Extreme morphology of Cylindrospermopsis raciborskii
(Nostocales, Cyanobacteria) in the Lagoa do Peri, a freshwater
coastal lagoon, Santa Catarina, Brazil. Algological Studies, vol. 94, p. 207-222.
LIBORIUSSEN, L. and JEPPESEN, E., 2003. Temporal dynamics in epipelic, pelagic and epiphytic algal production in a clear and a turbid shallow lake. Freshwater Biology, vol. 48, no. 3, p. 418-431. http://dx.doi.org/10.1046/j.1365-2427.2003.01018.x. LOBO, EA. and LEIGHTON, G., 1986. Estructuras comunitarias de las fitocenosis planctónicas de los sistemas de desembocaduras de rios y esteros de la zona central de Chile. Revista de Biologia Marina, vol. 22, no. 1, p. 1-29.
LORENZEN, CJ., 1967. Determination of chlorophyll and pheopigments: spectrophotometric equations. Limnology and Oceanography, vol. 12, no. 2, p. 343-346. http://dx.doi.org/10.4319/ lo.1967.12.2.0343.
MACKERETH, FJH., HERON, JE. and TALLING, JF., 1978. Water Analysis: some revised methods for limnologists. Michigan: Freshwater Biological Association. 120 p. Scientific Publication, no. 36.
MELACK, JM., 1979. Temporal variability of phytoplankton in tropical lakes. Oecologia, vol. 44, no. 1, p. 1-7. http://dx.doi. org/10.1007/BF00346388.
MONTERO, P., DANERI, G., GONZÁLEZ, HE., IRIARTE, JL., TAPIA, FJ., LIZÁRRAGA, L., SANCHEZ, N. and PIZZARO, O., 2011. Seasonal variability of primary production in a fjord ecosystem of the Chilean Patagonia: Implications for the transfer of carbon within pelagic food webs. Continental Shelf Research, vol. 31, no. 3-4, p. 202-215. http://dx.doi.org/10.1016/j.csr.2010.09.003. MOREIRA, PF. and KNOPPERS, BA., 1990. Ciclo anual de produção primária e nutrientes na lagoa Gurarapina, RJ. Acta Limnologica Brasiliensia, vol. 3, p. 275-290.
in northeastern Brazil. Brazilian Journal of Biology = Revista Brasileira de Biologia, vol. 71, no. 2, p. 451-459. http://dx.doi. org/10.1590/S1519-69842011000300015.
PADISÁK, J., CROSSETTI, LO. and NASELLI-FLORES, L., 2009. Use and misuse in the application of the phytoplankton functional classification: a critical review with updates. Hydrobiologia, vol. 621, no. 1, p. 1-19. http://dx.doi.org/10.1007/s10750-008-9645-0. PETERSEN, J., CHEN, CC. and KEMP, WM., 1997. Scaling aquatic primary productivity: experiments under nutrient and light limited conditions. Ecology, vol. 78, no. 8, p. 2326-2338. http://
dx.doi.org/10.1890/0012-9658(1997)078[2326:SAPPEU]2.0.CO;2. PETRUCIO, MM., BARBOSA, FAR. and FURTADO, ALS., 2006. Bacterioplankton and phytoplankton production in seven lakes in the Middle Rio Doce basin, south-east Brazil. Limnologica, vol. 36, no. 3, p. 192-203. http://dx.doi.org/10.1016/j.limno.2006.05.001. REYNOLDS, CS., TUNDISI, JG. and HINO, K., 1983. Observations on a metalimnetic Lyngbya population in a stably stratified tropical
lake (Lagoa Carioca, Eastern Brazil). Archiv fur Hydrobiologie, vol. 97, no. 1, p. 7-17.
REYNOLDS, CS., HUSZAR, V., KRUK, C., NASELLI-FLORES, L. and MELO, S., 2002. Towards a functional classification of the freshwater phytoplankton. Journal of Plankton Research, vol. 24, no. 5, p. 417-428. http://dx.doi.org/10.1093/plankt/24.5.417. RYTHER, JH. and YENTSCH, CS., 1957. The estimation of phytoplankton production in the Ocean from Chlorophyll and light data. Limnology and Oceanography, vol. 2, no. 3, p. 281-286. STENUITE, S., PIRLOT, S., HARDY, M., SARMENTO, H., TARBE, A., LEPORCQ, B. and DESCY, J., 2007. Phytoplankton production and growth rate in Lake Tanganyika: evidence of a decline in primary productivity in recent decades. Freshwater Biology, vol. 52, no. 11, p. 2226-2239. http://dx.doi.org/10.1111/ j.1365-2427.2007.01829.x.
SUN, J. and LIU, D., 2003. Geometric models for calculating cell biovolume and surface area for phytoplankton. Journal of Plankton Research, vol. 25, no. 11, p. 1331-1346. http://dx.doi. org/10.1093/plankt/fbg096.
TADONLÉKE, RD., 2010. Evidence of warming effects on phytoplankton productivity rates and their dependence on eutrophication status. Limnology and Oceanography, vol. 55, no. 3, p. 973-982. http://dx.doi.org/10.4319/lo.2010.55.3.0973. TILAHUN, G. and AHLGREN, G., 2010. Seasonal variations in phytoplankton biomass and primary production in the Ethiopian Rift Valley lakes Ziway, Awassa and Chamo – the basis for fish production. Limnologica, vol. 40, no. 4, p. 330-342. http://dx.doi. org/10.1016/j.limno.2009.10.005.
TONETTA, D., PETRUCIO, MM. and LAUDARES-SILVA, R., 2013. Temporal variation in phytoplankton community in a freshwater coastal lake of southern Brazil. Acta Limnologica Brasiliensia, vol. 25, no. 1, p. 99-110. http://dx.doi.org/10.1590/ S2179-975X2013000100011.
UTERMÖHL, H., 1958. Zur Vervollkomrnnung der quantitativen Phytoplankton Methodic. Mitt. Stuttgart: Schweizerbart. Internationale Vereinipng für Theoretische und Angewandte Limnologie. Komitee fdr Limnologische Methoden, no. 9.
VALDERRAMA, JC., 1981. The simultaneous analysis of total nitrogen and phosphorus in natural waters. Marine Chemistry, vol. 10, no. 2, p. 109-122.
http://dx.doi.org/10.1016/0304-4203(81)90027-X.
WETZEL, RG. and LIKENS, GE., 2000. Limnological Analysis. New York: Springer-Verlag New York. 429 p.
WONDIE, A., MENGISTU, S., VIJVERBERG, J. and DEJEN, E., 2007. Seasonal variation in primary production of a large high
altitude tropical lake (Lake Tana, Ethiopia): effects of nutrient