Sources and rates of potassium for sweet orange production
José Antonio Quaggio
1; Dirceu Mattos Junior
2*; Rodrigo Marcelli Boaretto
21
IAC – Centro de Solos e Recursos Ambientais, C.P. 28 – 13020-902 – Campinas, SP – Brasil. 2
IAC – Centro de Citricultura Sylvio Moreira, C.P. 04 – 13490-970 – Cordeirópolis, SP – Brasil. *Corresponding author <[email protected]>
ABSTRACT:Fruit yield and quality of citrus trees (Citrus spp.) is markedly affected by potassium (K) fertilization. Potassium chloride is the major source of K, even though other sources are also available for agricultural use when crops are sensitive to chloride or where potential for accumulation of salts in soils exists. Only few studies addressed the effect of K sources on yield and quality of citrus fruits. Therefore, the present study was conducted to evaluate K2SO4 and KCl fertilizer sources at 0, 100, 200, and 300 kg ha–1 per year K2O on fruit yield and quality of ‘Pêra’ and ‘Valencia’ sweet orange trees in the field. The experiments were carried out in a 4 × 2 factorial design under randomized complete blocks, with four replicates from 2001 to 2004. Fruit yield increased with increased K fertilization. Nutrient rate for maximum economic yield of ‘Pêra’ was 200 kg ha–1 of K
2O and for ‘Valencia’, 270
kg ha–1 of K2O. Differences were attributed to higher production and K exportation by fruits of ‘Valencia’. Fruit mass also increased with increased K fertilization what decreased total soluble solids in juice, and which correlated with leaf K concentrations for ‘Valencia’ (r = 0.76; p < 0.05). Leaf Ca, Mg and B concentrations decreased with K rates. Additionally, leaf Cl increased up to 440 mg kg–1 with KCl rates, even though no negative effects occurred either on fruit yield or quality of trees.
Key words: Citrus sinensis (L.) Osbeck, chloride, sulfate, mineral nutrition, nutrient management
Fontes e doses de potássio na produção de laranjeira
RESUMO:Produtividade e qualidade da produção de citros (Citrus spp.) é largamente influencia pela adubação com potássio (K). O cloreto de potássio é a principal fonte K como fertilizante, embora outras fontes estejam disponíveis para uso agrícola e que são de interesse para culturas sensíveis ao cloreto ou cultivadas em solos com potencial para acúmulo de sais. Poucos pesquisadores avaliaram o efeito de fontes de K na produção e qualidade de frutas cítricas. Assim sendo, avaliaram-se fontes de K2SO4 e KCl nas doses de 0, 100, 200 e 300 kg ha–1 por ano de
K2O na produção e qualidade de frutos em pomares de laranjeiras ‘Pêra’ e ‘Valência’. Os experimentos foram instalados em delineamento fatorial do tipo 4 × 2, com quatro repetições e conduzidos no período de 2001 a 2004. A produtividade da laranjeira aumentou com a adubação potássica. O máximo rendimento econômico para a adubação com K na laranjeira ‘Pêra’ foi obtido na dose de 200 kg ha–1 de K2O, enquanto, na laranjeira ‘Valência’ foi de 270 kg ha–1 de K
2O. As diferenças foram atribuídas ao maior nível de produção e exportação de K pelos frutos
de ‘Valência’. A massa do fruto também aumentou com o incremento nas doses de K o que determinou as perdas de sólidos solúveis totais no suco. Esta foi correlacionada com as concentrações de K nas folhas da laranjeira ‘Valência’ (r = 0,76; p < 0,05). A concentração de Ca, Mg e B nas folhas diminuíram com as doses de K. A concentração de Cl nas folhas aumentou até 440 mg kg–1 com o incremento nas doses de KCl, entretanto, não foram observados efeitos adversos na produção e na qualidade dos frutos.
Palavras-chave: Citrus sinensis (L.) Osbeck, cloro, sulfato, nutrição mineral, manejo nutricional
Introduction
Fertilizers are required to support adequate mineral nu-trition of citrus and to ensure high crop productivity in low fertility tropical soils. Fruit yield and quality of citrus trees depends largely on nitrogen (N) and potassium (K) fertili-zation (Cantarella et al., 2003; Alva et al., 2006), elements which represent the greatest quantity of nutrients exported through harvest (Bataglia et al., 1977; Mattos Jr. et al., 2003). Furthermore, under abiotic stress conditions as salinity or drought, N and K may contribute to reduce excess absorp-tion of sodium (Na) and chloride (Cl) by citrus trees because of the competitive root uptake observed between NO3–/Cl– and K+
/Na+
(Gimeno et al., 2009).
Potassium also affects external fruit characteristics, since those become larger and coarser as the K supply increases;
on the other hand, K deficiency reduces number and fruit size of all citrus varieties and decreases soluble solids con-tent of juice (Alva et al., 2006). Therefore, optimization of fruit quality for either fresh consumption or frozen concen-trated orange juice production is supported by adequate nu-trient management (Quaggio et al., 2005; Obreza et al., 2008). Potassium chloride is the major source of K, even though other sources such as potassium sulfate and potas-sium nitrate are also available for agricultural use. These later are usually more expensive but are preferred for crops that are sensitive to chloride, as citrus (Bañuls and Primo-Millo, 1992), or for those grown where potential for accumulation of salts in soils exists (Laegreid et al., 1999); other character-istics may also favor the use of the same via fertigation.
con-ducted in very coarse textured Entisols. Because of differ-ences on anion retention in the soil colloidal complex asso-ciated to increased interest on the use of alternative K-sources for citrus production, this work compared the effect of sources and rates of K on fruit yield and quality of two or-ange cultivars, and established the effects of sulfur and chlo-ride supply on the chemical characteristics of soils and nutri-tional status of trees.
Material and Methods
Field experiments were conducted with 5-year-old sweet orange trees grown in commercial groves located in two cit-rus producing regions of the State of São Paulo, Brazil, from 2000 to 2004. The first site, Santa Cruz do Rio Pardo (south-ern region of the State; 22º48’50" S, 49º22’40" W), Brazil, is characterized by occurrence of mild temperatures and very low water deficit along the year (mean annual temperature ≤ 23ºC and rainfall = 1,760 mm), with a inherent low fertility, sandy to medium textured soil with the following chemical charac-teristics: organic matter (OM) = 13.8 g dm–3; pH(0.01 M CaCl2) = 4.3; K (resin extracted) = 0.6 mmolc dm–3; cation exchange capacity (CEC) = 43.9 mmolc dm–3 and soil base saturation (V) = 34.5%. Oranges produced on this site {‘Pêra’ sweet orange [Citrus sinensis (L.) Osb.] on Rangpur lime (C. limonia Osb.)} are mostly destined to the fresh fruit mar-ket. The second site, Matão (central-north region of the State; 21º35’50’ S, 48º26’10" W), Brazil, presents higher tempera-tures and frequent drought periods during the winter sea-son (mean annual temperature ≥ 23ºC and rainfall of 1,350 mm); the soil had the following chemical characteristics: OM = 18.5 g dm–3; pH(0.01 M CaCl2) = 4.8; K (resin extracted) = 0.7 mmolc dm–3; CEC = 57.5 mmolc dm–3 and V = 39%. Fruits [‘Valencia’ sweet orange (C. sinensis) on Rangpur lime] are destined for frozen concentrated orange juice (FCOJ) production. Both experiments were conducted without irri-gation.
Experiments were carried out in a 4 × 2 factorial design under randomized complete blocks, with four replicates, to evaluate the effects of K rates (0, 100, 200, and 300 kg ha–1 per year K2O) and sources (K2SO4 and KCl) on fruit yield and quality of oranges. Each experimental plot of the 32
plots consisted of four rows with five uniform trees per row, summing up 20 trees. Only the six central trees within each plot were used for sampling and yield control. Fertilizer amounts for each treatment were hand applied to the soil surface in three split applications, on both sides of trees (on 150 cm wide bands, 50 cm away from tree trunk), from early spring to late summer.
Fruit yield was measured annually by summing up the mass of fruits, if more than one harvest per year occurred. Fruit samples (n = 15) were collected at maturation for fresh mass of fruits and percent juice content (based on mass frac-tion) evaluation as well as juice quality, by determining total soluble solids concentration (TSS), acidity, and total soluble solids/acidity ratio (Redd et al., 1986). The amounts of TSS content per orange box (40.8 kg) and per area (kg ha–1) were calculated. Four to six-month-old spring flush leaves were annually sampled from fruiting terminals and analyzed for total nutrient concentrations according to Bataglia et al. (1983). Soil samples were annually collected from the 0-0.2 m depth layer and analyzed according to methods described by Raij et al. (2001).
Rates of K for maximum economic fruit yield were esti-mated as follows: dY/dX = C/F, where: Y = fruit yield (t ha–1
); X = K rate (kg ha–1
of K2O); C = cost of K fertilizer (1.00 US$ kg–1 of K2O) and F = price of fruits (120.00 US$ t–1 of oranges). Data were tested for significant differences among treatments using the analysis of variance (ANOVA) with the GLM procedure of the SAS®
System (1996). Selected variables were adjusted by regression and correlation model analyses using the PROC REG and the PROC CORR pro-cedures of the SAS®
, respectively.
Results and Discussion
Potassium fertilization affected fruit yield in both experi-mental sites, but no significant effects were observed for K sources in the long term study. A more marked response on fruit yield occurred in Matão, with ‘Valencia’, where the aver-age orange production increased after four harvest seasons from 35 to 50 t ha–1
per year with an increase in K2O rate from 0 to 300 kg ha–1 (Figure 1A and 1B). At both sites the initial K concentration in the soil was low (≤ 0.7 mmolc dm–3);
lin-Figure 1 – Effects of potassium fertilization on fruit yield of (A) ‘Pêra’ (Santa Cruz do Rio Pardo) and (B) ‘Valencia’ (Matão) sweet oranges in two locations in the State of São Paulo, Brazil. Data represent mean values for the 2001-2004 period. *Significant at p < 0.05. **Significant at p < 0.01.
Soil K = 0.0084x + 0.83 R² = 0.97**
0 1 2 3 4
30 35 40 45 50
0 100 200 300
So
il K,
m
m
o
lc
dm
–3
F
rui
t Y
ie
ld
,
t ha
–1
per
y
ear
K2O, kg ha–1
Fruit yield = -0.00014x2+ 0.08466x + 35.92
R² = 0.88*
B)
Soil K = 0.0065x + 0.94 R² = 0.99**
0 1 2 3 4
30 35 40 45 50
0 100 200 300
S
o
il K
, m
m
o
lc
dm
–3
F
ru
it
Y
ie
ld
,
t h
a
–1
per
y
e
ar
K2O, kg ha–1
Fruit yield = -0.00010x2+ 0.04848x + 40.90
R² = 0.99**
ear relationships for soil exchangeable K were observed with K rates (Figure 1A and 1B; p < 0.05). Fruit yield correlated with increased availability of K in the soil to approximately K = 2.7 mmolc dm–3
, which is similar to the critical level es-tablished for citrus trees (Quaggio et al., 1998); furthermore depressive effects of K fertilization on fruit yield were veri-fied with soil exchangeable K higher than 2.9 mmolc dm–3 (Quaggio et al., 2008).
Maximum fruit yield of ‘Pêra’ was obtained with 242 kg ha–1 of K2O (Figure 1A), while fruit size was maximized with 282 kg ha–1 of K2O (Figure 2A). Similarly, fruit yield of ‘Valencia’ was obtained with 302 kg ha–1
(Figure 1B) and maxi-mum fruit size with 248 kg ha–1
of K2O (Figure 2B). In a research with seven year-old ‘Marsh’ grapefruit trees, Koo and Reese (1972) demonstrated that fruit yield increased with in-crease in K2O application up to 188 kg ha–1
, with further in-crease in K2O rate to 282 kg ha–1 and had no positive effect on fruit yield. In another study, Reese and Koo (1975) also verified that the fruit yield of different orange variety trees increased similarly with K supply. Therefore, citrus responses to K supply occur in good agreement when grown in soils of low exchangeable-K, which are characteristic of the areas either of the present studies or of central Florida (USA).
The K2O rate for maximum profit was obtained with approximately 200 kg ha–1 for ‘Pêra’ and 270 kg ha–1 for ‘Valencia’. ‘Valencia’ is usually more productive than ‘Pêra’ (Pio et al., 2005) and have fruits which are expected to ex-port more K (2.0 kg t–1
) than those of the later and other early season orange varieties (1.5 kg t–1) (Bataglia et al., 1977). Therefore, the nutrient demand of the ‘Valencia’ grove and consequently the response to K fertilization was more mean-ingful.
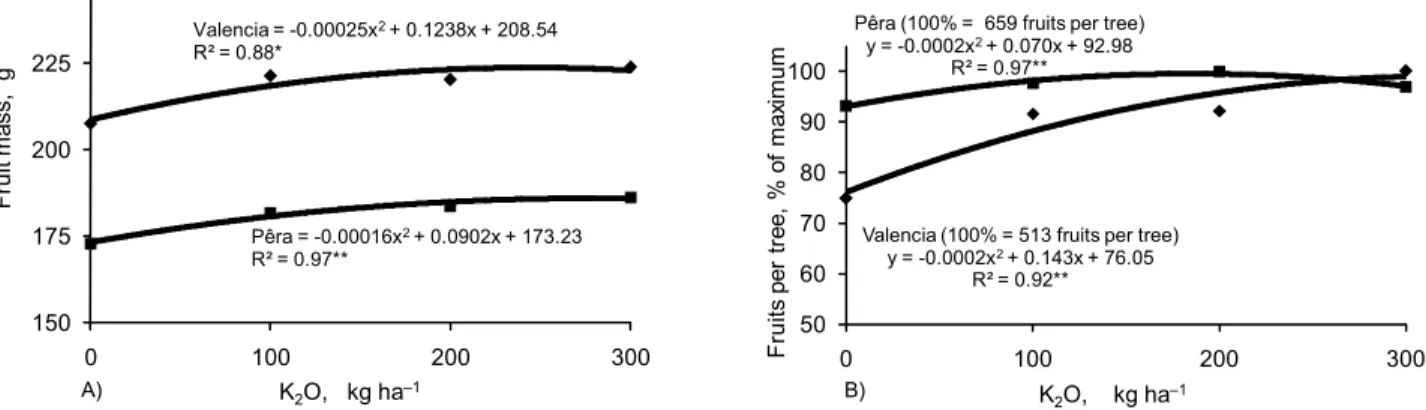
Fruits for both varieties were large, with approximately 220 g for ‘Valencia’ and 180 g for ‘Pêra’, which despite the size still increased 7-8 % in mass with Kfertilization in both sites (Figure 2A and 2B), in correspondence to previous data reported by Quaggio et al. (2006). There were no differences in fruit mass due to K sources, the effect of which was also observed for ‘Marsh’ grapefruit trees fertilized with either KCl or K2SO4 (Koo and Reese, 1972). In addition, in this study K fertilization affected the number of fruits per tree which
was 25% greater in Matão and only 7% greater in Santa Cruz both compared to the non-fertilized treatments (Figure 2B). Characteristics of fruit quality of ‘Pêra’ oranges were not affected by K fertilization for averaged values in Santa Cruz do Rio Pardo during 2001-2004 (Table 1). Exception occurred in 2003, when total soluble solids varied with the fertilizer source, and a 7% increase in the amount of TSS per box of oranges fertilized with K2SO4 was observed (data not shown). Trees were subjected to an exceptional drought stress in that year, when excess accumulation of salts in the soil probably occurred during short periods and impaired nor-mal plant development and fruit maturation. The increase in TSS per area (400 kg ha–1
TSS with K2O rates varying from 0 to 300 kg ha–1) was mostly related to the increase in fruit production obtained in the same site (Table 1). Even though TSS of fruits might decrease with increased fruit size (Quaggio et al., 2006), in the present study a decrease of 0.2-0.3 kg per box of TSS between 0 and 300 kg ha–1 K2O was observed in the ‘Valencia’ grove, which was due to a decrease in the content of juice rather to a decrease in the quality of the juice as TSS was not affected by fertilizer sources (Table 2). On the other hand, the variation in fruit yield positively affected TSS per area in both experimental sites (Tables 1 and 2). This is explained by the effect K presents on fruit mass, which is primarily associated to an increase in fruit peel thick-ness. A negative relationship was established between pro-duction of TSS (y) and fruit mass of ‘Valencia’ oranges (x) (y = -0.0084x + 4.33; r = 0.76, p < 0.05). Similar results were obtained in N, P and K fertilization experiments conducted in the field with lemon (Quaggio et al., 2002) and oranges (Quaggio et al., 2006). Such effect and other of increasing levels of fertilizers on fruit yield and quality were summa-rized by Obreza et al. (2008).
Foliar concentration of K in both orange varieties in-creased up to 15 g kg–1
with K fertilization (Figure 3). Koo and Reese (1972) also verified effects of fertilization on leaf K concentrations, which varied from 12 to 22 g kg–1 in an experiment with young ‘Hamlin’ orange trees. Adequate levels of leaf K, 10-15 mg kg–1
(Quaggio et al., 2005) were attained with K rates between 100 and 300 kg ha–1
per yearof K2O. On the other hand, Ca and Mg leaf concentrations were
be-Figure 2 – Effects of potassium rates on fruit mass (A) and on fruit per tree % of maximum (B) of ‘Pêra’ (Santa Cruz do Rio Pardo) and ‘Valencia’ (Matão) sweet oranges in two locations in the State of São Paulo, Brazil. Data represent mean values for the 2001-2004 period. *Significant at p < 0.05. **Significant at p < 0.01.
150 175 200 225 250
0 100 200 300
F
ru
it
m
a
ss, g
K2O, kg ha–1
Pêra = -0.00016x2+ 0.0902x + 173.23
R² = 0.97**
Valencia = -0.00025x2+ 0.1238x + 208.54
R² = 0.88*
A)
Valencia (100% = 513 fruits per tree)
y = -0.0002x2+ 0.143x + 76.05
R² = 0.92** Pêra (100% = 659 fruits per tree)
y = -0.0002x2+ 0.070x + 92.98
R² = 0.97**
50 60 70 80 90 100
0 100 200 300
F
ru
it
s
per
t
ree,
%
of
m
ax
im
u
m
K2O, kg ha–1
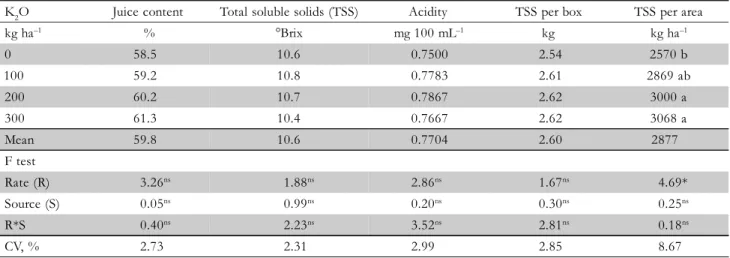
low those considered adequate for improved fruit yield of citrus trees (Quaggio et al., 2005) with application of higher K2O rates (Figure 4A and B). The equilibrium of exchange-able cations in the soil is proportional to the activity ratio of K for divalent cations in soil solution. Thus, increased rates of K2O primarily cause an increase on the activity of this former element and consequently a decrease on root uptake of Ca and Mg (Jakobsen, 1993). These effects must be con-sidered by fertilizer recommendations in order to prevent possible nutritional imbalances in the grove that will prob-ably cause fruit yield losses. Research results have pointed out to lower Ca and Mg contents in the spring flush leaves collected from fruiting terminals in a commercial grove with six-year-old ‘Murcott’ tangor trees conducted on a sandy loam Oxisol. This caused the occurrence of stem dieback and reduced fruit yield because of the high rates of K applied during several years of fertilization (Mattos Jr. et al., 2003). Table 1 – Effect of potassium fertilization on fruit quality of ‘Pêra’ sweet orange trees in Santa Cruz do Rio Pardo. Data represent
mean values for the 2001-2004 period.
nsnon-significant; *significant at p = 0.05; means followed by different letters in the column are different (Tukey test, p < 0.05).
K2O Juice content Total soluble solids (TSS) Acidity TSS per box TSS per area
kg ha–1 % °Brix mg 100 mL–1 kg kg ha–1
0 58.5 10.6 0.7500 2.54 2570 b
100 59.2 10.8 0.7783 2.61 2869 ab
200 60.2 10.7 0.7867 2.62 3000 a
300 61.3 10.4 0.7667 2.62 3068 a
Mean 59.8 10.6 0.7704 2.60 2877
F test
Rate (R) 3.26ns 1.88ns 2.86ns 1.67ns 4.69*
Source (S) 0.05ns 0.99ns 0.20ns 0.30ns 0.25ns
R*S 0.40ns 2.23ns 3.52ns 2.81ns 0.18ns
CV, % 2.73 2.31 2.99 2.85 8.67
Table 2 – Effect of potassium fertilization on fruit quality of ‘Valencia’ sweet orange trees in Matão. Data represent mean values for the 2001-2004 period.
nsnon-significant; *, **significant at p = 0.05, 0.01, respectively. Fertilizer source comparison: means followed by different capital letters
in the lines are different (Tukey test, p < 0.05). K2O rates comparison: means followed by different small letters in the column are different (Tukey test, p < 0.05).
K2O Juice content Total soluble solids (TSS) Acidity TSS per box TSS per area
KCl K2SO4
kg ha–1 --- % --- °Brix mg 100 mL–1 kg kg ha–1
0 59.0 Ba 64.1 Aa 10.8 0.7590 2.71 a 2202 c
100 57.0 Aa 57.4 Ab 10.8 0.7630 2.51 b 2645 b
200 57.5 Aa 57.9 Ab 10.7 0.7703 2.51 b 2592 b
300 56.7 Ab 54.8 Ac 10.7 0.7735 2.44 b 2812 a
Mean 57.5 58.5 10.7 0.7665 2.54 2563
Prob. >F
Rate (R) 17.85** 0.05ns 0.88ns 19.17** 16.49**
Source (S) 2.95ns 4.01ns 0.62ns 1.92ns 0.20ns
R*S 6.07* 0.38ns 0.66ns 2.23ns 1.15ns
CV, % 2.48 3.01 4.26 2.49 6.08
Figure 3 – Effects of potassium fertilization on leaf nutrient concentration of ‘Pêra’ (Santa Cruz do Rio Pardo) and ‘Valencia’ (Matão) sweet oranges in two locations in the State of São Paulo, Brazil. Data represent mean values for the 2001-2004 period. **Significant at p < 0.01.
Pêra = -0.00004x2+ 0.029x + 8.40
R² = 0.98**
Valência = -0.00005x2+ 0.025x + 12.14
R² = 0.99**
5 10 15 20
0 100 200 300
L
e
af
K
, g
k
g
–1
Figure 5 – Effect of K source and rate on leaf sulfur and chlorine concentrations of ‘Pêra’ (Santa Cruz do Rio Pardo: A and C) and ‘Valencia’ (Matão: B and D) sweet oranges in two locations in the State of São Paulo, Brazil. Data represent mean values for the 2001-2004 periods. ns, not significant. *Significant at p < 0.05. **Significant at p < 0.01
KCl = -0.0005x + 3.16 R² = 0.17ns
K2SO4= -0.0004x + 3.15
R² = 0.18ns
2.0 2.5 3.0 3.5 4.0
0 100 200 300
L e a f S-SO 4
, g
kg
–1
K2O, kg ha–1
K2SO4
KCl
B)
Leaf concentration of sulfur (S) did not change with fer-tilizer sources, with approximately 3.0 g kg–1 for all tested K rates (Figure 5A and 5B). Fruit yield responses of citrus do not suffer much interference when leaf S is above 2.0 g kg–1 (Malavolta et al., 1987), which is probably associated to the limited amount of the nutrient exported with fruit harvest (about 4.5 kg ha–1
; Mattos Jr. et al., 2007). Furthermore, S sup-ply by pesticide and micronutrient applications in citrus groves likely hindered the effects of additional input of this nutrient with the use of K2SO4. An annual input of 30 to 50 kg ha–1 of S is estimated because of management practices, and which amounts may far exceed such range if nitrogen and
phospho-rus fertilizers containing S are used (Mattos Jr. et al., 2007). On the other hand, chloride (Cl) concentration in the leaves of trees varied with the application of KCl fertilizer, which was up to 375 mg kg–1
(Figure 5C and 5D). However, there were no adverse effects on fruit yield and quality of trees caused by Cl. Effects of excess Cl are expected to occur when leaf concentration is above 1000-2000 mg kg–1
as reported for or-ange (Syvertsen et al., 1993), lemon (García-Sánchez et al., 2003) and mandarin trees (García-Sánchez et al., 2006); this is also greatly dependent on citrus species since lemons are more sen-sitive than oranges (Lloyd et al., 1989) as well as on rootstock varieties (Ruiz et al., 1997; García-Sánchez et al., 2003, 2006).
Figure 4 – Effect of potassium on calcium and magnesium concentration in leaves of (A) ‘Pêra’ (Santa Cruz do Rio Pardo) and (B) ‘Valencia’ (Matão) sweet oranges in two locations in the State of São Paulo, Brazil. Data represent mean values for the 2001-2004 period. **Significant at p < 0.01.
Ca = -1.55x + 56.8 r = 0.94** Mg = -0.28x + 8.9
r = 0.97** 3
4 5 6 20 25 30 35 40
11 13 15 17
Le
a
f
Mg
, g
k g –1 Le a f C a , g kg –1
Leaf K, g kg–1
Ca Mg
B)
Mg = -1.12x + 45.7 r = 0.98** Ca= -0.24x + 6.9
r = 0.97**
2 3 4 5 6 20 25 30 35 40
7 9 11 13 15
L eaf M g , g k g –1 L eaf C a , g k g –1
Leaf K, g kg–1
Ca Mg
A)
K2SO4= 0.0332x + 347.91
R² = 0.17ns
KCl = -0.0005x2+ 0.4385x + 345.81
R² = 0.93**
200 250 300 350 400 450
0 100 200 300
Le
a
f
C
l, m
g
k
g
–1
K2O, kg ha–1
KCl K2SO4 C) KCl K2SO4 C)
KCl = -0.0022x2+ 0.838x + 306.19
R² = 0.94**
K2SO4= 0.0076x + 298.92
R² = 0.07ns
200 250 300 350 400 450
0 100 200 300
Le
a
f
C
l, mg
kg
–1
K2O, kg ha–1
K2SO4 KCl
D)
K2SO4= 0.001x + 3.5264
R² = 0.61ns KCl = 0.0001x + 3.7225
R² = 0.01ns
2.0 2.5 3.0 3.5 4.0 4.5
0 100 200 300
L e a f S-SO 4
, g
kg
–1
K2O, kg ha–1
KCl K2SO4
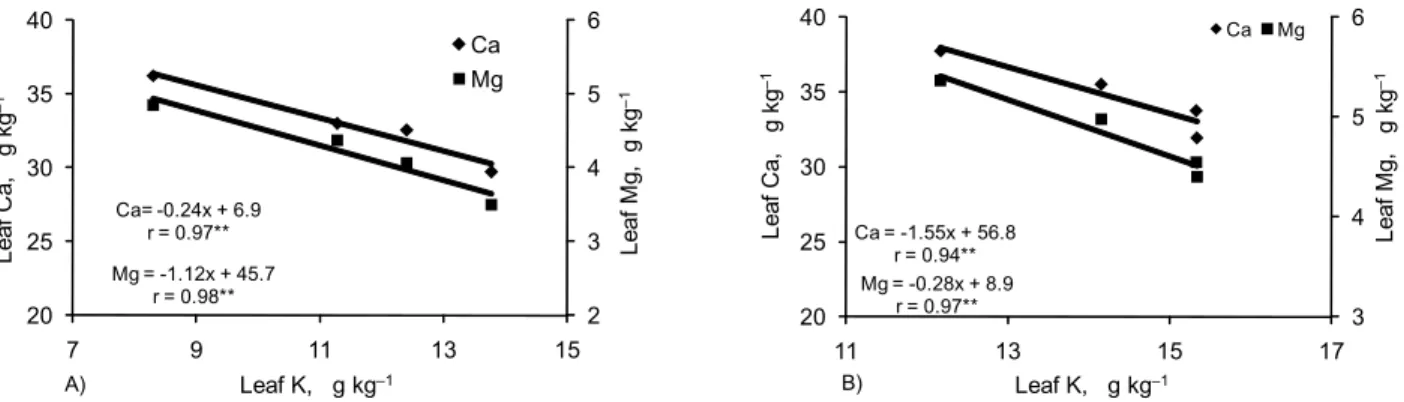
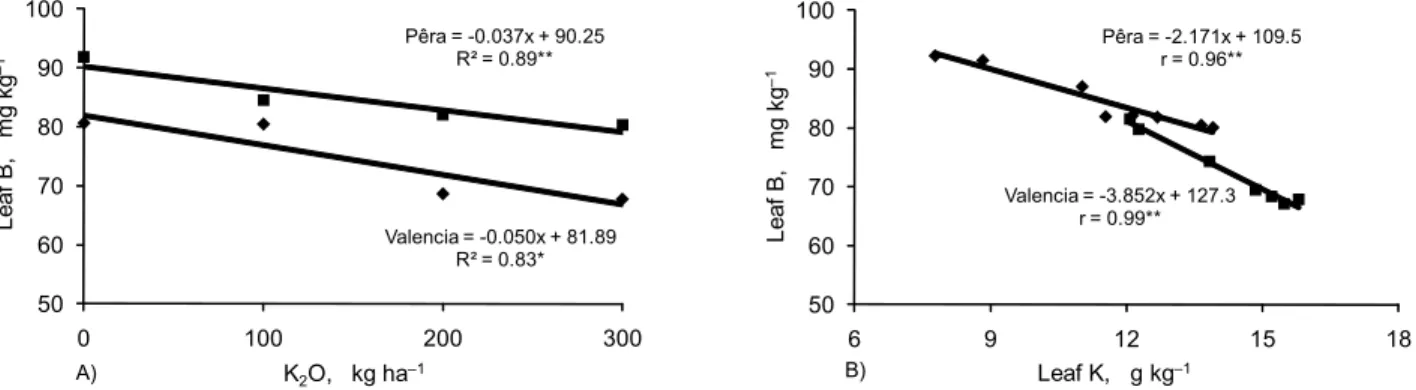
Other results of leaf analysis demonstrated a signifi-cant interaction (p < 0.05) between K and B contents of leaves in both locations, in which leaf B decreased about ten units B with increased K fertilization (Figure 6A and 6B). Such effect was also described for alfalfa (Wallace and Bear, 1949) and avocados (Jaime et al., 1992), even though no specific mechanism at the plant level was proposed to explain such results. Conversely, K uptake by plants is in-creased with B supply (Cooper et al., 1952; Schon et al., 1990; Obermeyer et al., 1996; Quaggio et al., 2003; Grassi et al., 2004). In this case, B facilitates K uptake probably because of increased hyperpolarization of the plasma mem-brane (Schon et al., 1990).
Conclusions
Potassium rates affected production of both orange va-rieties, even though there were no effects of KCl and K2SO4 sources on either fruit yield or quality in the long term study. Fruit size increased with K supply, which was associated with increased leaf K concentration. Despite K fertilization caused least differences on total soluble solids (TSS) concentration of orange juice, TSS yield per area basis increased by increas-ing the K rates. Leaf concentration of S did not change with potassium sources. On the other hand, chlorine levels in the leaf varied with rates of KCl. However, no adverse effects on fruit yield and quality of trees were caused by excess Cl. Increased leaf K caused decreases on leaf Ca, Mg and B. A linear increase on soil exchangeable K occurred with increased K fertilization, even though maximum fruit yield was ob-served at approximately K = 2.7 mmolc dm–3
.
Acknowledgements
To FAPESP for financial support, CNPq for research fel-lowships and Grupo Nova America (Santa Cruz do Rio Pardo) and Cambuhy Agrícola (Matão) for field assistance.
References
Alva, A.K.; Mattos Jr., D.; Paramasivam, S.; Patil, B.; Dou, H.; Sajwan, K. 2006. Potassium management for optimizing citrus production and quality. International Journal of Fruit Science 6: 3-43.
Bañuls, J.; Primo-Millo, E. 1992. Effects of chloride and sodium on gas exchange parameters and water relations of Citrus plants. Physiologia Plantarum 86: 115-123.
Bataglia, O.; Rodriguez, O.; Hiroce, R.; Gallo, J.R.; Furlani, P.R.; Furlani, A.M.C. 1977. Mineral composition of citrus fruits in the harvest. Bragantia 36: 215-221. (in Portuguese, with abstract in English). Bataglia, O.C.; Furlani, A.M.C.; Teixeira, J.P.F.; Furlani, P.R.; Gallo J.R.
1983. Me tho ds for Ch emi cal Analysis of Plants. I nst ituto Agronômico, Campinas, SP, Brazil. (in Portuguese).
Cantarella, H.; Mattos Jr., D.; Quaggio J.A.; Rigolin A.T. 2003. Fruit yield of Valencia sweet orange fertilized with different N sources and the loss of applied N. Nutrient Cycling in Ag roecosystems 67: 215-223.
Cooper, W.C.; Gorton, B.S.; Olson, E.O. 1952. Ionic accumulation in citrus as influenced by rootstock and scion and concentration of salts and boron in the substrate. Plant Physiology 27: 191-203. García-Sánchez, F.; Carvajal, M.; Porras; I. Martínez; V. 2003. Effects of
salinity and rate of irrigation on yield, fruit quality and mineral composition of ‘Fino 49’ lemon. European Journal of Agronomy 19: 427-437.
García-Sánchez, F.; Perez-Perez, J.G.; Botia, P.; Martínez, V. 2006. The response of young mandarin trees grown under saline conditions depends on the rootstock. European Journal of Agronomy 24: 129-139.
Gimeno, V.; Syvertsen, J.P.; Nieves, M.; Simón, I.; Martínez; V.; García-Sánchez, F. 2009. Additional nitrogen fertilization affects salt to leranc e o f l emo n t ree s o n d iff ere nt roo tst ocks. Sci ent ia Horticulturae 121: 298-305.
Grassi, H.; Dechen, A.R.; Torquato, E.M.; Santos, C.H. 2004. Fenological characteristics of the ‘Siciliano’ lemon tree on two rootstocks influenced by liming and boron addition. Brazilian Archives of Biology and Technology 47: 677-684.
Jakob sen , S.T. 1993. Nutri tio nal di sorders b etween po tassium, magnesium, calcium, and phosphorus in soil. Plant and Soil 154: 21-28.
Jaime, S.; Subires, M.J.; Soria, J.T.; Aguilar, A. 1992. Interaction K-B in avocado (Persea americana Mill.) culture. Acta Horticulturae 296: 75-80.
Koo, R.C.J.; Reese, R.L. 1972. A comparison of potash sources and rates for citrus. Proceedings of the Florida State Horticultural Society 85: 1-5.
Laegreid, M.; Bøckman, O.C.; Kaarstad, O. 1999. Agriculture, Fertilizers and the Environment. CABI, Wallingford, UK.
Lloyd, J.; Kriedemann, P.E.; Aspinall, D. 1989. Comparative sensitivity of ‘Prior Lisbon’ lemon and ‘Valencia’ orange trees to foliar sodium and chloride concentrations. Plant, Cell and Environment 12: 529-540.
Malavolta, E.; Vitti, G.C.; Rosolem, C.A.; Fageria, N.K.; Guimarães, P.T.G. 1987. Sulphur responses of Brazilian crops. Journal of Plant Nutrition 10: 2153-2158.
Figure 6 – Concentration of leaf boron as affected by (A) potassium fertilization and (B) nutritional status of ‘Pêra’ (Santa Cruz do Rio Pardo) and ‘Valencia’ (Matão) sweet oranges in two locations in the State of São Paulo, Brazil. Data represent mean values for the 2001-2004 period. *Significant at p < 0.05. **Significant at p < 0.01.
Valencia = -0.050x + 81.89 R² = 0.83* Pêra = -0.037x + 90.25
R² = 0.89**
50 60 70 80 90 100
0 100 200 300
Le
a
f
B
, m
g
kg
–1
K2O, kg ha–1
A)
Pêra = -2.171x + 109.5 r = 0.96**
Valencia = -3.852x + 127.3 r = 0.99**
50 60 70 80 90 100
6 9 12 15 18
Le
a
f
B
, mg
kg
–1
Leaf K, g kg–1
Mattos Jr., D.; Quaggio, J.A.; Cantarella, H.; Alva, A.K. 2003. Nutrient content of biomass components of Hamlin sweet orange trees [Citrus sinensis (L.) Osb.]. Scientia Agricola 60: 155-160. Mattos Jr., D.; Quaggio, J.A.; Cantarella, H.; Boaretto, A.E. 2007. Nitrogen
and sulfur in citrus orchard. p. 413-443. In: Yamada, T.; Stipp E; Abdalla, S.R.; Vitti, G.C., eds. Nitrogen and sulfur in Brazilian agriculture. International Plant Nutrition Institute, Piracicaba, SP, Brazil. (in Portuguese, with abstract in English).
Obermeyer, G.; Kriechbaumer, R.; Strasser, D.; Maschessnig, A.; Bentrup, F.W. 1996. Boric acid stimulates the plasma membrane HC-ATPase o f un germin ate d l ily po lle n g rain s. Phy sio log ia Plantarum 98: 281-290.
Ob reza, T.A.; Morg an , K.T.; Albrig o, G.; Boman, B.J. 2008. Recommended fertilizer rates and timing. p. 48-59. In: Obreza, T.A.; Morgan, K.T., eds. Nutrition of Florida citrus trees. 2ed. University of Florida, Gainesville, FL, USA.
Pio, R.M.; Figueiredo, J.O.; Stuchi, E.S.; Cardoso, S.A.B. 2005. Scion varieties. p. 37-60. In: Mattos Jr., D.; De Negri, J.D.; Pio, R.M.; Pompeu Jr., J., eds. Citrus. Instituto Agronômico/Fundag, Campinas, SP, Brazil. (in Portuguese).
Quag gio, J.A.; Cantarella, H.; Raij, B. van. 1998. Phosphorus and potassium soil test and nitrogen leaf analysis as a base for citrus fertilization. Nutrient Cycling in Agroecosystems 52: 67-74. Quaggio, J.A.; Mattos Jr., D.; Cantarella, H. 2005. Soil fertility management
in the citriculture. p. 483-507. In: Mattos Jr., D.; De Negri, J.D.; Pio, R.M.; Pompeu Jr., J., eds. Citrus. Instituto Agronômico/Fundag, Campinas, SP, Brazil. (in Portuguese).
Quaggio, J.A.; Mattos Jr., D.; Cantarella, H. 2006. Fruit yield and quality of sweet oranges affected by nitrogen, phosphorus and potassium fertilization in tropical soils. Fruits 61: 293-302.
Quaggio, J.A.; Mattos Jr., D.; Cantarella, H.; Almeida, E.L.E.; Cardoso, S.A.B. 2002. Lemon yield and fruit quali ty affected by NPK fertilization. Scientia Horticulturae 96: 151-162.
Quaggio, J.A.; Mattos Jr., D.; Cantarella, H.; Tank Jr., A. 2003. Boron and zinc application on soil as complement to leaf spray on orange Pera trees. Pesquisa Agrope cuaria Brasilei ra 38: 627-634. (in Portuguese, with abstract in English).
Redd, J.B.; Hendrix Jr.; C.M.; Hendrix, D.L. 1986. Quality Control Manual for Citrus Processing plants. Intercit, Safety Harbour, FL, USA.
Reese, R.L.; Koo, R.C.J. 1975. Effects of N and K fertilization on internal and external fruit quality of three major Florida orange Varieties. Journal of American Society for Horticultural Science 100: 425- 428.
Ruiz, D.; Martínez, V.; Cerdá, A. 1997. Citrus response to salinity: growth and nutrient uptake. Tree Physiology 17: 141-150. SAS Institute. 1996. The SAS System: Release 6.12. SAS Institute, Cary
NC, USA.
Sc hon , M .K.; Novacky, A.; Blevins, D.G. 1990. Bo ron in duc es hyperpolarization of sunflower root cell membranes and increases membrane permeability to K+. Plant Physiology 93: 566-571. Syvertsen, J.P.; Smith, M.L.; Boman, B.J. 1993. Tree growth, mineral
nutrition and nutrient leaching losses from soil of salinized citrus. Agriculture, Ecosystems and Environment 45: 319-334. Raij, B. van; Andrade, J.C.; Cantarella, H.; Quaggio, J.A. 2001. Chemical
Analysis for Evaluation of the Fertility of Tropical Soils. Instituto Agronômico, Campinas, SP, Brazil. (in Portuguese).
Wallace, A.; Bear, F.E. 1949. Influence of potassium and boron on nutrient-element balance in and growth of ranger alfalfa. Plant Physiology 24: 664-680.