v.11, n.1, p.46–52, 2007
Campina Grande, PB, DEAg/UFCG – http://www.agriambi.com.br Protocolo 103.05 – 05/08/2005 • Aprovado em 27/11/2006
Sensor placement for soil water monitoring
in lemon irrigated by micro sprinkler
Eugênio F. Coelho1, Delfran B. dos Santos1 & Carlos A. V. de Azevedo2
ABSTRACT
This research had as its objective the investigation of an alternative strategy for soil sensor placement to be used in citrus orchards irrigated by micro sprinkler. An experiment was carried out in a Tahiti lemon orchard under three irrigation intervals of 1, 2 and 3 days. Soil water potential, soil water content distribution and root water extraction were monitored by a time-domain-reflectometry (TDR) in several positions in soil profiles radial to the trees. Root length and root length density were determined from digital root images at the same positions in the soil profiles where water content was monitored. Results showed the importance of considering root water extraction in the definition of soil water sensor placement. The profile regions for soil water sensor placement should correspond to the intersection of the region containing at least 80% of total root length and the region of at least 80% of total water extraction. In case of tensiometers, the region of soil water potential above -80 kPa should be included in the intersection.
Key words: tensiometer, soil water content, soil water potential, irrigation management
Posicionamento de sensores para monitoramento de água
no solo em limoeiro irrigado por microaspersão
RESUMO
Este trabalho teve como objetivo investigar uma estratégia alternativa de posicionamento de sensores de água no solo, para uso em pomares de citros irrigados por microaspersão. Um experimento foi conduzido em um pomar de limão Tahiti, sob três intervalos de irrigação: 1, 2 e 3 dias. A distribuição de umidade, potenciais de água e extração de água do solo foram monitorados por um analisador de umidade de reflectometria no domínio do tempo (TDR) em várias posições, em perfis do solo radiais às plantas. Comprimento e densidade de raízes foram determinados a partir de ima-gens digitais nas mesmas posições onde a umidade fora monitorada. Os resultados mostraram a importância de se con-siderar a extração de água pelas raízes na definição da posição dos sensores de água do solo. As regiões do perfil para posicionamento de sensores de água do solo devem corresponder à interseção da região com pelo menos 80% do com-primento total das raízes e à região de ocorrência de pelo menos 80% da água total extraída no perfil. No caso de tensiômetros, a região de potenciais acima de -80 kPa deve ser incluída na interseção dessas regiões.
Palavras-chave: tensiômetro, umidade do solo, potencial de água do solo, manejo de irrigação
1 Embrapa Cassava and Fruits. Mail Box 7, CEP 44380-000, Cruz das Almas, Bahia, Brazil. Fone: 75 3621 8021. E-mail: [email protected]
I
NTRODUCTIONSensors have been recommended for soil water monitor-ing for a long time all over the world (Campbell & Camp-bell, 1982). Many kinds of sensors are available, however tensiometers, electrical resistance blocks for soil water po-tential, TDR (time domain reflectometry), surface capacitance insertion probes and neutron probes for soil water content have been the most common in field work. The use of sen-sors for soil water monitoring should take under consider-ations factors such as the number of stconsider-ations for readings and their placement. The number of stations for monitoring is strongly dependent upon soil spatial variability and has been studied by some authors (Hendricks & Wierenga, 1990, Doorembos & Kassam, 1994). Stegman (1982) recommend-ed the use of four stations for 65 ha. Schimitz & Sourell (2000) compared the use of TDR to granular matrix sensors and found that the number of stations should be at least nine under uniform soil conditions.
Sensor placement is fundamental in soil water monitor-ing. A sensor installed in a soil zone without roots does not detect changes in water content as it would if installed in the zone of high root concentration. Sensor placement in soil wetted volume under irrigation depends upon soil flow con-ditions, i.e., the locations for sensors under one-dimension-al flow (sprinkler irrigation) are different from the ones for sensors under three-dimensional flow (trickle irrigation). Under sprinkler irrigation (one-dimensional flow), the sen-sor placement should be limited to root distribution, since soil water content is uniform everywhere in the soil. Under trickle irrigation, sensor placement depends upon not only root distribution, but also water distribution in the wetted volume.
Sensor placement recommendations for soil water moni-toring have been made on an empirical basis (Pogue & Pooley, 1985). Sensors should be located at the upper and lower limits of the root water uptake zone (Haise & Hagan, 1967) and should be located close to the emitter in case of drip irrigation (Phene & Howell, 1984, Levin et al., 1985). Two sensors should be installed at different depths accord-ing to the root layer, where the deeper one should be twice the depth of the shallower (Stegman, 1982).
Soil water monitoring for fruit crop irrigated by trickle requires special care during sensor placement, because of the larger root volume of these crops and the uncertainty of lo-cations of representative root activity zones. Few references have been found in this subject. Machado & Coelho (2000) verified that tensiometers should be placed at distances from the plants of 25 to 75% of the canopy radius and at depths of 0-0.2, 0.2-0.4 and 0.4-0.6 m for ‘Tahiti’ lemon plant. They recommend that the first two layers should be used to indi-cate the irrigation moment and the third one to evaluate the irrigation water depth in soil. Oliveira (2001) has worked with mango, finding that soil water sensors should be locat-ed at 0 to 65% of canopy radius and at depths of 0-0.6 m and Santos (1997) has found the distances of 1.0 to 1.5 m from the plant and the depths of 0.2, 0.4 and 0.6 m as the adequate zone for tensiometer placement. These references
were based upon the concepts of effective root depth, i.e., the limit depth of 80% of total roots (Arruda, 1989) and on the root effective distance, i.e., the limit distance of 80% of to-tal roots (Vieira et al., 1996). This approach does not con-sider the root uptake zone, whose limits may be different from the ones of the effective root zone.
This work contributes to soil water monitoring in spray-er irrigated ‘Tahiti’ lemon by introducing an altspray-ernative strat-egy for defining zones of wetted volume for sensor place-ment. Besides the effective root distribution and soil water distribution, the alternative strategy includes the effective root uptake distribution in the wetted volume. It overlaps infor-mation about these three distributions in order to define zones of wetted volume more adequate for sensor placement for irrigation management purposes.
M
ATERIALANDMETHODSThe work was carried out in an orchard of Tahiti lemon five years old Citrumelo swingle rootstock, at 12° 34’ S lat-itude and 40° 01’ W longlat-itude. The local climate belongs to the BSwh class according to Koppen methodology. The Ta-hiti lemon plants had 4 x 7 m spacing and were irrigated by sprayers of 38 L h-1 installed at 0.2 m from plant. The soil
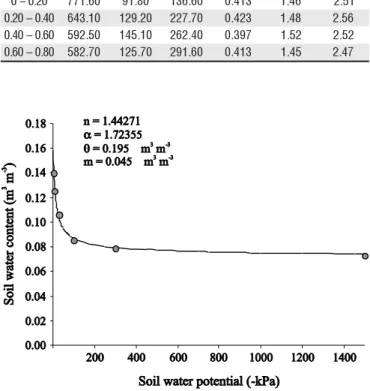
was a sandyloam distrophic Yellow Latossol with the physi-cal characteristics as shown in Table 1, and Figure 1 obtained according to EMBRAPA (1997).
h t p e D ) m ( e r u t x e
T (gkg-1)
l a t o T y t i s o r o P m ( 3m-3)
k l u B y t i s n e D m g M ( -3)
s e l c it r a P y t i s n e d m g M ( -3) d n a s l a t o
T Slit Clay
0 –0.20 771.60 91.80 136.60 0.413 1.46 2.51 0
2 .
0 –0.40 643.10 129.20 227.70 0.423 1.48 2.56 0
4 .
0 –0.60 592.50 145.10 262.40 0.397 1.52 2.52 0
6 .
0 –0.80 582.70 125.70 291.60 0.413 1.45 2.47 Table 1. Soil physical characteristics of the experimental area, Iaçu, Bahia State, Brazil, 2001
0.00 0.00 0.02 0.02 0.04 0.04 0.06 0.06 0.08 0.08 0.10 0.10 0.12 0.12 0.14 0.14 0.16 0.16 0.18 0.18 200
200 400400 600600 800800 10001000 12001200 14001400
Soil water potential (-kPa) Soil water potential (-kPa)
Soil water content (m m Soil water content (m m )) 33 -3-3
n = 1.44271 n = 1.44271
α
α= 1.72355= 1.72355
θ
θ= 0.195= 0.195 m mm m33 -3-3 m = 0.045 m m m = 0.045 m m33 -3-3
Three irrigation intervals (1, 2 and 3 days) were consid-ered and two plants were used for each irrigation interval. The experiment was carried out during the fruiting phase and in October, when evapotranspiration reaches its highest val-ues over the year. The amount of irrigation water was calcu-lated based upon 100% of reference evapotranspiration (ETr), since there was no precipitation during the period. The irri-gation times were calculated from the net application depth (ETr), an assumed application efficiency as 85% and the application intensity of the emitter. The data were collected during two irrigation cycles and the times of irrigation were 2 h and 30 min for one-day irrigation intervals, 4 h and 20 min for two-day irrigation intervals and 6 h and 30 min for three-day irrigation intervals.
Soil water distribution and root water extraction
TDR wave-guides were inserted in two soil profiles for each plant. One profile was in a longitudinal direction and the other in an orthogonal direction to plant row. The wave-guides were installed at a horizontal distances from the plant of 0.15, 0.25, 0.50, 0.75, 1.0, 1.5, 2.0 and 2.5 m; at depths of 0.15, 0.25, 0.50, 0.75, 1.0 and 1.2 m. Small con-tainers of 0.5 L capacity were located at the same horizon-tal distances from the plant to collect the water distribu-tion over the soil surface during the irrigadistribu-tion event. After the irrigation event, the soil was covered by a plastic sheet to avoid soil evaporation. Soil water content data were col-lected in all profiles immediately before and after irriga-tion and at the end of the day. Deep percolairriga-tion was mon-itored by soil water content variation at deeper positions in the soil profiles (1.2 m), mainly close to the emitter. Root water extraction at a location (r, z) between two irrigation events was computed by the difference between water con-tent at a time j after an irrigation event and at a time j+1 before the next irrigation event (Coelho & Or, 1996; Coel-ho & Or, 1999):
where,
τ(r,z) – water extracted by unit soil volume by roots,
m3m-3
θj– Soil water content immediately after irrigation, m3m-3
θj+1– Soil water content before next irrigation, m3m-3
Root Distribution
Blocks of soil samples of 0.10 x 0.10 x 0.05 m were col-lected at the same positions in the profiles where wave guides were inserted. Samples were collected from the soil surface to the depth of 1.2 m and from the plant to a horizontal dis-tance of 2.5 m away. Roots were separated from soil by a washing process (Bohm, 1979) and recorded using a 600 DPI resolution scanner. They were digitized to TIFF (Tagged Im-age File Format) imIm-age files. Length, diameter and area of roots were estimated using the Rootedge software package (Kaspar & Ewing, 1997). Root length density (RLD) values were computed by:
where,
RLD – root length density, m m-3
LR– Total root length of the sample, m
VR– total volume of the sample, m3
R
ESULTSANDDISCUSSIONThe definition of appropriate locations for sensor place-ment should be a result from evaluation of soil water poten-tial distribution, root distribution and water extraction by roots in the wetted volume under the sprayer.
Soil water distribution
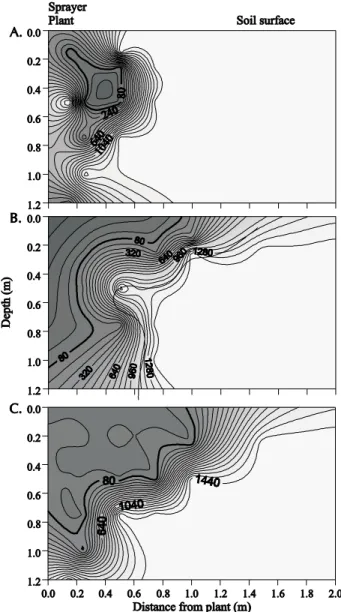
Figure 2 depicts soil water potential distribution in the wetted volume after irrigation for 1, 2 and 3-day irrigation intervals. The size of the wetted volume varied according to
1
+ θ − θ =
τ j j (1)
R R
V L
RLD = (2)
0.0
0.0 0.20.2 0.40.4 0.60.6 0.80.8 1.01.0 1.21.2 1.41.4 1.61.6 1.81.8 2.02.0 1.2
1.2 1.0 1.0 0.8 0.8 0.6 0.6 0.4 0.4 0.2 0.2 0.0 0.0 1.2 1.2 1.0 1.0 0.8 0.8 0.6 0.6 0.4 0.4 0.2 0.2 0.0 0.0 1.2 1.2 1.0 1.0 0.8 0.8 0.6 0.6 0.4 0.4 0.2 0.2 0.0 0.0
Soil surface Soil surface Sprayer
Sprayer Plant Plant
Depth
(m)
Depth
(m)
Distance from plant (m) Distance from plant (m)
B. B. A. A.
C. C.
Figure 2. Soil water potential distribution (-kPa) in the wetted volume under
the amount of applied water. The larger the amount of ap-plied water, the larger the depth of wetted volume and re-gions of high water potentials.
The irrigation water reached distances of 2.5 m from the sprayer at the soil surface. However, the zone of water poten-tials equal or larger than -80 kPa was limited to horizontal distances from the sprayer of equal or less than 1.0 m and to depths of less than 1.1 m for the three irrigation intervals. In the majority of the profiles the horizontal distance of 1.0 m limited the region of potentials to equal or larger than -80 kPa. These results are justified by the fact that 80 to 95% of water emitted by the sprayer infiltrated into the soil at a maximum distance of 1.5 m from it (Figure 3). The amount of water that reached the soil beyond this distance was not enough to raise the water content to soil water availability. Some of this water could have been evaporated even before having infiltrated into the soil.
Root distribution
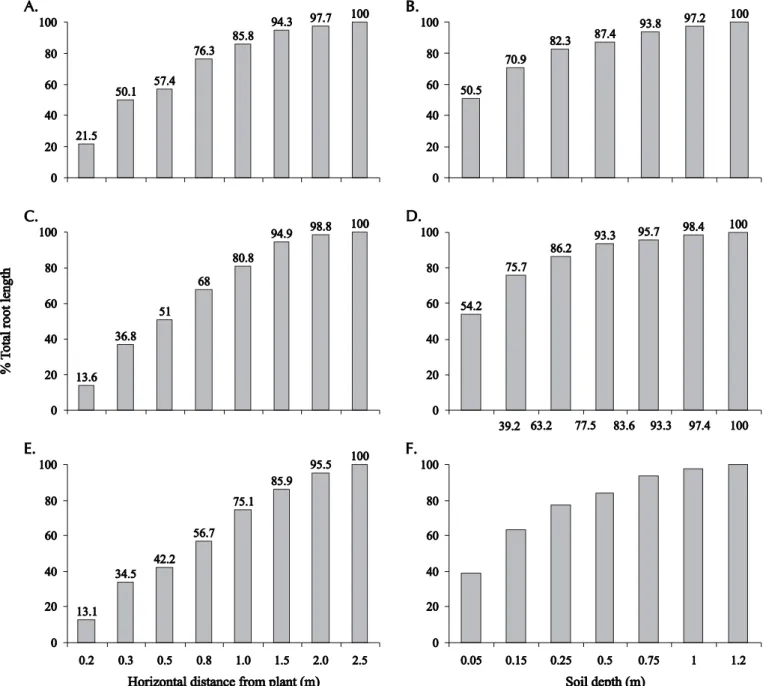
In this work the concept of effective root depth, DPe, , was used. This is the depth of the soil profile that contains 80% of total root length (Arruda, 1989). Also used was the concept of effective root distance, DTe. This is the distance from plant that contains 80% of total root length (Vieira et al., 1996). 82.3 to 84.7% of the total root length was found in the shallow soil layer (0 – 0.25 m depth) and 84.1 to 85.8% was found up to 1.0 m from the plant in the profiles longitudinal and orthogonal to plant row for one-day irriga-tion interval (Figure 4A and B). The larger RLD values were found at depths of 0 to 0.25 m and at distances of 0 to 1.5 m from the plant.
In the case of the two-day irrigation interval, 86.2 to 87.5% of total root length was found at depths of 0 to 0.25 m, and 78.9 to 80.8% at distances less than 1.0 m from the plant in the profiles longitudinal and orthogonal to plant row (Figure 4C and D). The larger RLD values were found in the zone limited by 0 to 1.7 m of horizontal distance from plant at 0-0.2 m depths.
In the case of the three-day irrigation interval (Figure 4E and F), 85.9 to 92.1% of total root length was found at depths of less than 0.5 m, and 83.6 to 89.6% at distances less than 1.5 m from plant in the profiles orthogonal and longitudinal to plant row. Larger RLD values were found at 0-0.3 m depths in the soil profile, at distances from plants of 0 to 2.1 m. The occurrence limits of at least 80% of total roots at distances 0 to 1.0 m from the plant coincides with the occurrence limits of 80% of total applied water over the soil surface by the sprayer for 1 and 2-day irrigation intervals. In the case of the three-day irrigation interval, these occurrence limits extended laterally giving space for root development.
Root water extraction
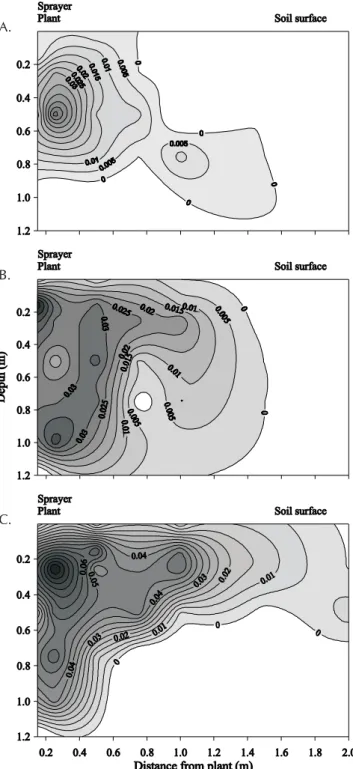
Root water extraction was observed all over the region of soil profile corresponding to depths of 0 to 0.8 m and at distances from the plant of 0 to 0.7 m during one ir-rigation cycle for one-day irir-rigation interval. The zone of largest extraction occurred for distances of 0 to 0.3 m from the plant and depths less than 0.5 m (Figure 5A). For the two-day irrigation interval, root water extraction was more pronounced in the zone of the soil profile lim-ited by the distance of 0.5 m from the plant and 0.5 m from the soil surface (Figure 5B), but it occurred all over the region of soil profile in the 1.2 m from the plant and at 0 - 0.8 m depth. The root water extraction was ob-served at 0 to 1.1 m depths for distances 0 to 0.5 m from the plant and at depths less than 0.5 m for distances 0.5 m to 1.5 m from the plant (Figure 5C) for the three-day irrigation interval.
Results showed that root activity intensity reduced as the distance from the sprayer increased. Eighty percent of total root water extraction occurred at distances of 0 to 1.2 m from the plant where 80% of the total water applied over the soil surface by the sprayer was verified. Ninety-five percent of total applied water over the soil surface occured at distances of 0 to 1.5 m from the emitter.
0 0 20 20 40 40 60 60 80 80 100 100
0,2
0,2 0,30,3 0,50,5 0,80,8 1,01,0 1,51,5 2,02,0 2,52,5
Radial distance from emitter (m) Radial distance from emitter (m)
%%
TT
otal
water
depth
(m)
otal
water
depth
(m)
Longitudinal
Longitudinal OrtogonalOrtogonal 0
0 20 20 40 40 60 60 80 80 100 100 A. A.
B. B.
C. C.
0 0 20 20 40 40 60 60 80 80 100 100
Figure 3. Soil surface water distribution from irrigation for three irrigation
Sensor placement in the wetted volume
The evaluation of soil water potential distribution by it-self is not enough to define the positions for installing soil water sensors, especially tensiometers. The zones of soil water potential larger than -80 kPa and the zones of larger root water extraction have not coincided with each other for all of the irrigation intervals. There were zones of soil wa-ter potential above -80 kPa without significant root activity and zones of large root activity and soil water potentials smaller than -80 kPa. Also the zones of soil water potential above -80 kPa have not coincided to the ones with 80% of total root length and the regions of high root activity have not coincided to the ones of larger RLD (above 80%).
The distances from plants that limited the zones of larg-er RLD wlarg-ere suplarg-erior to the ones that limited the zones of larger root water extraction. The depths of zones of high root
water extraction were superior to those of high RLD, main-ly close to the plant. The adequate positions for installing soil water sensors should be the zones of the wetted volume, in which variations in water content are highly sensitive to root water extraction. These regions associated with larger RLD corresponded to the zones of effective extraction. The time-response of soil water sensors will be more accurate in these zones, and as a consequence, irrigation will be applied at the right time. The region of larger root water extraction (at least 80% of total water extracted) is dynamic, i.e., it might change position according to variations of water con-tent in the wetted volume. The region of larger root concen-tration (80% of total roots) is static in a specific phase of the crop cycle. The intersection of these two regions results in a more adequate and safer region for soil water sensor placement.
0 0 20 20
50.5 50.5
70.9 70.9
82.3 82.3 87.487.4
93.8
93.8 97.297.2 100100
40 40 60 60 80 80 100 100
21.5 21.5
50.1 50.1 57.457.4
76.3 76.3
85.8 85.8
94.3
94.3 97.797.7 100100
0 0 20 20 40 40 60 60 80 80 100 100
D. D.
54.2 54.2
75.7 75.7
86.2 86.2
93.3
93.3 95.795.7 98.498.4 100100
0 0 20 20 40 40 60 60 80 80 100 100
C. C.
13.6 13.6
36.8 36.8
51 51
68 68
80.8 80.8
94.9
94.9 98.898.8 100100
0 0 20 20 40 40 60 60 80 80 100 100
E. E.
13.1 13.1
34.5 34.5
42.2 42.2
56.7 56.7
75.1 75.1
85.9 85.9
95.5 95.5 100100
0 0 20 20 40 40 60 60 80 80 100 100
0.2
0.2 0.30.3 0.50.5 0.80.8 1.01.0 1.51.5 2.02.0 2.52.5
Horizontal distance from plant (m) Horizontal distance from plant (m)
F. F.
39.2
39.2 63.263.2 77.577.5 83.683.6 93.393.3 97.497.4 100100
0 0 20 20 40 40 60 60 80 80 100 100
0.05
0.05 0.150.15 0.250.25 0.50.5 0.750.75 11 1.21.2
Soil depth (m) Soil depth (m)
%%
TT
otal
root
length
otal
root
length
A.
A. B.B.
Figure 4. Percentage of total root distribution of ‘Tahiti’ Acid Lemon in a profile longitudinal and orthogonal to plant row for one (A, B), two (C, D) and
This approach suggests the concepts of effective depth and distance of root water extraction (PEe and DEe ) as the depth from soil surface and distance from plant, respectively, where at least 80% of total root water extraction is found. Therefore, the intersection of the region that limits 80% of total root length and the region that limits 80% of total water extracted should be assumed as the most adequate for sensor placement and soil water monitoring for irrigation scheduling purposes. The zones of this intersection where soil water potentials are equal or more than -80 kPa become the most adequate for tensiometer placement.
If effective root depth (DPe) and distance (DTe) are taken as a basis in order to define the best region for sensor place-ment, then soil water sensors should be installed at distances from plants of less than 1.0 m and at a maximum depth of 0.25 m for irrigation frequencies of 1 and 2 days. These sen-sors should be installed at distances of 1.5 m from plant and at a maximum depth of 0.5 m for three-day irrigation frequen-cy. On the other hand, if the intersection of the regions limit-ed by (DTe, DPe) and (DEe, PEe) are taken as a basis, the most adequate and safer regions for sensor placement should be those limited by the distance from plants of 0.4 m and by the soil depth of 0.25 m for the one-day irrigation interval; by the distance of 0.5 m and by the depth of 0.25 m for the two-day irrigation interval and by the distance of 1.1 m and depth of 0.5 m for the three-day irrigation interval. The dif-ferences of the limits of the regions for sensor placement based upon the two approaches (using DPe, DTe and the intersec-tion of DPe, DT and DEe, PEe) were not small. A sensor placed in a zone limited by DTe - DPe may not respond suit-ably to plant water needs if it is not also in the zone limited by DEe - PEe where water is being extracted. As a result, sen-sor time-response is going to be larger than it should be and irrigation may not be applied at the right moment.
C
ONCLUSIONS1. The distance from plants and depths of effective root water extraction should be considered for soil water sensor placement definition.
2. The region of soil wetted volume under the sprayer that is more adequate and safer for soil water sensor placement should correspond to the intersection of the region contain-ing at least 80% of total root length and the region of at least 80% of total water extraction. In the case of tensiometers, the region of soil water potential above -80 kPa should be included in the intersection.
L
ITERATURECITEDArruda, F. B. Necessidade de água nas culturas – Elementos de projeto. In: Curso Prático Internacional de Agrometeorolo-gia para Otimização da Irrigação, 3., 1989, Campinas: IAC, 1989. 35p.
Bohm, W. Methods of studying root systems. New York: Spring-er VSpring-erlag, 1979. 190p.
Campbell, G. S.; Campbell, M. D. Irrigation scheduling using soil moisture measurements: theory and practice. In: Hillel, D. (ed.) Advances in Irrigation, New York: Academic Press, 1982. Cap. 2, p.25-42
Coelho, E. F.; Or, D. A parametric model for two-dimensional wa-ter uptake by corn roots under drip irrigation. Soil Science So-ciety of America Journal. Madison, v.60, p.1039-1049, 1996. Coelho, E. F.; Or, D. Modelo de distribuição de água e de
poten-cial matripoten-cial no solo sob gotejamento com extração de água por raízes. Pesquisa Agropecuária Brasileira. Brasilia, v.34, n.2, p.225-234, 1999.
1.2 1.2 1.0 1.0 0.8 0.8 0.6 0.6 0.4 0.4 0.2 0.2
Sprayer Sprayer Plant Plant
Sprayer Sprayer Plant Plant
Sprayer Sprayer Plant Plant
Soil surface Soil surface
Soil surface Soil surface
Soil surface Soil surface
Depth
(m)
Depth
(m)
Distance from plant (m) Distance from plant (m) 1.2
1.2 1.0 1.0 0.8 0.8 0.6 0.6 0.4 0.4 0.2 0.2
0.2
0.2 0.40.4 0.60.6 0.80.8 1.01.0 1.21.2 1.41.4 1.61.6 1.81.8 2.02.0 1.2
1.2 1.0 1.0 0.8 0.8 0.6 0.6 0.4 0.4 0.2 0.2 A.
B.
C.
Figure 5. Root water extraction distribution, (m3m-3), in the wetted volume
Doorenbos, J.; Kassam, A. H. Efeitos da água no rendimento das culturas. Campina Grande: UFPB, 1994. 212 p. Estudos FAO: Irrigação e Drenagem, 33
Haise, H. R.; Hagan, R. M. Soil, plant and evaporative measure-ments as criteria for scheduling irrigation. In: Hagan, R. M., Haise, H. R., Edminster, T. W. Madison (ed.) Irrigation of ag-ricultural lands. American Society of Agronomy, 1967. p.577-604.
Hendrickx, J. M. H.; Wierenga, P. L. Variability of soil water ten-sion in a trickle irrigated field. Irrigation Science, Berlin, v.11, p. 23-30, 1990.
Levin, I.; Sarig, S.; Meron, M. Tensiometers location in controlled automated drip irrigation of cotton. In: Proc. of the Third In-ternational Drip/Trickle Irrigation Congress... Fresno, 1985, p.782-785.
Kaspar, T. C.; Ewing, R. P. Rootedge: Software for measuring root length from desktop scanner images. Agronomy Journal, Mad-ison, v.89, p.932-940, 1997.
Machado, C. C.; Coelho, R. D. Estudo da distribuição espa-cial do sistema radicular do limão “Cravo” enxertado com lima ácida “Tahiti”. Laranja, Cordeirópolis, v.21, n.2, p.359-380, 2000.
Oliveira, F. C. Uso e manejo da água na produção de manga sob condições subúmidas no estado do Piauí. Cruz das Almas: UFBA, 2001. 99p. Dissertação Mestrado
Phene,C. J.; Howell, T. A. Soil sensor control of high-frequency irrigation systems. Transaction of the ASAE, St. Joseph, v.27, p.392-396, 1984.
Pogue, W. R.; Pooley, S. G. Tensiometric management of soil wa-ter. In: Proc. of the Third International Drip/Trickle Irrigation Congress, Fresno, p.761-766. 1985.
Santos, C. A. S. Distribuição espacial e absorção de água pelo sistema radicular da cultura da manga (Mangifera indica L) ir-rigada por microapersão. Piracicaba: ESALQ-USP, 1997. 51p. Dissertação Mestrado
Schmitz, M.; Sourell, H. Variability in soil moisture measurements. Irrigation Science, Berlin, v.19, p. 147-151, 2000.
Stegman, E. C. Irrigation water management. In: Jensen, M. E. (ed.). Design and operation of farm irrigation systems. St. Joseph: American Society of Agricultural Engineers, 1982. p.763-816. Vieira, D. B.; Genovez, A. M.; Gomes, E. M. Determinação da