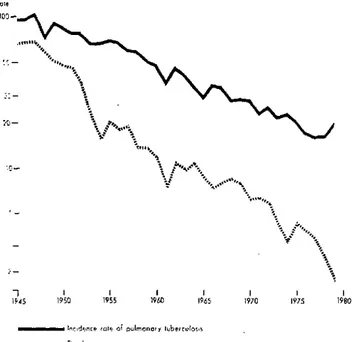
Figure 1. Incidence rates of pulmonary tuberculosis and of as late mortality in chronic cases, which was delayed Lths due to tuberculosis per 100,000 population. Costa Rica, but not prevented by the therapy. The ratio (which in
15-1979. 1965 had been 0.3) continued to fall, which points to an
increase in diagnostic coverage and in the quality of the treatment of the cases detected.
In recent years, the death rate has continued to decline, but the number of cases has increased. which may be due to more intensive case detection. Extrapulmonaryv tuberculosis increased during the course of thc program: in 1945-1949, 10 cases w\ere reported (0.3 per cent) as opposed to 157 cases (7.5 per cent) in 1973-1977. Tuber-culosis incidence fell more rapidly in children under 15 ""'., years (from 29.7 per 100.000 population in 1950 to 1.2
b.0 i4"· , in 1977) than in the age group 15-44 !ears and in thc agr
· - * 'sgroup 45 years and over (137.2 to 24.0 and 1 19.4 to 40.6 per 100.000 population. respectively).
Each year the national control progranm prepares an annual work progranm, quantified hy heiclth scrvice and( by health region (five regions). For 1980, it provides for 1- > 22,000 sputum examinations for the purpose of detecting
-1 , , 119¿0 , 965 , 95 80 and treating 639 cases (515 on an outpatient basis). In
1945 1950 1955 1960 1965 1970 1975 1980
1980 short course treatment will be begun, including the ....
Indne ...le oo ulmono ube,,corlo administration of isoniazid, rifampicin, and pyrazina-...N.+e Deo'h iii,< mide, with complete supervision in 255 cases.
In 1977 BCG vaccination, which was begun in 1968, covered 76.7 per cent of the newborn (88.8 per cent of those born in official institutions) andi 81.3 per cent of is ratio is not really a case fatality rate since the data the school population, according to studies of the preva-)me from different sources-records of new cases of lence of scars prior to vaccination in school.
pulmonary tuberculosis, death certificates-it does indi-cate a lower risk of death in the general population and in the known cases of this disease. The impact of specific therapy became evident between 1951 and 1961; the stabilization in the following years could be interpreted
(Source: Tuberculosis Program, Communicable
Disease Control Unit, Disease Prevention and Control Division, PAHO)
Status of Eastern Equine Encephalitis in Venezuela
Eastern equine encephalomyelitis (EEE) virus was first isolated in Venezuela in sentinel hamsters exposed to the infection in 1975 in the area of Catatumbo, Zulia State.' The virus was isolated at the Institute of Veterinary Re-search in Maracay in 1976 and in 1978, from autopsy
Walder, R. and O.M. Suárez. Primera evidencia en Venezuela de la encefalitis equina del este (EEE) en circunstancias silentes. Bol Div
Maralioly Sorteam Ambiental 16 (2): 119-125, 1976.
materials taken from horses from Zulia2 and Yaracuy States, respectively. Likewise, in 1978 the virus was found in sentinel hamsters in the swampy area at the end of Lake Maracaibo. In 1979 the virus was again recovered from horses that had died in Yaracuy. These findings
2de Siger, J., N. Metter, and J. Castañeda. First isolation of eastern
equine encephalomyelitis virus from a horse in Venezuela. 19th Annual
Proceedings of the American Association of Veterina.ry Laboratory
Diagnosticians. 229-236.
7 1
dea 194
Ro:e
th co
o
I i - ir -q
and those of the study of horse sera obtained between 1972 and 1979 in various states provide some idea of the distribution of EEE in Venezuela.
_ Figure 1 showing the political subdivisions of Vene-ela indicates the areas where the sera were obtained.
Sera were subjected to hemagglutination-inhibition,
complement-fixation, and neutralization tests using Venezuelan equine encephalitis (VEE) and EEE anti-gens. This report is based on the findings related to EEE. In each case a careful analysis was made to determine whether the findings could be attributed to EEE or VEE alone, to dual infection, or to serologic crossings. Sera
Figure 1. Zones from which sera were collected to determine the presence of hemagglutination-lnhiblting antibodies to eastern equine encephalitis in horses.
Venezuela, 1972-1979.
f CAR IBBEAN SEA
3
iR
.·7
X_ 2~4 TRINIDAD ANDTOBAGO
120 i 20 . .. ,...
.. . .-
, ,,..:
'~' 21 , ,
-1. Falc6n 22 ,
2. Federal District ..
3. Nueva Esparta' . i1
4. Sucre COLOMBIA I .. .
5. Zulia
6. Lara 15. Guárico s 23
7. Yaracuy 16. Anzoátegui 23 BRAZIL
8. Carabobo 17. Merida
9. Miranda 18. Barinas ' , '
10. Aragua 19. Delta Amacuro ,. i
11. Monagas 20. Táchira 12. Trujillo 21. Apure 13. Portuguesa 22. Bolivar
14. Cojedes 23. Amazonas Zones from which sera were _ coniected
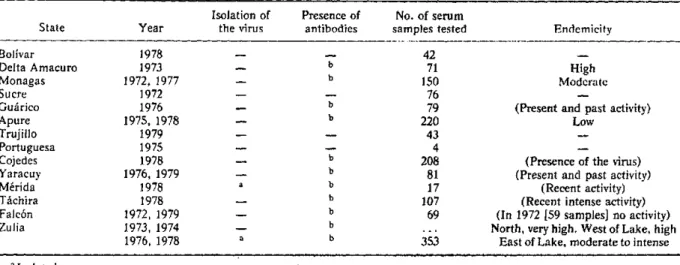
Table 1. Findings of the serologlc survey in states of Venezuela, 1972-1979.
Isolation of Presence of No. of serum
the virus antibodies samples tested Endemicity
b b
b b
b b b b b b b
42 71 150 76 79 220 43 4 208 81 17 107 69
353
High Moderate
(Present and past activity) Low
(Presence of the virus) (Present and past activity)
(Recent activity) (Recent intense activity) (In 1972 [59 samples] no activity) North, very high. West of Lake, high
East of Lake, moderate to intense
a
a
a Isolated.
.
bAntibodies present. StateBolívar Delta Amacuro Monagas Sucre Guárico Apure Trujillo Portuguesa Cojedes Yaracuy Mérida Táchira Falcón Zulia
Year
1978 1973 1972, 1977
1972 1976 1975, 1978
1979 1975 1978 1976, 1979
from Zulia, Yaracuy, Apure, and Guárico were tested also with western equine encephalitis (WEE) antigen, but no antibodies against this virus were found.
Table 1 describes the EEE situation in the states that were visited for the purpose of conducting the serologic survey or establishing the etiology of cases of encephalitis in equines.
Predictably, the above information indicates that EEE activity is related to the presence of surface waters such as swamps, marshes, and ponds, and possibly to water-fowl and mosquito populations; this situation is observed in Delta Amacuro and in the southwestern part of Lake Maracaibo. The opposite occurs in semidesert areas, where stagnant surface waters, if they exist at all, are found only during brief periods in the short rainy season;
the same is true along the Caribbean coastal area of Zulia and Falcón, where EEE does not exist.
Epidemiological differences between EEE and VEE are marked in these arid zones where recurrent and ex-plosive VEE epidemics are observed. Between the two above-described extremes, a range of ecological combi-nations prevails with varying grades of EEE activity, which includes small local outbreaks, To date there is no evidence of EEE infection in man.
(Source: Boletín Epidemiológico Semanal 7. 1980.
Ministry of Health and Social Welfare of Venezuela)
Human
Salmonella
Isolates-United States, 1979
In 1979, 31,123 isolations of salmonellae (including
Salmonella typhi) from humans were reported to
CDC-an increase of 8.3 per cent over 1978.
The increase in isolates was not confined to one state or region. However, five states-Connecticut, Massa-chusetts, Maryland, Washington, and Illinois-ac-counted for two-thirds of the 8.3 per cent increase. S.
enteritidis alone accounted for over one-fourth of the
increase; most of this occurred in Connecticut and Massa-chusetts. S. enteritidis. S. heidelberg, S. saint-paul. and
S. infantis accounted for almost two-thirds of the
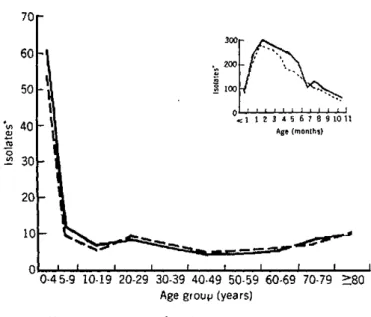
in-crease. These additional isolates were not concentrated in any single age group. The 10-19 year age group sus-tained the largest percentage increase, but increases were also seen for the age groups 30-39 years and 50-79 years.
The age distribution of persons from whom isolates were obtained (Figure 1) followed a well-established pat-tern: the rate was highest for infants approximately 2-3 months of age, decreased rapidly through early child-hood, and then held fairly constant from approximately age 7 through the adult years. Isolation rates for those
under 20 were higher for males than for females, but for
Figure 1. Rate of reported isolates qf Salmonella, by age, United States, 1979.
70
300
~~~~~~~~60
_320050n o0
'vt 40 ll 1 I 1 2 3 4 5 6 7 8 9 10 11
0 _1> ^Age (months
01- 30
Age grouv (years)
- Male --- Female
'Per 100,000 population
9