Measurement of a Country Brand
The country brand strength index
Master Thesis submitted to the Universidade Católica Portuguesa to obtain a Master's degree in Management with a specialization in Business Analytics
by
Bárbara Schoeppen de Magalhães Álvares Ribeiro
Supervised byDr. Maria Conceição Andrade e Silva
Universidade Católica Porto Business School Março 2017
iii
Acknowledgement
I would like to thank all who helped me direct or indirectly with the construction of this thesis.
First, I would like to thank my supervisor, Professor Maria Conceição Andrade e Silva, for the opportunity given to me of pursuing a Master thesis in one of my favourite areas: Country Branding. I would also like to thank for her continuous dedication and interest on my research work and above all, for her endless patience and orientation.
To my dear family, who have always supported me, encouraged me and participated actively in all my life projects.
To my closest friends, to their continuous support.
“A nation´s culture resides in the hearts and in the soul of its people.”
Abstract
This thesis applies the Country Brand Strength Index (CBSI) developed by Marc Fetscherin in 2010, in a 5-year period analysis to conduct a longitudinal study applying it to 31 countries.
The CBSI proposed is an alternative measurement to existing subjective survey-based measurement indexes.
We want to raise the awareness of everyone of how important a country brand is in todays´ world. A strong country brand can stimulate exports, attract tourism, investments, and immigration. Countries need to understand that to stay competitive in the global economy they need to know how to assess their country brand to manage it in the most effective way. With the proposed CBSI, a country can identify its position, monitor its evolution over the years, and evaluate its competitive position relative to others.
“A nation’s ‘brand’ exists, with or without any conscious efforts in nation branding, as each country has a current image to its international audience, be it strong or weak, clear or vague” (Fan, 2006).
This thesis is divided into 4 main chapters, the first one outlines the goals and the methodology used, the second chapter provides an overall view of the concept of Country Branding and other related aspects, the third chapter covers all the details about the CBSI presented by Marc Fetscherin and the last chapter presents the empirical analysis where the CBSI was applied to new data with Portugal included. Finally, we outline the major conclusions and key areas to be considered in order for countries to leverage on this strategic dimension.
Keywords: Country Branding, Country of origin effect, Country Image, Destination Branding
Acronyms
BC: Bloom Consulting
CBSI: Country Brand Strength Index CB: Country Branding
CI: Country Image COO: Country-of-origin COE: Country-of-origin effect DEA: Data Envelopment Analysis E: Exports
FDI: Foreign direct Investment G: Governance
GEI: Government Environment Index M: Immigration
NB: Nation Branding T: Tourism
UNCTAD: United Nations conference on Trade and Development UNWTO: United Nations World Tourism Organization
Index
Acknowledgement ... iii Abstract ... v Acronyms ... vii Index ... ix Index of figures ... xiIndex of tables ... xiii
Chapter 1 ... 15
1.Introduction ... 15
1.1 The Setting ... 15
1.2 Idea and Goals ... 18
1.3 Methodology ... 19
1.4 Structure ... 19
Chapter 2 ... 21
2.Country Branding and related concepts ... 21
2.1 Country Branding ... 21
2.1.1 Country-of-origin effect ... 23
2.1.2 Country Image ... 25
2.1.3 Destination Brand ... 27
2.2 Measuring a Country Brand ... 28
Chapter 3 ... 29
3. Country Brand Strength Index by Marc Fetscherin... 29
3.1 Introduction ... 29
3.2 Construction of the country brand strength index ... 29
Chapter 4 ... 33
4. Applying the Country Brand Strength Index ... 33
4.1 Introduction ... 33
4.2 Application of the CBSI ... 33
4.3 Analysis and Results ... 35
4.3.1 Data and Descriptive statistics ... 35
4.3.2 CBSI results ... 36
4.3.3 Exports (E) ... 41
4.3.4 Tourism (T) ... 44
4.3.5 Foreign Direct Investment (FDI) ... 48
4.3.6 Immigration (M) ... 51
4.5. Discussion and future developments ... 57
4.6 Conclusions ... 58
Bibliography ... 60
Attachments ... 65
Index of figures
Figure 1: Absolute growth trend of the 4 countries and 4 last ones ... 39
Figure 2: Comparison: Portugal and the top 4 countries in our CBSI ... 40
Figure 3: Comparison: Portugal and the 4 worst countries in our CBSI... 41
Figure 4: Top 10 absolute growth from 2010 to 2015 for Tourism ... 47
Figure 5: Decreased absolute growth from 2010 to 2015 for Tourism ... 48
Figure 6: Top 10 Growth for Foreign Direct Investment from 2010 to 2015 .. 51
Figure 7: Relationship between GEI and CBSI for all countries... 56
Index of tables
Table 1: Comparison of a classical brand and a country brand ... 17
Table 2: Description of components, sources and measures ... 30
Table 3: 31 countries computed in this CBSI ... 35
Table 4: Mean of variables per year of the 31 countries ... 36
Table 5: Top 5 final ranking for 2010 to 2015 ... 37
Table 6: Portugal: final ranking for 2010 to 2015 ... 37
Table 7: Final average ranking for all the countries from 2010 to 2015 ... 37
Table 8: CBSI: 31 countries from 2010 to 2015 and their absolute growth ... 38
Table 9: Values for the variable Exports from 2010 to 2015(per capita) ... 41
Table 10: Exports average ranking for the 31 countries from 2010 to 2015 .... 42
Table 11: Top 10 absolute growths from 2010 to 2015 for Exports ... 43
Table 12: Values for the variable Tourism from 2010 to 2015(per capita) ... 44
Table 13: Tourism average ranking for the 31 countries from 2010 to 2015 ... 45
Table 14: Top 10 absolute growths from 2010 to 2015 for Tourism ... 46
Table 15: Values for the variable FD from 2010 to 2015(per capita) ... 48
Table 16: FDI average ranking for the 31 countries from 2010 to 2015 ... 49
Table 17: Top 10 absolute growths from 2010 to 2015 for FDI ... 50
Table 18: Values for the variable Exports from 2010 to 2015(per capita) ... 51
Table 19: Immigration avg ranking for the 31 countries from 2010 to 2015 ... 52
Table 20: Top 10 absolute growths from 2010 to 2015 for Immigration ... 53
Table 21: Average CBSI values and GEI (2007) normalized values ... 54
Chapter 1
1.Introduction
1.1 The Setting
In a context of aggressive and exponential competitiveness, all resources are mobilized for the global war of innovation and the incorporation of value into products (Ribeiro, 2012).
A brand is a “name, term, sign, symbol, or design, or a combination of them, intended to identify the goods and services of one seller or group of sellers and to differentiate them from those of competition”(Keller, 2008).To build a strong brand, it is necessary to figure how customers think and feel about the product. It is important to build the right type of experiences around your brand so that customers have precise and positive thoughts, feelings, beliefs, opinions, and perceptions about it. When a strong brand is made, your customers will buy more from you, they will recommend you to other people through word of mouth, they will be more loyal to your brand and there is a less change of losing them to your competitors (Keller, 2003).
Countries, like companies, need to build, manage and protect their brand (Fetscherin, 2010). The concept of country brand (CB) refers to the perceptions of the symbolic value of a country that is operated by some of its most visible characteristics in the eyes of foreign public opinion and which help to place the country on a reputation scale (Anholt, 2007). In addition to this being a non-consensual and complex concept, there are still complications of operationalization, as Fan (2006) states:
"Products can be discontinued, modified, withdrawn from the market, relaunched and repositioned or Replaced by improved products. Nations do not have most of these choices. As there is no tangible offer in a nation, its attributes are difficult to define or describe. The only benefits a nation could create for its audience are emotional rather than functional. " (Ribeiro, 2012)
Contrary to the original concept of branding, and despite its potential for practical intervention, the concept of nation branding is not just a marketing tool (Ribeiro, 2012).
The importance of a new approach to the way in which countries, cities, places need to be managed in the age of globalisation is undeniable. Places must engage with the outside world in a clear, coordinated and communicative way if they are to effect public opinion. An alliance between government, business and society, as well as the creation of new institutions and structures to achieve this behaviour is necessary for achieving this goal in a long term (Anholt, 2008).
If this concept is understood and responsibly applied by policy makers, they can bring a powerful new dimension to a country: attract the consumers, talent, media attention, tourists and investors they need in order to build their economies, expand their influence and achieve their aims (Anholt, 2008).
Whether countries and cities and regions like it or not, in the age of global competition all need to promote themselves: the most effective methods for doing this may owe little to the art of selling consumer goods but with what a country, city or region has to offer. The challenge is precisely the same (Anholt, 2008).
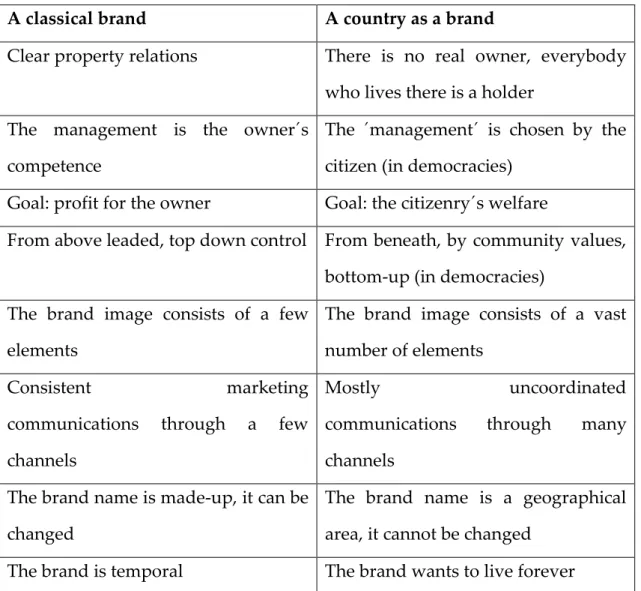
In Table 1 we verify the comparison of a classical brand and a country brand. We can observe that there are several differences such as their properties, goals, their ways of communication, brand name and lifetime.
Table 1: Comparison of a classical brand and a country brand
A classical brand A country as a brand
Clear property relations There is no real owner, everybody
who lives there is a holder The management is the owner´s
competence
The ´management´ is chosen by the citizen (in democracies)
Goal: profit for the owner Goal: the citizenry´s welfare
From above leaded, top down control From beneath, by community values, bottom-up (in democracies)
The brand image consists of a few elements
The brand image consists of a vast number of elements
Consistent marketing
communications through a few channels
Mostly uncoordinated
communications through many
channels The brand name is made-up, it can be
changed
The brand name is a geographical area, it cannot be changed
The brand is temporal The brand wants to live forever
Products and countries are not equitably evaluated and the assessment of nations and people is based on multiple factors, almost all of an intangible nature (Ribeiro, 2012): so how is it done? How is the country brand measured?
The main goal of this thesis is to raise awareness to all the readers about the increasingly importance of country branding now-a-days, to introduce a more developed CBSI of a group of countries with an evolution over the past years and to present some critics that could help developing an even better and improved CBSI.
“If you’re not making a concerted effort to brand your nation, other people might do it for you — and for their own purposes.”
1.2 Idea and Goals
The idea of writing a thesis about Country Branding (CB) emerged after an internship at Bloom Consulting (BC) strategy consulting firm specialized in CB company in Madrid. BC has developed branding strategies for several places and national governments around the world, cooperating with prime ministers, presidents, mayors, heads of tourism boards and directors of investment agencies. The organisation´s work focuses mainly on region, city and country branding projects, the development of research tools for tourism and investment destinations and it organizes workshops and conferences around the world.
Starting in September of 2016, the 4-month experience brought the opportunity to participate in the Country Branding project for Paraguay, in the Digital Country Index as well as in the Touristic demand research report for Finland. These projects required intensive research, analysing and interpreting big data, restructuring, redesigning and adapting complex Excel files, and preparing reports and presentations. Not only because of working in this subject has arouse a big interest, but also because it´s a concept that is not fully developed yet.
The most recent City Brand Ranking made by Bloom was published in April of 2017 and evaluates the performance and attractiveness of the 308 Portuguese municipalities in three categories, namely tourism, business and talent. The cities of Lisbon, Oporto and Funchal occupy the first places of the Portugal City Brand Ranking, in the category of tourism (Publituris, 2017)1.
"The publication of Bloom Consulting Portugal City Brand Ranking 2017 represents the importance of continuing to measure the impact of the brand of each municipality with indicators that represent the truth of this impact through concrete and updated statistical data considering both traditional and innovative
variables," says Filipe Roquette, Managing Director of Bloom Consulting in Portugal (Publituris, 2017)2.
1.3 Methodology
To answer the research questions “How has the Country Branding developed in a group of countries in the past years?” and “How does Portugal stand and how has it developed”, the methodology used is a quantitative method that emphasizes objective measurements and statistical analysis of secondary data. These data were not developed for the sole purpose of this project but help to better define the problem at hand. The sources used were primarily World Bank and United Nations conference on Trade and Development. The goal in conducting a quantitative research study is to determine the relationship between Country Branding and several variables such as exports, tourism, foreign direct investment, immigration and governance within a country.
1.4 Structure
This thesis is divided in 4 chapters. The first one includes the setting, the idea and some goals for this thesis and the methodology used. Inserted in chapter 2 is the concept of Country Branding and some related concepts such as Country-of-origin effect, Country Image and Destination Branding, that are important for and easier understand of this thesis. Measuring a Country Brand is also inserted in this chapter. In chapter 3 is described Marc Fetscherins Country Brand Strength Index, where the explanation of its construction is made. In the 4th and last chapter is inserted the applying of the CBSI, where an analysis of the data is
2 http://www.publituris.pt/
putted forward and a discussion about the limitations and improvements is presented. At the end is accessible all the bibliography used and the attachments.
Chapter 2
2.Country Branding and related concepts
This chapter provides the theoretical background and a literature review of the concept Country Branding and the related concepts studied necessary to fulfil the understanding of this report.
2.1 Country Branding
Anholt (2006) defines the process of branding as being “(…) the process of designing, planning and communicating the name and identity, in order to manage the reputation” (Cotîrlea, 2015). This process of branding helps a country to define its own identity, to promote itself, to draw attention and to differentiate itself from others. A country can promote itself in several ways: as a touristic destination, as a trade or business centre, as a quiet and safe place, etc. (Cotîrlea, 2015).
Country Branding (CB) is a very important concept in today´s world. Because of globalisation, the whole world must compete for the attention and preferences, respect and trust of investors, tourist and even consumers and immigrants. A positive and powerful CB provides competitive advantage against other countries. It is very significant for countries to know and understand how they are seen by others around the world, how their achievements and failures, their assets and their liabilities. The society and products of a country are reflected in their brand image. If the CB is not so positive, the reputation can be managed and changed to better represent the current reality and future image of a specific place, as long as there is a strategy, a leadership, and proper coordination
between the government, the private sector and the society (Renan & Thom, 1990).
One of most significant definition of CB was proposed by Simon Anholt (2007,2009). This concept differs from notions like “place branding”, “destination branding”, “country image”, “country identity” or “country of origin effect” (Dinnie, 2008; Fan, 2006; Hanna & Rowley, 2007). Unlike these terms, CB has a focus which goes beyond the idea of promoting a specific country through marketing and communication techniques, since countries are essentially different from commercial brands. The concept of CB accounts for foreign public perception of the symbolic capital of a nation-state and its positioning in an implicit scale of reputation (Ribeiro, 2012). Being a complex and arguable concept, it implies some challenges regarding its operationalization (Fan, 2006). The concept of CB emerged from the marketing literature but is not just a marketing tool (Anholt, 2008).
“Countries are judged by what they do, not by what they say, as they have always been; yet the notion that a country can simply advertise its way into a better reputation has proved to be a pernicious and surprisingly resilient one” (Anholt, 2013).
CB research is still in its infancy and only in the last decade has an increasing number of academics and practitioners focused on this field. Kotler et al. (1993; 1997) were among the first to discuss country branding. Despite an increasing number of articles dedicated to the topic, there is still no common definition of CB (Kotler, Haider, & Rein, 1993). Fan (2006) makes an early attempt at defining it as “a country’s whole image, covering political, economic, historical and cultural dimensions. The concept is at the national level, multidimensional and context dependent” (Fan, 2006). Another early definition was made by Keith Dinnie (2008) that defines CB as “the unique, multi-dimensional blend of elements that provide the nation with culturally grounded differentiation and relevance for all of its target audiences” (Dinnie, 2008) . Aronczyk (2008), in turn,
states that a country brand should “attract the ´right´ kinds of investment, tourism, trade, and talent” (Aronczyk, 2008), and Kotler et al. (1993) argue that governments should create, promote, protect, and supervise a CB (Kotler et al., 1993).
As already mentioned, countries, like companies, need to build, manage and protect their brand (Fetscherin, 2010).
As stated above, there is a relation between CB and these fields, so let´s understand some of these concepts deeper: Country-of-origin (Balabanis, Mueller, & Melewar, 2002; Dinnie, 2003; Laroche, Papadopoulos, Heslop, & Mourali, 2005; Quelch, 2003; Roth & Romeo, 1992); country image (Roth and Romeo, 1992; Martin-Eroglu, 1993; Kotler et al. 1993); destination branding (Cai, 2002; Konecnik & Gartner, 2007; Prebensen, 2007).
2.1.1 Country-of-origin effect
An important factor in influencing consumers brand evaluation, perceptions and purchasing behaviours is the Country-of-origin (COO). Balabanis (2002) defines COO as a “marketing concept that captures consumer´s differentiated attitudes towards different nations”(Balabanis et al., 2002).
Roth and Romeo (1992) and Laroche et al. (2005), presented the Country-of-origin effect (COE) as a multidimensional notion. It is a concept that refers to quality, reliability, price, safety, aesthetics, and technology, among other factors that are associated with the COO of a specific product. It was discovered decades ago and it relates to the influence and perception of a country´s image in the differentiation and value a product has on the market. This concept helps to understand that the image of an object is not only limited to its materiality. (Laroche et al., 2005)
There is a high level of interest in researching the effects and impacts of the COO as an extrinsic product or service sign. This level of interest may be qualified, at least in part, to increase economic globalization which was a result
of the lowering of trade barriers between countries and the consequent availability of more foreign products and services crossing borders than ever before. In such circumstances, many products and services highlight their COO as a potential competitive differentiator in their respective markets (Dinnie, 2003).
There are numerous studies that emphasized the evolution and development of the COE. A country with a positive image is an enhancer for product positioning, however, COE have led to negative associations of product and country images (Adina, Gabriela, & Roxana-Denisa, 2015).
The first study was created by Schooler (1965), who concluded that the COO of a product influences a consumer´s opinion of it. This conclusion was based on research which presented four groups of students from Guatemala with products bearing fictitious labels denoting the product´s supposed COO. Four Central American countries featured on the labels: Mexico, Costa Rica, El Salvador, and home country Guatemala. The results of this research showed that the respondents evaluated products from Costa Rica and El Salvador more negatively than products from Mexico or Guatemala. The conclusion that a COE does indeed exist was established but the strength, direction and processes by which consumers assimilate COO into their decision making would only be developed in later studies (Dinnie, 2003).
Another interesting and important development in the conceptualization of the COO concept was when Quelch (2003) took an extensive look at COO and observed that growing anti-American sentiment throughout the world, coupled to the emergence of China as a player on the world economic stage, represent two factors that will affect the degree to which global marketing will make explicit use of the COO cue. John Quelch predicts that the resentment that is driving global consumers away from American brands like Coca-cola may never fully dissipate, and therefore national American brands like Coca-cola can be expected to put increasing distance between themselves and the flag. Such
brands will, according to Quelch, reposition themselves as supranational brands in order to avoid the negative consequences of associating themselves too closely with a disliked COO. By placing COO in the context of international relations between nation states, Quelch makes a significant contribution to the COO field and one may expect further studies in the future to investigate in more detail the extent to which geopolitical events and circumstances play a role in consumers´ and citizens´ evaluation of COO. This may also be regarded as an indicator of the importance of individual nations to take a proactive attitude in managing perceptions of their Country Image, rather than leaving themselves at the mercy of geopolitical events beyond their control (Dinnie, 2003).
2.1.2 Country Image
The concept of country image (CI) has two common interpretations, leading to heavy debates amongst professionals (Jenes, 2005). The first approach of country image is called “umbrella function”, as its elements are made up of the totality of the country´s specific products, brands and organizations. According to the second approach, the country image is a complex product, made up of many elements. This country image is considered a normal product image, yet with more diverse, complex and complicated characteristics.
This concept has been under constant attention of academic research in marketing, however the focus has been aimed much more at investigating country of origin image than country image. Researchers agree that a strong theoretical background to CI would be necessary and proper measurement instruments should be developed, as this field of study is not as well developed as the country of origin image studies. Recent publications look to a new approach and consider CI related to country branding and use the concept of “country value” in a similar way to “brand value”. In this view, globalisation means that countries are competing against each other in the same way as brands
do. Therefore, powerful “country brands” have a huge competitive advantage (Anholt & Anholt, 2005).
Roth and Romeo (1992) define CI as “the overall perception consumers form of products from a particular country based on their prior perceptions of the country´s production and marketing strengths and weaknesses” (Roth & Romeo, 1992). Another definition of CI is the complete set of descriptive, inferential and informational beliefs about that given country (Martin & Eroglu, 1993), the set of people’s beliefs, ideas and impressions about a certain country (Kotler et al. 1993). On the other hand, Keillor and Hult (1999) have defined country identity as “the extent to which a given culture recognises and identifies with its unique characteristics” (Keillor & Tomas M. Hult, 1999).
One of the most widely mentioned studies was Han’s (1989) examination of the role of CI in a consumer evaluation of TV sets and cars. 116 respondents were interviewed and asked for their opinion about images of products from the United States of America, Japan and South Korea. The respondents´ opinion was measured on a 7-point scale (“good” and “bad”). The results showed that CI can be used by consumers in products evaluation either as a halo or as a summary construct. A halo construct describes situations in which CI is used to consider products that consumers have little knowledge about, while a summary construct operates when consumers become familiar with a country´s products and CI may become a construct that summarises consumers´ beliefs about product attributes (Dinnie, 2003).
Han (1990) developed his 1989 study with an investigation in which the role of a CI in consumers´ choice behaviour was tested. Arguing that CI may be conceptualised as a consumer halo, Han (1990) assessed the effect of CI on consumers´ attitudes towards brands “made in” different countries; the effect of CI on consumers´ intentions to purchase brands from various countries; the effect of CI on consumers´ perceptions of specific product attributes and the effect of CI for a product category on different categories from the same countries. As in
Han’s previous 1989 study, the products selected were TV sets and cars. Given the nature of these two products, the five items used to measure CI were: technical advancement, prestige value, workmanship, price, and serviceability. The results of the study indicated that consumers´ willingness to purchase a product was related to the economic, political and cultural characteristics of the product´s COO and that COO images were affected by consumers´ perceptions of similarity between their own country´s political and cultural climate and beliefs systems and those of the origin country (Dinnie, 2003). Country image is not related directly to the product but only provides the basis for some indirect conclusions about the product (Jenes, 2005).
2.1.3 Destination Brand
The concept of destination brand could be defined as the “perceptions about the place as reflected by the associations held in tourist memory” (Cai, 2002). Many of the previous studies on destination branding rank the dimension of brand image of highest importance in a tourism brand’s evaluation. Prebensen (2007) alleged that a destination’s image can be influenced by two sources of information, organic image and induced image (Prebensen, 2007). The first, organic image, is what you learn about a place in school, in books, hear about on the news, through word of mouth etc. Places are much more than just tourism products, so people generally have knowledge and perceptions of a destination independent of exposure to its marketing. This information is not necessarily taken with the intent of persuading anyone to a certain image, but these organic sources could still influence whether a person views a place as a suitable travel destination or not (Konecnik & Gartner, 2007). The source of induced image is when the image is formed by the promotions and communications of the tourism organizations involved in a region (Dominique & Lopes, 2011). It is related to the information that derive from a conscious effort from and by the travel or businesses agents to provide tourists´ with images of places, such as advertising
literature, magazine articles, guidebooks, television promotion, travel tour packages, etc (Matos, Mendes, & Valle, 2012).
2.2 Measuring a Country Brand
Country Branding is an exciting and complex but controversial phenomenon (Dinnie, 2008). It is exciting because there is currently little theory but a significant amount of real world activity; complex because it encompasses multiple levels, dimensions and disciplines beyond conventional branding; and it can be controversial as a highly-politicized activity that generates conflicting viewpoints and opinions. The literature review done reveals that, to the best of our knowledge, there is no objective measure that assesses the strengths of a country brand. Such a measure would greatly help countries to assess their competitive position (Fetscherin, 2010). The only existing index measures which assess a country brand come from private sources: Bloom Consulting annual Country Brand Ranking, the Country Brand Index from FutureBrand consultancy and Anholt GfK Roper Nation Brand Index (NBI). Bloom Consulting´s Country Brand Ranking focuses on tangible data, analysed with its Digital Demand - D2 © tool3 and relevant, proprietary statistical models and the other two indexes are based on subjective perception survey data, useful and widely used for many country branding projects worldwide, but they are limited by their use of proprietary methodologies in terms of specific questions asked as well as aggregation and statistical method used.
The applying and developing of the index presented in chapter 4 is inspired by the CBSI constructed by Marc Fetscherin (2010) that proposes an alternative measurement based on objective secondary data to assess the strengths of a country brand.
3 Attachment 1. (Consulting, 2015)
Chapter 3
3. Country Brand Strength Index by Marc
Fetscherin
3.1
Introduction
There are two ways to measure a country brand: the consumer-based brand equity approach, which is used by Anholt´s and Futurebrand country brand indexes mentioned above, and the company-based brand equity approach (Fetscherin, 2010). The first one emphasizes the meaning of the brand and the value the consumers place on it. A brand´s value is determined by consumers. The second one, the company-based brand equity approach, often referred to in the literature as the financial approach, is a top-down approach of measurement using information on the total performance of a company. This second approach is the same one that can be applied to a country´s brand by estimating how well the country performs in terms of exports (Gertner, Gertner, & Kotler, 2002), attracting tourism (Campelo, Aitken, & Gnoth, 2009), and attracting foreign direct investment (Papadopoulos & Heslop, 2002; Szondi, 2008) as well as immigration. Considering its objective dimensions , the approach used is the company-based brand equity approach using secondary data. (Fetscherin, 2010)
3.2 Construction of the country brand strength index
The index of (Fetscherin, 2010) will be described in this section, since it is central to the thesis. The authors argue that a high level of exports, a high level of tourism, a high level of foreign direct investments and a high level of
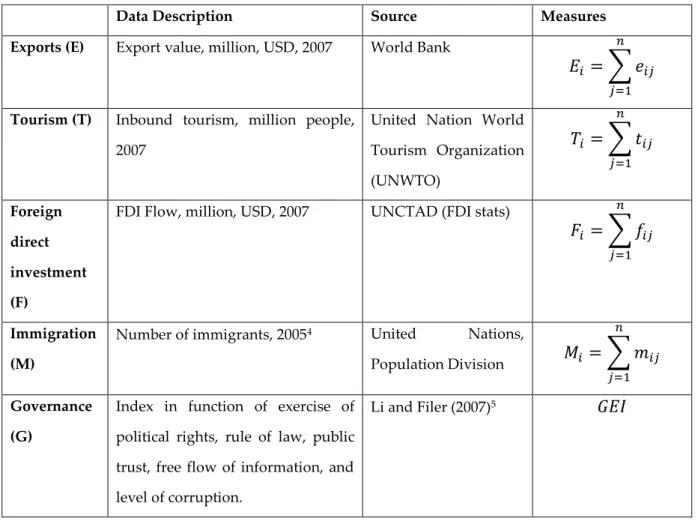
immigration are indicators of a strong country brand. Anholt (2007) emphasizes that governments are at the centre of country branding and that changes in a country´s political leadership can affect the country just as a new CEO can affect a corporate brand (Fetscherin, 2010). There are 4 flow variables (flow of people, materials and money) used for this index, Exports (E), Tourism (T), Foreign direct Investment (F) and Immigrants (M). The 5th variable is a non-flow one and it is called: Government Environment (G). In Table 2 we can observe in detail the data description, the sources where the data was collected and their measures created by Fetscherin (2010). These variables are used as proxies for assessing the strengths of a country brand. Note that the flow measures in Table 2 assume that there are n countries, and the flow of country i is measured as the sum of all ‘transactions’ from a country i to all other countries j where j=1,2,…n.
Table 2: Description of components, sources and measures
Data Description Source Measures
Exports (E) Export value, million, USD, 2007 World Bank
𝐸𝑖 = ∑ 𝑒𝑖𝑗 𝑛 𝑗=1
Tourism (T) Inbound tourism, million people, 2007
United Nation World Tourism Organization (UNWTO) 𝑇𝑖 = ∑ 𝑡𝑖𝑗 𝑛 𝑗=1 Foreign direct investment (F)
FDI Flow, million, USD, 2007 UNCTAD (FDI stats)
𝐹𝑖 = ∑ 𝑓𝑖𝑗
𝑛 𝑗=1
Immigration (M)
Number of immigrants, 20054 United Nations,
Population Division 𝑀𝑖 = ∑ 𝑚𝑖𝑗
𝑛 𝑗=1
Governance (G)
Index in function of exercise of political rights, rule of law, public trust, free flow of information, and level of corruption.
Li and Filer (2007)5 𝐺𝐸𝐼
4 More recent available data for all countries available 5 They calculate the GEI for 44 countries
The Government Environment Index (GEI) provided by Li and Filer (2007) is a multi-dimensional construct that includes exercise of political rights, rule of law, public trust, free flow of information, and level of corruption. A positive government environment supports not only exports and attracts tourism, investments and immigration but also enables the development of an overall positive and strong country brand (Li & Filer, 2007). It is assumed in this model that the government is inherent to the country and not a function of bilateral relations, it can be expressed with the parameter Gi.
Using these components, Fetscherin developed an index which is shown in the formulated simplified equation (1) (for country i):
CBSIi= 𝑓(𝐸𝑖 + 𝑇𝑖+ 𝐹𝑖 + 𝑀𝑖 + 𝐺𝑖) (1)
The Governance (G) values don´t need any modification as it is an index already, but for exports (E), tourism (T), foreign direct investment (F) and immigration (M) there is a need of a modification. The values of exports (E), tourism (T), foreign direct investment (F) and immigration (M) are requested to be divided by the number of Population (x) to get a relative value per capita.
We get the equation (2):
CBSIi = 𝐸𝑖𝑥𝑖+𝑇𝑖𝑥𝑖+𝐹𝑖𝑥𝑖+𝑀𝑖𝑥𝑖 + 𝐺𝑖 = 𝐸𝑥𝑖 + 𝑇𝑥𝑖 + 𝐹𝑥𝑖 + 𝑀𝑥𝑖 + 𝐺𝑖 (2)
Afterwards, since the values are still in different formats, Fetscherin used normalized variables, that were standardized with a mean of zero and a standard deviation of one.
CBSIi = 𝐸𝑥𝑖−𝐸𝑥𝑖̅̅̅̅̅ √∑𝑛𝑖=1(𝐸𝑥𝑖−𝐸𝑥𝑖)²̅̅̅̅̅̅̅̅ (𝑛−1) + 𝑇𝑥𝑖−𝑇𝑥𝑖̅̅̅̅̅ √∑𝑛𝑖=1(𝑇𝑥𝑖−𝑇𝑥𝑖)²̅̅̅̅̅̅̅̅ (𝑛−1) + 𝐹𝑥𝑖−𝐹𝑥𝑖̅̅̅̅̅ √∑𝑛𝑖=1(𝐹𝑥𝑖−𝐹𝑥𝑖)²̅̅̅̅̅̅̅̅ (𝑛−1) + 𝑀𝑥𝑖−𝑀𝑥𝑖̅̅̅̅̅̅ √∑𝑛𝑖=1(𝑀𝑥𝑖−𝑀𝑥𝑖)²̅̅̅̅̅̅̅̅̅ (𝑛−1) + 𝐺𝑖−𝐺𝑖̅̅̅ √∑𝑛𝑖=1𝐺𝑖−𝐺𝑖)²̅̅̅̅̅̅ (𝑛−1)
(3)
To compute the CBSI for a country, all five variables must have non-missing values. For each component, it was given the same weight in the index since there is no developed index to measure the strength of a country brand.
Chapter 4
4. Applying the Country Brand Strength Index
4.1 Introduction
This chapter shows the results of applying the Country Brand Strength Index of Fetscherin (2010), where the purpose is to construct and present an index that assesses the strength of a country brand based on objective secondary data. This application implied some developments and improvements to the original index that present a standardized instrument for measuring the strength of a country brand and it should be considered a starting point for more complete and complex measurements. Countries can use this CBSI as a performance reference point to see where they stand and understand that changes are required to improve their current position. Countries need to realize that analysing and studying ways to enhance their country brand is no longer a matter of choice, either a country is proactive and controls its country brand or it risks allowing the brand to be influenced and controlled by public opinion and lack of information. A strong country brand can stimulate exports, attract tourism, investments, and immigration (Fetscherin, 2010).
4.2 Application of the CBSI
This analysis includes 31 countries, adding Portugal to Marc Fetscherins (2010) model and deleting Taiwan due to lack of data. It is a longitudinal study that includes a 5-year period analysis of the years of 2010 to 2015. Regarding data sources, as seen in Table 2 we used the same ones as Fetscherin (2010), except for
tourism where we used World Bank instead of United Nation World Tourism Organization (UNWTO).
Regarding the changes that we introduced we decided to use the same components and aggregate them using the same weight, but decided to normalize the values differently. The normalization of this CBSI will be calculated so that the final values are located between 0 and 1 and easier to understand (equation 4). 𝐶𝐵𝑆𝐼𝑖 = 𝑀𝐴𝑋(𝐸𝑝𝑜𝐸𝑝𝑜𝑖−𝑀𝐼𝑁(𝐸𝑝𝑜𝑖) 𝑖)− 𝑀𝐼𝑁(𝐸𝑝𝑜𝑖) + 𝑇𝑝𝑜𝑖−𝑀𝐼𝑁(𝑇𝑝𝑜𝑖) 𝑀𝐴𝑋(𝑇𝑝𝑜𝑖)− 𝑀𝐼𝑁(𝑇𝑝𝑜𝑖)+ 𝐹𝐷𝐼𝑝𝑜𝑖−𝑀𝐼𝑁(𝐹𝐷𝐼𝑝𝑜𝑖) 𝑀𝐴𝑋(𝐹𝐷𝐼𝑝𝑜𝑖)− 𝑀𝐼𝑁(𝐹𝐷𝐼𝑝𝑜𝑖)+ 𝑀𝑝𝑜𝑖−𝑀𝐼𝑁(𝑀𝑝𝑜𝑖) 𝑀𝐴𝑋(𝑀𝑝𝑜𝑖)− 𝑀𝐼𝑁(𝑀𝑝𝑜𝑖)6 (4)
We decided to compute this index without the last component of Governance (G). The reasons to do so is the fact that we don´t have values for all the 5-year period that we are evaluating and the fact that the variable Governance (G) is not a flow variable. There is a flow of people, raw material or money in each of the other variables, so the component Governance (G) is more likely the variable that can explain the other components rather than a component as itself. We do believe that if Governance (G) is a component, that we should also consider other factors into the index such as: safety, health, education, quality of life, pollution, etc. For our final values of our CBSI we sum the 4 variables and divided this sum by the number of components.
In short, this is how our CBSI will be computed:
𝐶𝐵𝑆𝐼𝑖 = 𝐸𝑝𝑜𝑖−𝑀𝐼𝑁(𝐸𝑝𝑜𝑖) 𝑀𝐴𝑋(𝐸𝑝𝑜𝑖)− 𝑀𝐼𝑁(𝐸𝑝𝑜𝑖)+ 𝑇𝑝𝑜𝑖−𝑀𝐼𝑁(𝑇𝑝𝑜𝑖) 𝑀𝐴𝑋(𝑇𝑝𝑜𝑖)− 𝑀𝐼𝑁(𝑇𝑝𝑜𝑖)+ 𝐹𝐷𝐼𝑝𝑜𝑖−𝑀𝐼𝑁(𝐹𝐷𝐼𝑝𝑜𝑖) 𝑀𝐴𝑋(𝐹𝐷𝐼𝑝𝑜𝑖)− 𝑀𝐼𝑁(𝐹𝐷𝐼𝑝𝑜𝑖)+ 𝑀𝑝𝑜𝑖−𝑀𝐼𝑁(𝑀𝑝𝑜𝑖) 𝑀𝐴𝑋(𝑀𝑝𝑜𝑖)− 𝑀𝐼𝑁(𝑀𝑝𝑜𝑖) 4 (5)
4.3 Analysis and Results
4.3.1 Data and Descriptive statistics
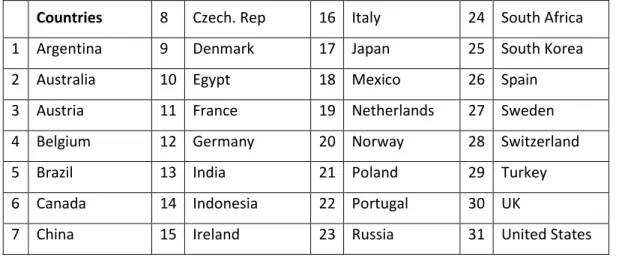
For all 31 countries, the period in analysis are the years from 2010 to 2015. In Table 3 we can find the 31 countries used to calculate this CBSI.
Table 3: 31 countries computed in this CBSI
Countries 8 Czech. Rep 16 Italy 24 South Africa
1 Argentina 9 Denmark 17 Japan 25 South Korea
2 Australia 10 Egypt 18 Mexico 26 Spain
3 Austria 11 France 19 Netherlands 27 Sweden
4 Belgium 12 Germany 20 Norway 28 Switzerland
5 Brazil 13 India 21 Poland 29 Turkey
6 Canada 14 Indonesia 22 Portugal 30 UK
7 China 15 Ireland 23 Russia 31 United States
The data for the variable Immigration, as shown in Table 2 was collected from the United Nations where the data is presented for the years of 1990 to 2015 for every 5 years. Since this CBSI presents the evolution from 2010 to 2015, it was assumed that the value collected for 2010 was the same for 2011 and 2012, and the value collected for 2015 was the same for 2013 and 2014 if there were no changes of growth or decrease. Another limitation was the lack of information for the component Tourism (T) for the year of 2015, so it was assumed that there was no increase or decrease from the previous year.
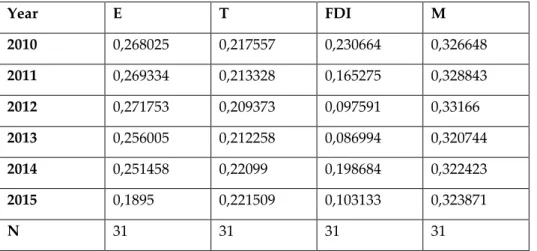
In Table 4, we can observe the mean of the normalized final values for the 4 variables: Exports (E), Tourism (T), Foreign Direct Investment (FDI) and Immigration (M). We can observe that, although the variable Exports (E) increased from 2010 to 2012, there was a decrease from 2012 to 2015. With Tourism (T) the opposite happened: from 2010 to 2012 there was a drop and from
2012 to 2015 a rise. For Foreign Direct Investment (FDI) although there was an increase in 2014, this variable is tending to decline over the analysed period. The component Immigration (M) shows a decline from 2012 to 2013, but in all the other years this value tends to increase.
Table 4: Mean of variables per year of the 31 countries
Year E T FDI M 2010 0,268025 0,217557 0,230664 0,326648 2011 0,269334 0,213328 0,165275 0,328843 2012 0,271753 0,209373 0,097591 0,33166 2013 0,256005 0,212258 0,086994 0,320744 2014 0,251458 0,22099 0,198684 0,322423 2015 0,1895 0,221509 0,103133 0,323871 N 31 31 31 31
4.3.2 CBSI results
To compute the CBSI for a country, all four variables must have non-missing values. For each component, it was given the same weight in the index since there is no developed index to measure the strength of a country brand. It is assumed that a high CBSI score indicates a strong country brand while a low score indicates a weak country brand.
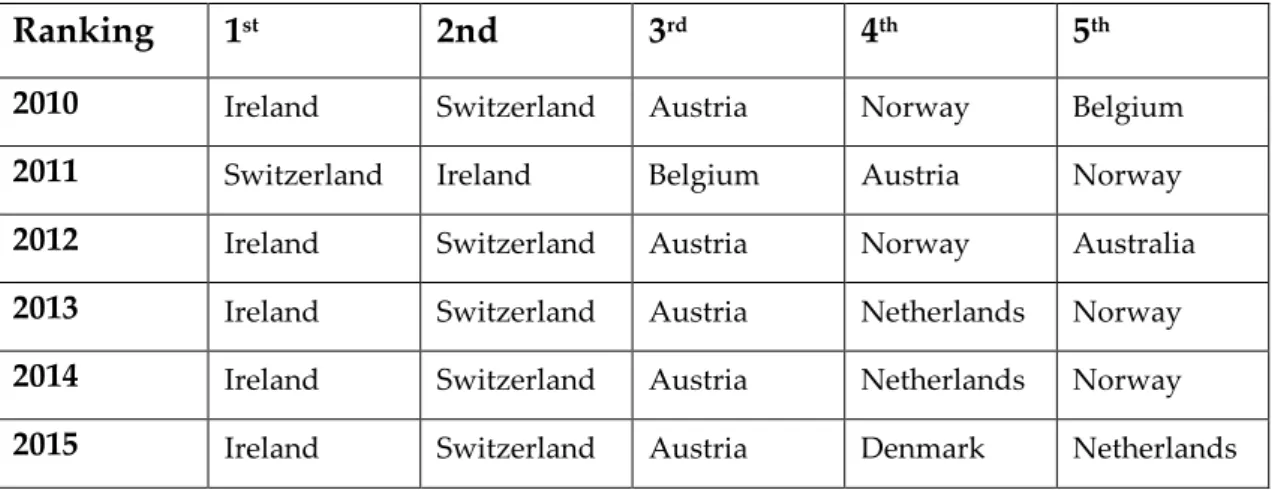
Table 5 presents the final top 5 ranking of our CBSI for all the 5 years: 2010,2011,2012,2013,2014 and 2015. Ireland occupies the 1st position in all the years except for one (2011). Switzerland achieved the 2nd place in 4 years except for 2011. Austria, except for 2011 where Belgium occupies the 3rd place, conquered the 3rd place in 4 years. Norway and Netherlands occupy alternatively the 4th and the 5th position from 2010 to 2015.
Table 5: Top 5 final ranking for 2010 to 2015
Ranking 1st 2nd 3rd 4th 5th
2010 Ireland Switzerland Austria Norway Belgium
2011 Switzerland Ireland Belgium Austria Norway
2012 Ireland Switzerland Austria Norway Australia
2013 Ireland Switzerland Austria Netherlands Norway
2014 Ireland Switzerland Austria Netherlands Norway
2015 Ireland Switzerland Austria Denmark Netherlands
Portugal occupied the 18th position in 2010, 2012 and 2013. Achieved the 16th place in 2014 and dropped to position number 17 in 2015 as seen in Table 6.
Table 6: Portugal: final ranking for 2010 to 2015
Portugal 2010 2011 2012 2013 2014 2015
Ranking 18 17 18 18 16 17
In the next Table 7 we can observe the average ranking for our CBSI for all the years in analysis and for all the 31 countries.
Table 7: Final average ranking for all the countries from 2010 to 2015
Country Rank Avg Country Rank Avg Ireland 1,17 Czech. Rep 17,00
Switzerland 1,83 Portugal 17,33
Austria 3,17 Russia 19,00
Norway 5,33 South Korea 20,00
Netherlands 5,83 Turkey 21,50
Denmark 6,17 Poland 21,50
Australia 6,17 South Africa 23,50
Belgium 7,17 Argentina 23,50 Canada 8,83 Japan 25,17 Sweden 9,33 Mexico 25,83 Spain 11,17 Brazil 27,33 France 11,83 Egypt 27,67 Germany 13,00 China 29,00 UK 14,00 Indonesia 30,00 Italy 15,17 India 31,00 United States 16,50
We observe in Table 7 that Ireland, with the strongest country brand, occupies the 1st position in our CBSI average ranking, Switzerland the 2nd, Austria the 3rd, Norway the 4th and Netherlands the 5th. Portugal is the 18th country in our sample that has the strongest country brand from 2010 to 2015. Brazil, Egypt, China, Indonesia and India are our 5 countries with the weakest average score for their country brand from 2010 to 2015.
We analysed not only the relative position of countries in the ranking, but also their growth. For measuring growth, we decided to use an absolute growth that was calculated by subtracting the final value for 2015 with the 2010th final value for all the index values. The percentage growth calculated is the absolute growth divided by the initial value.
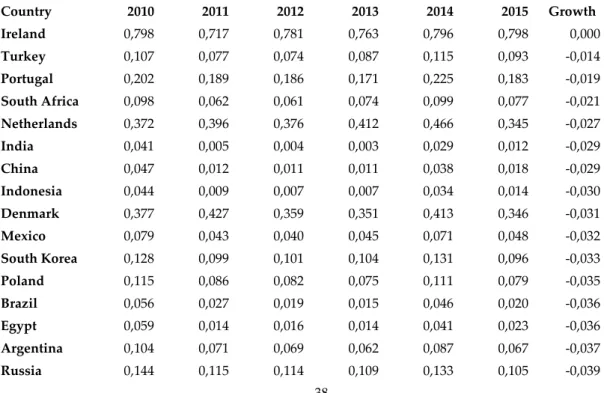
In Table 8 we show the final values for our CBSI from 2010 to 2015 for all the 31 countries and we conclude that all countries decreased from the beginning of the analysis period until its end. Ireland is the only country which didn´t decreased comparing to the other countries computed in this CBSI. Portugal was the 3rd country that decreased less with an absolute growth of -0,014 from 2010 to 2015.
Table 8: CBSI: 31 countries from 2010 to 2015 and their absolute growth
Country 2010 2011 2012 2013 2014 2015 Abs Growth Ireland 0,798 0,717 0,781 0,763 0,796 0,798 0,000 Turkey 0,107 0,077 0,074 0,087 0,115 0,093 -0,014 Portugal 0,202 0,189 0,186 0,171 0,225 0,183 -0,019 South Africa 0,098 0,062 0,061 0,074 0,099 0,077 -0,021 Netherlands 0,372 0,396 0,376 0,412 0,466 0,345 -0,027 India 0,041 0,005 0,004 0,003 0,029 0,012 -0,029 China 0,047 0,012 0,011 0,011 0,038 0,018 -0,029 Indonesia 0,044 0,009 0,007 0,007 0,034 0,014 -0,030 Denmark 0,377 0,427 0,359 0,351 0,413 0,346 -0,031 Mexico 0,079 0,043 0,040 0,045 0,071 0,048 -0,032 South Korea 0,128 0,099 0,101 0,104 0,131 0,096 -0,033 Poland 0,115 0,086 0,082 0,075 0,111 0,079 -0,035 Brazil 0,056 0,027 0,019 0,015 0,046 0,020 -0,036 Egypt 0,059 0,014 0,016 0,014 0,041 0,023 -0,036 Argentina 0,104 0,071 0,069 0,062 0,087 0,067 -0,037 Russia 0,144 0,115 0,114 0,109 0,133 0,105 -0,039
Japan 0,090 0,049 0,051 0,044 0,073 0,050 -0,041 United States 0,232 0,206 0,198 0,185 0,207 0,187 -0,045 France 0,309 0,285 0,271 0,270 0,285 0,256 -0,053 Czech. Rep 0,228 0,187 0,205 0,185 0,223 0,175 -0,053 Italy 0,245 0,227 0,204 0,197 0,225 0,190 -0,056 Sweden 0,347 0,357 0,347 0,307 0,333 0,289 -0,058 UK 0,267 0,233 0,230 0,220 0,256 0,208 -0,060 Spain 0,328 0,297 0,288 0,269 0,302 0,264 -0,063 Austria 0,555 0,557 0,523 0,521 0,565 0,487 -0,068 Canada 0,362 0,345 0,336 0,339 0,366 0,293 -0,069 Germany 0,306 0,283 0,270 0,240 0,270 0,235 -0,071 Australia 0,398 0,422 0,401 0,382 0,398 0,321 -0,077 Switzerland 0,711 0,724 0,644 0,596 0,617 0,613 -0,098 Belgium 0,448 0,569 0,328 0,347 0,318 0,313 -0,136 Norway 0,483 0,480 0,458 0,385 0,426 0,291 -0,191
We can observe in Figure 1 the decreasing trend for the 4 countries that decreased the most (dashed lines) and for the 4, which decreased the less. -0,051 was the average absolute growth of the 31 countries from 2010 to 2015.
Figure 1: Absolute growth trend of the 4 countries and 4 last ones
In Table 8 we check that Norway 0,191), Belgium 0,136), Switzerland (-0,098) and Australia (-0,077) are the countries, which decreased the most from 2010 to 2015. In Figure 1 we can identify the decrease of these 4 countries (dashed line). Beside these decreases, these countries managed to score high values in our final CBSI. 0 0,1 0,2 0,3 0,4 0,5 0,6 0,7 0,8 2010 2011 2012 2013 2014 2015
Absolute growth trend
Ireland Turkey Portugal South Africa Norway Belgium Switzerland Australia
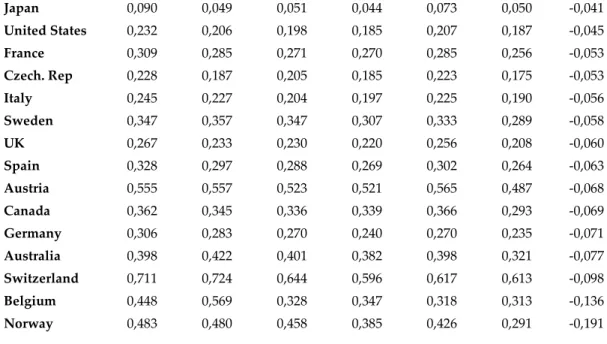
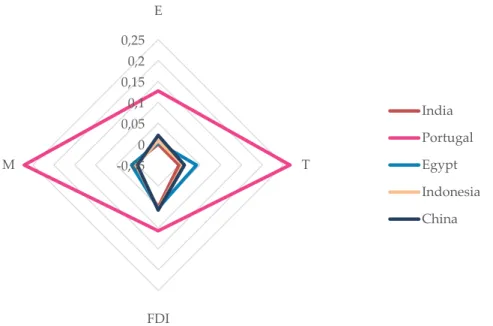
We wanted to compare multiple quantitative variables, so we decided to use radar graphs. This graph is useful for seeing which variables have similar values or which variables are scoring high or low within a dataset. In Figure 2 and Figure 3 we verify our four variables: E stands for Exports, T for Tourism, FDI for Foreign Direct Investment and M for Immigration. Presented are the top 4 scored countries for our CBSI and Portugal. We conclude that Portugal is weaker in all variables: Exports (E), Tourism (T), Foreign Direct Investment (FDI) and Immigration (M), than Ireland, Switzerland, Austria and Norway. Ireland has the strongest country brand having the perfect balance between the 4 components. Switzerland is stronger in Immigration (M) than Ireland, but weaker in Tourism (T) and in Foreign Direct Investment (FDI). Austria has a strong Tourism (T) variable, but a weaker Exports (E) and Foreign Direct Investment (FDI) final values.
Figure 2: Comparison: Portugal and the top 4 countries in our CBSI
Comparing Portugal with the 4 worst countries in our CBSI score (Figure 3) we verify that Portugal is significantly stronger in all four variables than Egypt, China, Indonesia and India.
0 0,2 0,4 0,6 0,8 1 E T FDI M Ireland Portugal Switzerland Norway Austria
Figure 3: Comparison: Portugal and the 4 worst countries in our CBSI
We decided to analyse deeper each variable and understand how each country is positioned in each one of them.
4.3.3 Exports (E)
The values per capita for Exports from 2010 to 2015 are seen in Table 9. The average of all 31 countries for 2010 to 2015 is 15287,2 million USD.
Table 9: Values for the variable Exports from 2010 to 2015(per capita)
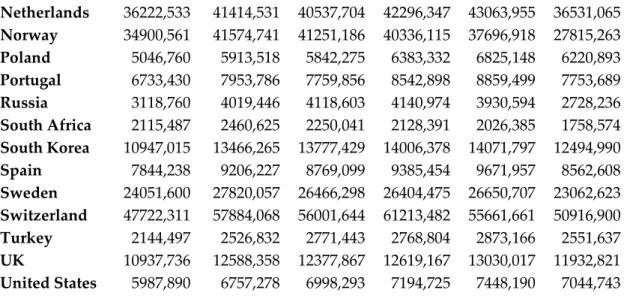
Country 2010 2011 2012 2013 2014 2015 Argentina 1945,737 2348,085 2106,070 1896,883 1764,572 1485,273 Australia 10081,061 13153,520 14394,701 13415,121 12959,640 11148,151 Austria 23798,201 27438,968 26001,917 26864,639 27209,294 23227,097 Belgium 33929,980 38940,029 36824,111 38048,410 39393,487 33439,830 Brazil 1194,240 1496,012 1425,393 1407,974 1312,081 1113,662 Canada 13793,411 15919,226 15860,719 15829,705 15886,907 13638,449 China 1197,929 1492,636 1610,342 1734,406 1850,189 1773,066 Czech. Rep 13079,140 15486,116 15028,257 15309,634 16298,283 14557,267 Denmark 28662,412 32456,741 31139,511 32534,017 32740,135 27771,650 Egypt 569,606 579,316 534,767 560,541 485,825 477,394 France 10601,096 12180,011 11647,745 12178,800 12359,509 10871,677 Germany 17655,605 20587,712 20262,321 20768,898 21868,527 19326,856 India 304,015 358,640 354,862 368,768 361,251 318,672 Indonesia 759,398 960,324 910,121 868,826 827,090 705,840 Ireland 50188,486 53849,847 52567,085 55203,392 63155,425 75802,447 Italy 9030,353 10352,154 9952,093 10208,777 10373,340 9004,605 Japan 6692,509 7189,958 7072,997 6443,865 6692,088 6088,557 Mexico 2647,074 3042,106 3173,273 3241,326 3345,128 3183,778 -0,05 0 0,05 0,1 0,15 0,2 0,25 E T FDI M India Portugal Egypt Indonesia China
Netherlands 36222,533 41414,531 40537,704 42296,347 43063,955 36531,065 Norway 34900,561 41574,741 41251,186 40336,115 37696,918 27815,263 Poland 5046,760 5913,518 5842,275 6383,332 6825,148 6220,893 Portugal 6733,430 7953,786 7759,856 8542,898 8859,499 7753,689 Russia 3118,760 4019,446 4118,603 4140,974 3930,594 2728,236 South Africa 2115,487 2460,625 2250,041 2128,391 2026,385 1758,574 South Korea 10947,015 13466,265 13777,429 14006,378 14071,797 12494,990 Spain 7844,238 9206,227 8769,099 9385,454 9671,957 8562,608 Sweden 24051,600 27820,057 26466,298 26404,475 26650,707 23062,623 Switzerland 47722,311 57884,068 56001,644 61213,482 55661,661 50916,900 Turkey 2144,497 2526,832 2771,443 2768,804 2873,166 2551,637 UK 10937,736 12588,358 12377,867 12619,167 13030,017 11932,821 United States 5987,890 6757,278 6998,293 7194,725 7448,190 7044,743
Normalizing the values in Table 9 we achieve, as seen in Table 10 the ranking for the variable Exports (E) for all 31 countries for the period in analysis.
Table 10: Exports average ranking for the 31 countries from 2010 to 2015
Country Rank Avg Ireland 1,50 Switzerland 1,50 Netherlands 3,33 Norway 4,00 Belgium 4,67 Denmark 6,00 Sweden 7,50 Austria 7,50 Germany 9,00 Canada 10,33 Czech. Rep 10,67 South Korea 12,17 Australia 13,50 UK 13,50 France 14,83 Italy 16,00 Spain 17,00 Portugal 18,00 United States 19,50 Japan 19,83 Poland 20,67 Russia 22,17 Mexico 22,83 Turkey 24,00 South Africa 25,17 Argentina 26,33
China 26,67 Brazil 27,83 Indonesia 29,00 Egypt 30,00 India 31,00
Ireland is in the 1st position being the country with the strongest Export values from 2010 to 2015.
On the other half, China, Brazil, Indonesia, Egypt and India are the weakest countries in this component. Portugal is situated in the 18th position, after Spain and before United States.
For this component, the average absolute growth rate was -0,07852 in the 5-year analyse period. In Table 11 we can observe the top 10 growth countries and their difference from the first year to the last year of analysis. Only China grew from 2010 to 2015 (0,00135). Ireland and India maintained their position from 2010 in 2015 and all the other countries decreased. From our 31 country-sample
Table 11: Top 10 absolute growths from 2010 to 2015 for Exports
Exports (E) Country
Abs Growth 1 China 0,00135 2 India 0,00000 3 Ireland 0,00000 4 Egypt -0,00322 5 Indonesia -0,00400 6 Turkey -0,00731 7 Brazil -0,00731 8 Mexico -0,00901 9 Poland -0,01688 10 South Africa -0,01724
Portugal was the 14th country decreasing 0,03039 from 2010 to 2015, which means that the values for Exports in this country dropped. Denmark, Belgium, Netherlands, Switzerland and Norway are the countries which decreased the most from 2010 to 2015 with drops of 0,20479, 0,23529, 0,24030, 0,28024 and 0,32926, respectively. Although these countries were the ones which dropped the most, they still managed to be in the top 10 position in Exports (E) from 2010 to 2015.
4.3.4 Tourism (T)
The values per capita for the component Tourism is presented in Table 12. The average of the 31 country-sample for this variable from 2010 to 2015 is 0,618 million people. Even though we used the original values for Tourism (T) for the year of 2014 in 2015 due to lack of information, after dividing this values with the population data, we obtain the values per capita for Tourism (T) presented in Table 12.
Table 12: Values for the variable Tourism from 2010 to 2015(per capita)
Country 2010 2011 2012 2013 2014 2015 Argentina 0,12918 0,13696 0,13272 0,12332 0,13799 0,13661 Australia 0,26280 0,25833 0,26540 0,27607 0,29270 0,28880 Austria 2,63099 2,74225 2,86489 2,92628 2,96093 2,93703 Belgium 0,65953 0,67833 0,67935 0,68713 0,70224 0,69885 Brazil 0,02599 0,02709 0,02805 0,02846 0,03120 0,03094 Canada 0,47696 0,46630 0,47031 0,45680 0,46526 0,46126 China 0,04161 0,04284 0,04274 0,04102 0,04077 0,04056 Czech. Rep 0,82382 0,85927 0,96311 0,97962 1,00871 1,00623 Denmark 1,57615 1,41170 1,50995 1,52397 1,81927 1,80884 Egypt 0,17127 0,11335 0,13070 0,10471 0,10748 0,10521 France 1,17869 1,23195 1,24856 1,26772 1,25973 1,25384 Germany 0,32864 0,34688 0,37812 0,38407 0,40748 0,40533 India 0,00469 0,00506 0,00521 0,00545 0,00593 0,00586 Indonesia 0,02898 0,03125 0,03243 0,03503 0,03708 0,03663 Ireland 1,56442 1,66711 1,64599 1,79632 1,90872 1,89907 Italy 0,73596 0,77668 0,77864 0,79198 0,79909 0,79892 Japan 0,06724 0,04866 0,06552 0,08139 0,10550 0,10565 Mexico 0,19635 0,19443 0,19172 0,19518 0,23405 0,23104 Netherlands 0,65500 0,67693 0,69711 0,76069 0,82567 0,82219
Norway 0,97500 1,00200 0,90424 0,94062 0,94506 0,93439 Poland 0,32779 0,35073 0,38988 0,41535 0,42092 0,42106 Portugal 0,63898 0,68804 0,71356 0,77429 0,87414 0,87857 Russia 0,15598 0,17440 0,19676 0,21457 0,22543 0,22499 South Africa 0,15903 0,16177 0,17549 0,17929 0,17664 0,17375 South Korea 0,17806 0,19677 0,22278 0,24245 0,28165 0,28058 Spain 1,13097 1,20183 1,22857 1,30148 1,39832 1,40020 Sweden 0,55267 0,55264 0,54058 0,54467 0,58374 0,57762 Switzerland 1,10263 1,07856 1,07117 1,10850 1,11838 1,10511 Turkey 0,43374 0,47137 0,47693 0,49584 0,51353 0,50608 UK 0,45080 0,46327 0,45968 0,48439 0,50474 0,50067 United States 0,19399 0,20153 0,21221 0,22120 0,23521 0,23337
Normalizing the values in Table 12 we achieve the Average Ranking over the various years for the variable Tourism (T) which is shown in Table 13.
Table 13: Tourism average ranking for the 31 countries from 2010 to 2015
Country Rank Avg Austria 1,00 Ireland 2,17 Denmark 2,83 Spain 4,50 France 4,50 Switzerland 6,00 Czech. Rep 7,33 Norway 7,67 Italy 9,67 Portugal 10,00 Netherlands 10,83 Belgium 11,50 Sweden 13,00 Turkey 14,33 UK 15,33 Canada 15,33 Poland 17,17 Germany 17,83 Australia 19,00 South Korea 20,50 United States 20,83 Mexico 22,00 Russia 23,00 South Africa 24,00 Argentina 25,17 Egypt 25,67 Japan 26,83
China 28,00
Indonesia 29,00
Brazil 30,00
India 31,00
Austria, Ireland, Denmark, Spain and France are the strongest countries in this component conquering the top 5 places in the Rank. Japan, China, Indonesia, Brazil and India are on the other hand, the weakest countries in Tourism (T). Portugal is spotted in the 10th position, but as we can see in Table 14 it was the country from all our 31 country-sample that grew the most from 2010 to 2015. For this variable, the absolute average growth was positive and took a value of 0,00395. The number of inbound tourists in million people for Portugal grew 35% from 2010 to 2015.
In Table 14 we can observe the top 10 absolute growth countries in Tourism (T) from our 31 country-sample. Portugal (0,05622), Ireland (0,05200), Spain (0,04685) and Netherlands (0,03089) are the ones which grew the most in this variable.
Table 14: Top 10 absolute growths from 2010 to 2015 for Tourism
Tourism (T) Country Abs Growth 1 Portugal 0,05622 2 Ireland 0,05200 3 Spain 0,04685 4 Netherlands 0,03089 5 Czech. Rep 0,02940 6 South Korea 0,02771 7 Poland 0,01863 8 Russia 0,01716 9 Denmark 0,01675 10 Germany 0,01294
Portugal´s increase in this variable can be explained for various reasons: Portugal won 3 years in a row (2014,2015,2016) the Europe's Leading Tourist Board price by the World Travel Awards; Portugal won a lot of tourism prices in the last years involving innovation and creativity; Lisbon won “the best city” by the Wallpaper Design Awards in 2017 and Porto was distinguished with the prestigious title of “Best European Destination” in 2012, 2014 and 2017 by the European Best Destinations.7 History shows that Portugal is a country with potential in this variable.
In Figure 4 we can observe the top 10 absolute growths from our 31 country-sample in this variable.
Figure 4: Top 10 absolute growth from 2010 to 2015 for Tourism
In the next graph (Figure 5), there are all the countries which grew negatively in Tourism (T) from 2010 to 2015. UK, South Africa, Australia and Italy dropped only 0,001 to 0,008 from 2010 to 2015. Although Switzerland and Norway were the countries, which decreased the most achieving the values -0,043 and -0,053, respectively, they occupied the 6th and 7th position in the Tourism (T) Ranking as seen in Table 13. 7 http://www.turismodeportugal.pt 0,056 0,052 0,047 0,031 0,029 0,028 0,019 0,017 0,017 0,013 0,00 0,01 0,02 0,03 0,04 0,05 0,06 P or tu g al Ir el an d S pa in N et h er la n ds Cz ec h . Rep S ou th K or ea P ol an d Ru ss ia De n m ar k G er m an y
Tourism (T) - Growth
Figure 5: Decreased absolute growth from 2010 to 2015 for Tourism
4.3.5 Foreign Direct Investment (FDI)
For the variable Foreign Direct Investment, the values per are presented in Table 15.
Table 15: Values for the variable Foreign Direct Investment from 2010 to 2015(per capita)
Country 2010 2011 2012 2013 2014 2015 Argentina 0,00027 0,00026 0,00036 0,00023 0,00012 0,00027 Australia 0,00165 0,00264 0,00260 0,00246 0,00169 0,00094 Austria 0,00031 0,00127 0,00047 0,00067 0,00109 0,00045 Belgium 0,00397 0,00708 0,00059 0,00122 -0,00077 0,00275 Brazil 0,00042 0,00048 0,00038 0,00026 0,00035 0,00031 Canada 0,00084 0,00116 0,00124 0,00204 0,00165 0,00136 China 0,00009 0,00009 0,00009 0,00009 0,00009 0,00010 Czech. Rep 0,00059 0,00022 0,00076 0,00035 0,00052 0,00012 Denmark -0,00165 0,00205 0,00007 0,00019 0,00062 0,00064 Egypt 0,00008 -0,00001 0,00007 0,00005 0,00005 0,00008 France 0,00021 0,00048 0,00026 0,00065 0,00023 0,00064 Germany 0,00080 0,00083 0,00035 0,00014 0,00001 0,00039 India 0,00002 0,00003 0,00002 0,00002 0,00003 0,00003 Indonesia 0,00006 0,00008 0,00008 0,00007 0,00009 0,00006 Ireland 0,00939 0,00514 0,00987 0,00976 0,00674 0,02167 Italy 0,00015 0,00058 0,00000 0,00040 0,00038 0,00033 Japan -0,00001 -0,00001 0,00001 0,00002 0,00002 -0,00002 Mexico 0,00022 0,00020 0,00017 0,00037 0,00020 0,00024 Netherlands -0,00043 0,00146 0,00120 0,00306 0,00310 0,00429 Norway 0,00349 0,00308 0,00374 0,00078 0,00155 -0,00082 -0,001-0,001-0,002-0,002-0,003 -0,008 -0,013-0,014 -0,021 -0,024 -0,030 -0,043 -0,053 -0,06 -0,05 -0,04 -0,03 -0,02 -0,01 0,00 UK S ou th A fr ica A u st ra li a Chi n a A rg en tin a It aly Be lg ium S w ed en F ra n ce Ca n ada Eg y pt S w it zer la n d N or w ay
Tourism (T) - Growth
Poland 0,00034 0,00042 0,00033 0,00010 0,00033 0,00020 Portugal 0,00023 0,00070 0,00084 0,00026 0,00073 0,00058 Russia 0,00022 0,00026 0,00021 0,00037 0,00020 0,00007 South Africa 0,00007 0,00008 0,00009 0,00016 0,00011 0,00003 South Korea 0,00019 0,00020 0,00019 0,00025 0,00018 0,00010 Spain 0,00086 0,00061 0,00055 0,00071 0,00049 0,00020 Sweden 0,00001 0,00137 0,00172 0,00051 0,00037 0,00128 Switzerland 0,00367 0,00358 0,00200 0,00008 0,00081 0,00831 Turkey 0,00013 0,00022 0,00018 0,00016 0,00016 0,00021 UK 0,00093 0,00067 0,00087 0,00074 0,00081 0,00061 United States 0,00064 0,00074 0,00060 0,00067 0,00033 0,00118
After normalizing the values in Table 15 for the variable Foreign Direct Investment (FDI) we computed an Average Ranking over the years for this component presented in Table 16.
Table 16: FDI average ranking for the 31 countries from 2010 to 2015
Country Rank Avg Ireland 1,17 Australia 4,50 Canada 6,17 Switzerland 7,83 Netherlands 8,50 Norway 8,67 UK 8,83 Belgium 9,17 Austria 10,83 United States 11,00 Sweden 12,17 Spain 12,50 Portugal 12,83 Czech. Rep 15,33 France 15,50 Brazil 15,50 Denmark 17,50 Germany 17,50 Italy 18,17 Argentina 18,50 Poland 18,83 Mexico 19,33 Russia 19,83 South Korea 21,50 Turkey 21,67 China 24,67
South Africa 25,50
Indonesia 26,83
Egypt 27,17
India 28,50
Japan 30,00
Ireland occupies the 1st position, scoring the highest value of the 31 countries for Foreign Direct Investment (FDI). For this variable, the average absolute growth of the 31 country-sample was -0,12753 in the 5-year analyse period. In this case, we observe that the rankings for the 31 countries for 2010 to 2015 was not so consistent as in the other variables.
In Table 17 we can observe the top 10 countries, which grew the most in FDI from our 31 country-sample.
Table 17: Top 10 absolute growths from 2010 to 2015 for Foreign Direct Investment
Foreign Direct Investment
(FDI) Country Abs Growth 1 Netherlands 0,11672 2 Denmark 0,06482 3 Ireland 0,00000 4 Sweden -0,05752 5 Switzerland -0,07659 6 France -0,10407 7 Portugal -0,10811 8 Italy -0,11246 9 Japan -0,11317 10 India -0,11378
From all the 31 countries analysed, Netherlands (0,11672), Denmark (0,06482) and Ireland (0,00000) were the only countries that grew from 2010 to 2015. The other 28 countries decreased from -0,5752 (Sweden) to -0,46539 (Norway). After Norway, UK, Spain, Australia and Belgium were the countries that dropped the most from 2010 to 2015. Beside this drop, Belgium conquered the 2nd place in the