A Work Project, presented as part of the requirements for the Award of a Masters Degree in Management from the Faculdade de Economia da Universidade Nova de Lisboa
Overcoming the “European Paradox”: The role of Regional Innovation Systems (RIS) in translating R&D investments into economic and employment growth
José Maria Castro Lopes Rodrigues Carolino #1698
A Project carried out on the Management course, with the supervision of:
Professor Filipe Castro Soeiro
1
Abstract
The emergence of the so-called “European Paradox” shows that R&D investment is not maximally effective and that increasing the scale of public R&D expenditures is not sufficient to generate employment and sustained economic growth. Increasing Governmental R&D Investment is far from being a “panacea” for stagnant growth. It is worth noting that Government R&D Investment does not have a statistically significant impact on employment, indicating the need to assess the trade-offs of policies that could lead to significant increases in government expenditure. Surprisingly, Governmental R&D Employment does not contribute to “mass-market” employment, despite its quite important role in reducing Youth-Unemployment. Despite the negative side-effects of Governmental R&D Employment on both GVA and GDP, University R&D Employment appears to have a quite important role in reducing Unemployment, especially Youth-Unemployment, while it also does not have a downside in terms of economic growth. Technological Capacity enhancement is the most effective instrument for reducing Unemployment and is a policy without any downside regarding sustainable economical development. In terms of wider policy implications, the results reinforce the idea that European Commission Research and Innovation policies must be restructured, shifting from a transnational framework to a more localised, measurable and operational approach.
Keywords: Innovation Management, Regional Innovation Systems, European Paradox, Europe 2020 Growth Strategy
2
1. Introduction
Over the last three decades, European regions have experienced considerable industrial restructuring towards a more decentralised and flexible industry structure in order to harness the forces of technology and globalization (Audretsch et al., 2000), shifting from traditional manufacturing towards new and more complex industries, such as Information and Communications Technologies (ICT), Biotechnology and Big-Pharma (Audretsch et al., 2012; Carlsson et al., 2007; Choudhary and Gabriel, 2009). In this process, Regional Innovation Systems (RIS) play an important role for two main reasons. The first is that the use of new technologies such as software, e-commerce and Enterprise Resource Planning (ERP) has reduced the importance of scale economies in many sectors (Audretsch et al., 2012; Carlsson, 1989; Piore and Sabel, 1984; Zenger 1994). The role of new business formation in technological change is enhanced by reductions in economies of scale and by increasing global economic uncertainty (Audretsch et al., 2000; Audretsch and Thurik, 2001a, 2001b; Mata and Machado, 1996). Small and Medium Enterprises (SME) rely on their regional economies to cope with this volatile market environment through access to specialised knowledge sources and technology transfer networks, enabling them to develop innovative, high value-added and marketable products at competitive prices (Audretsch and Lehmann, 2005a, 2005b; Audretsch et al., 2005; Gilbert et al., 2008; Lindic et al., 2012). The second reason concerns the increasing pace of innovation associated with the shortening of technology and product life-cycles (Adner and Levinthal, 2001; Agarwal 1998; Agarwal and Gort, 2002; Auerswald, 2010; Dinlersoz and MacDonald, 2009; Fritsch, 2008; Klepper, 1996). This development appears to favour new entrants, in particular, the industry spin-offs and knowledge-based start-ups that have greater flexibility than established corporations in coping with decreasing time-to-market and other disruptive changes (Baumol, 2004; Klepper and Sleeper, 2005; Pe’er and Vertinsky, 2008; Zenger, 1994). How can societies foster innovation so that R&D investment, both public and private, has measurable, sustained and sustainable positive effects on economic and employment growth? Can innovation be described as a systematic, standardised and reproducible process? Can the same operational model be applied effectively across different nations, industries or regions, despite their idiosyncrasies? From a wider perspective, these appear to be
3
important research questions because governments often actively engage in policies intended to support research, innovation and entrepreneurship. Within the European Union (EU 27), government efforts to foster innovation have been considerable, with the public sector accounting for 33.4% of Gross Domestic Expenditure on R&D (GERD), the higher-education sector accounting for 0.9% of Gross Domestic Expenditure on R&D in 2011 (Eurostat, 2013a, 2013b) and R&D Expenditures accounting for 2.1% of GDP, on average, in 2012 (Eurostat, 2013c). Given these allocations of resources, one might expect that increasing R&D investment would induce higher economic growth and that encouraging knowledge-based entrepreneurship would generate additional employment (Fritsch, 2008; Thurik et al., 2008). However, as shown by the “Swedish Paradox” and the so-called “European Paradox”, these conditions are insufficient to foster economic and employment growth (Audretsch et al., 2012; Ejermo et al., 2011; Van Stel and Storey, 2004). In light of the above considerations, the main purpose of this study is to fill in the gap between R&D efforts and the attainment of measurable, sustained and sustainable outcomes in terms of economic and employment growth. Based on the assumption that innovation is a “located phenomenon,” this research study seeks to address the following research questions:
(a) Is it possible to identify the composite dimensions of RISs that can be adopted and managed as independent economic policies and that are generalisable to all regions, despite the idiosyncrasies of
different regions? (b) Is it possible to map the overall RIS architecture by identifying mediatory variables and by
measuring their influence on the attainment of statistically significant outcomes at the macro-economic level (i.e., Unemployment, Youth-Unemployment, Gross Value Added and Gross Domestic
4
2. Literature Review
Knowledge is seen as a source of competitive advantage for nations, and, as observed by David and Foray, “Economic historians point out that nowadays disparities in the productivity and growth of different countries have far less to do with their abundance (or lack) of natural resources than with the capacity to improve the quality of human capital and factors of production: in other words, to create new knowledge and ideas and incorporate them in equipment and people” (2002: 9– 10). If so, what are the mechanisms through which knowledge and ideas can be converted into economic activity in measurable, sustained and sustainable ways? R&D intensity generates new ideas and expands the technological opportunity set; the increased knowledge endowment in turn enhances the profitability of entrepreneurial activity by facilitating recognition and exploitation of new business opportunities (Acs et al., 2009; Auerswald, 2010; Fritsch, 2008; Wersching, 2010). Hence, the industrial sectors with a greater share of R&D employment tend to host more new fast-growing companies (Eckhardt and Shane, 2011), while firms with high “technological-competence-enhancing capability” can translate knowledge accumulation into sustained growth when knowledge is leveraged by the initial scale of such firms’ technological endowments (Lee, 2010). It has been found that firms located in research-driven clusters tend to exhibit greater innovation, higher rates of growth and higher survival rates than firms not located within such geographical boundaries (Gilbert et al., 2008). Empirical evidence suggesting that University-Industry-Government pathways have a regional scope (e.g., Sternberg and Litzenberger, 2004) can also be found in the Knowledge Spillover Theory of Entrepreneurship literature. Regions characterised by higher R&D investment also tend to experience greater knowledge spillover (e.g., Audretsch and Feldman, 1996; Audretsch and Lehmann, 2005b; Audretsch and Keilbach, 2004, 2008), and venture sustainability is influenced not only by traditional economic factors, such as market potential (e.g., Pires, 2005) or demand sophistication (e.g., Buesa et al., 2010; Lindic et al., 2012), but also by the opportunity to access the knowledge and technology generated by surrounding universities (Audretsch et al., 2005). Thus, the knowledge contexts can be a source of regional competitive advantage (e.g., Fritsch, 2008; Pe’er and Vertinsky, 2008; Tappeiner et al., 2008). Fritsch & Schwirten (1999) concluded that co-operation between public research
5
institutions and private firms is a widspread aspect and has significant impact on the early stages of innovation such as: development of new products and technological services. These evidences show that universities are essential, especially for small firms to grasp economic growth and that small firms tend to cluster near universities, as being the source of knowledge. Moreover, geographic proximity can entail and its benefical to reinforce and maintain these co – operation between public and private sector, since a large number of co-operation partners come from within the same region. (Arundel & Geuna, 2004) found that the European firms use diverse types to acquire codified knowledge, such as by attending conferences, and reading research publications. Other types of sources were found to acquire non – codified knowledge as well, such as by recurring to informal personal contacts and joint researches and by hiring high skilled and trained engineers and scientists. Besides, industry– university relations has been pointed out as following mechanisms to promote the exploitation of knowledge and ideas flow on regions (Mansfield & Lee, 1996). Similarly Mansfield & Lee (1996) concluded that since government funding has been more stricted, universities have been stteped up to obtain R&D outcomes from industries. Furthermore, distance to knowledge source also helps to define what firms obtains in terms of economic effect from the academic research, i.e, firms that are more closely to the source have more chances to be the first ones on applying the findings discovered. In addition, Meyer - Krahmer & Schmoch, (1998) concluded two important aspects. Firstly, they propose a “two-way” concept that applies not only to industry-university relationship but also to governemental agencies. The study carried out on german firms concludes that the central linkage between universities and industrial firms is the transfer of knowledge and ideas in both directions. Secondly, Meyer-Krahmer & Schmoch (1998) outlined one characteristic inherent to regional innovation system - “structural absortive capacity” as it depends on macro-level factors, namely on the industrial life cicle, firm structure of the industrial sectors and on the science intensity of technologies, as well as on on micro-level factors, e.g., internal R&D capacity of one firm, formal co-operartion and informal networks (externalities). Universties play a vital role, especially regarding small firms and their capacity on creating innovation or new knowledge. (Feldman, 1994) concluded that small firms are able to create innovative outuput not by their investment in R&D, since they have low levels, comparable to incumbent firms, but by absorving knowledge spillovers from university research,
6
which, leads us to believe that smaller firms or startups have a comparable advantage at exploring spillovers from universitires research.
Nevertheless, does Knowledge really spill over among regions? People and Regions need to be spatially connected to enhance the diffusion of knowledge. Kline & Rosemberg (1986) defended that the process of innovation need to be reviewed, i.e., Innovation changes not only in the context of hardware but also market environment, production facilities, knowledge and social context of organization. Likewise not only the internal sources of knowledge are important but also the external sources. Social capital is imprtant in what matters the diffusion of knowledge, specially tacit knowledge. (Hauser, Tappeiner, & Walde, 2007) defended that in addition to financial and human capital (conventional inputs), social capital has its specific and vital role and exherts a considerable impact on the production of economic knowledge. They also defended that new knowledge is more easily tranfered trough loose contacts than close friendships (strong ties), e.g., as rsult of activities in conferences and associations, that create innovation. (Grootaert & Van Bastelaer , 2001) affirmed that social capital has strong implications on various areas of human life and development, such as, “provision of services in both rural and urban areas, while transforming the prospects of agricultural development, influencing the expansion of firms, and improving the management of common resources and education”. In what regards to firms’ level they have the capacity to create effectively tacit knowledge by using spatially concentrated resources, however it is quite a challenge to share it widely within the organization itself (Gertler, 2001). Actually, this is becoming a real problem for firms, because some are not able to produce innovative output. Also Gertler (2001) concluded that the production of tacit knowledge is strongly localized. But the dissemination of knowledge have several spread effects within multi-divisional and multi – locational organizations. (Tappeiner, Hauser, & Walde, 2008 ) outlined with their study that there is clear evidence on the spatial aglomeration of patenting activities in Europe. However, this spatial agglomeration can be explained by two hiphotesis. The first one is related to the knowledge spillovers that are tranfered from innovation region through neighboring regions. The second one states that this spatial agglomeration is produced by a spatial concentration of the inputs necessary for the knowledge creation. Furthermore, Tappeiner,
7
Hauser, & Walde, (2008 ) also narrowed the later and concluded that these input factors can be a consequence of cluster patenting activities by either the traditional factors such as R&D expenses and human capital or by the concept of social capital.
European policy trends regarding academic research are focused on merging universities and research labs to gain critical mass, aiming at the creation of elite higher-education and research institutions. Such scale-up policies were started in 2004 at a national level just in Denmark; subsequently, however, other countries – namely, Germany and Finland – have followed the Danish strategy of increasing installed research capacity to enable research institutions to compete with top universities worldwide (Maassen and Stensaker, 2011). However, this conglomeration strategy is not confined to the country level but is also being implemented at a transnational level by the European Commission (EC), with the establishment of the European Research Council (ERC) and the European Institute of Innovation and Technology (EIT). The main goals of the ERC are to attract top researchers from around the world and leverage available funding from national sources to make the EU an attractive destination for the conduct of cutting-edge research. The “focus” is on supporting basic research activities performed by individual researchers or by international research teams, either at universities or research institutions, as an alternative to the University-Industry pathway and Research Joint-Ventures. On the other hand, the goal of EIT is to fill the gap described above by: (1) Promoting the development of applied research and technology transfer networks; (2) Enhancing open-innovation, co-creation and entrepreneurship; and (3) Enhancing the international integration of academic research and of R&D networks. The overall objectives involve connecting businesses (including SME), entrepreneurs, research and higher education institutions (i.e., Universities and Polytechnics), investment communities (i.e., angel investors, venture capital funds, matching funds, private-equity companies and investment banks), basic research funders (i.e., governmental institutions, charities and foundations), regional development agencies, specialised public institutions and national governments or bodies. To achieve this, the EIT formulates funding schemes aimed at implementing Knowledge and Innovation Communities (KICs) and establishing technology transfer networks on a transnational basis. Both the ERC and EIT are currently under the umbrella of the 7th
8
Framework Program (FP7), which seeks to support research and innovation projects characterised by
the following identifiable patterns: (1) Transnational Integration: the applicant projects should involve entities from at least two and on
average three different countries. (2) Research Joint Ventures (RJV): the work programmes seek to engage open-innovation
Public-Private Partnerships (PPP) and consolidate University-Industry pathways, with the objective of enhancing knowledge transfer and human capital mobility between universities, public institutions and
industry. (3) Measurable Outcomes: projects require co-substantiation of the feasibility of the proposed RJV,
and applicants must provide evidence that milestones are achievable during the projected period of the project. (4) Interdisciplinary and Intersectoral research and training: in a wider perspective, the FP7 promotes the integration of various scientific and technological domains or complementary fields to produce multidisciplinary basic and applied research that could enhance economic activity through the introduction of value-added products or services and knowledge-based spin-offs and start-ups (European Commission, 2012a, 2012b, 2012c). After 2013, the FP7 will be replaced by the 8th Framework Program (FP8), which has a forecasted endowment of €80bn and will run from 2014 until 2020. The FP8 will be a significant part of the Europe 2020 Growth Strategy umbrella program, which has an overall budget forecast of €140Bn (European Commission, 2011). The EC has already identified Scientific Excellence, Industrial Leadership and Facing Societal Challenges as the key goals for the new Research and Innovation Framework Program, and the respective guidelines appear, at first glance, to cohere with the FP7’s approach. In terms of Scientific Excellence, the main priorities of making Europe a more attractive destination for cutting-edge research are maintained and reinforced. Regarding Industrial Leadership, investment priorities appear to become more narrowly focused on specific high-technology domains, more precisely, ICT, nanotechnologies, advanced materials, biotechnology, advanced manufacturing and processing. The final priority is Facing Societal Challenges, as previously identified by the EC. This involves, more precisely: (1) Health systems sustainability, demographic change and active-ageing; (2) Food security, sustainable agriculture and
9
marine resources exploitation; (3) Renewable energy generation, energy efficiency and smart-grids; (4) Eco-friendly, efficient and integrated public transportation; (5) Resource sustainability and efficient raw materials application and (6) Development of inclusive, innovative and secure societies. In this particular case, the FP8´s strategy appears to reinforce, to a still greater extent than FP7, the importance of multidisciplinary and applied research, already highlighted in FP7. However, the investment focus moves from multidisciplinary basic research to research-to-market activities such as piloting and demonstration, test beds and support for public procurement and market uptake.
Nevertheless, despite high uncertainty, asymmetric information and difficulties in appropriating returns from investments in newly-created knowledge, all of which characterise innovation-driven markets, R&D intensity positively influences access to financing (Brown and Petersen, 2010; Ciftci and Cready, 2011; Eckhardt et al., 2006). Indeed, even SMEs benefit from better access to financing compared with their larger counterparts in less knowledge-intensive industries (Audretsch and Weigand, 2005). R&D intensity presumably provides an environment in which SMEs can grow through continuous investment in innovation and by attracting external capital (Audretsch, 1995; Baumol, 2004; Carlsson et al., 2007; Harhoff, 2000; Huynh and Petrunia, 2010). An improved technological environment is also associated with the enhanced market power of firms (Wersching, 2010). As noted by Auerswald, “in industries where production processes are more complex, persistent profits accrue to surviving firms. Such profits are greatest in the early stages of industries where technology is of intermediate complexity – that is, where learning is rapid enough to
confer a competitive advantage, but imitation is sufficiently uncertain to deter later entry” (2010: 578). However, despite the importance of knowledge complexity or sophistication, innovation
policies should combine different technological levels and maturities in order to improve their effectiveness. If the main goal is to improve overall RIS quality, medium-technology manufacturing has a much greater impact than high-tech production because it supports the establishment of local synergies by increasing University-Industry-Government “stickiness” within a cluster or geographical unit. High-tech manufacturing, in contrast, does not provide “structure” to local knowledge environments because, apart from being small-scale, it focuses on internal, centralised and “globalised” production within multinational corporations, often taking the form of spin-offs of highly
10
specialised research institutions and involving global markets more than local human capital or knowledge sources. From an industrial organization perspective, medium-tech manufacturing can function as a seedbed for high-tech production, as it allows for maintenance of absorptive capacity, so that knowledge and technologies developed elsewhere can be better understood, more easily disseminated and adapted to local circumstances (Doloreux, 2003; Doloreux and Parto, 2005; Leydesdorff and Fritsch, 2006; Pessoa, 2010; Teixeira and Fortuna, 2010). The co-substantiated hypotheses regarding RIS configuration and its impact on economic and employment growth may become even more important when the EC’s Research and Innovation policies consist mainly of transnational research-driven clusters and KIC implementation. The Europe 2020 Growth Strategy also focuses on enhancing high-technology production to foster industry leadership rather than balancing a mix of technological features, levels and maturities, such as medium-tech manufacturing or simply improving the availability of high-tech service providers. Knowledge-intensive services are usually decoupled from local economies, but high-tech services have the potential to shape the underlying knowledge-base configuration. Despite “size” and “location” issues, if stimulated on the high-tech end, the knowledge-intensive services may also contribute to the improvement of absorptive capacity in economically peripheral areas and thus reduce asymmetries in manufacturing technologies by spreading and disseminating specialised know-how across regions (Leydesdorff and Fritsch, 2006; Teixeira and Fortuna, 2010).
Innovation gap between countries in Europe is certainly a fact. Furthermore, it is easy to spot countries that allocate more time and resources on innovation and research. The most innovative countries and regions most probably have more structured mechanisms and more strong linkages between the business sector and the regions’ institutions, providing competitiveness and efficiency to firms that are operating on specific industries. As a way to struggle this tendency, it is necessary to improve innovation capacities on the lagging regions, promoting a balanced and coherent growth between countries and regions on Europe. Landabasco, Oughton, & Morgan, (1999) affirmed that increasing on the innovation capacities “is dependent on the establishment of an efficient regional innovation system in these regions, as pre-condition for an increase of public and private investment in
11
the field of innovation”. Regional innovation paradox “refers to the apparent contradiction between the comparatively need to spend on innovation in less favoured regions and their relatively lower capacity to absorb public funds earmarked for the promotion of innovation, compared to more advanced regions.” (Landabasco, Oughton, & Morgan, 1999). According to Audretsch & Keilbach (2005) the apparent contradiction between the organizational context of knowledge inputs, particulary R&D, and the organizational context of small firm innovative outup resulted in the emergence of what has become known as the Innovation Paradox. Likewise this means that the more a region needs to stay updated in terms of innovation to compete in the market, to stay efficient and to catch up, the more difficult its efficient investment and also the capacity to absorb public aid for promoting innovation on that region.
Going deeper on the topic, aparently, the real problem is not concerning the availability of public aid for innovation on lagging regions. Rather the real problem lies not only on the quality on the regional innovation systems that a certain region holds, but also on the institutional procedures and mechanisms available to promote innovation. Landabasco, Oughton, & Morgan, (1999) stated that “ the institutional setting is less favoured regions is characterised by the absence of the right institutional framework, and policy delivery systems, public sector inefficiency and lack of understanding by policy-makers of the regional innovation process in particular”. Another problem that occur in lagging regions is that public money is spent on the creation of R&D, physical labour and infrastructures, when there is no clear demand expressed by regional firms. “Money earmarked for innovation is sometimes utilised exclusively for the creation of R&D physical infrastructures and equipment, for which no real demand has been expressed by the regional firms. Funding might fall in the hands of those responsible for research/ science or technology policies which do not have an economic development perspective (…)” (Landabasco, Oughton, & Morgan, 1999). One possible way to contribute for regional development should be by enhancing labour capital (human capital), since innovation and knowledge are dynamic and diverse. Furthermore, both are created and diffused by people. No doubt that infrastructure has an important role on developing regional growth, however when a region has an urgent necessity to “catch up” the market, probably the infrastructure solution is
12
not an efficient way. Fragmented regional economy has little or no chance to grow. Likewise this region has serious problems that are affecting its possible performance, so that, its characteristics are strangling a path for a feasible growth. Lagging regions, doesn't have connections among the subsystems available on the region; thus, there are no connection between public and private sector (co-operation mainly) (Landabasco, Oughton, & Morgan, 1999). Universities have a crucial role on forming human capital, which are a vital input on creating regional economy, however they are not “formally” linked with business sector. There is a lack of technological intermediaries capable to identify local business demand, which, therefore may contribute to the difficulty of channelling it to regional/national and international sources of innovation (Landabasco, Oughton, & Morgan, 1999). Regional government and business sector are not linked, which deteriorate even more the possibilities to innovate. It is crucial to have a partnership between government and the business sector on the topic of public funding but specifically on creating regional development policies. It is clear that this type of less developed regions have more difficult to diffuse their knowledge to the national and international level. Therefore the potential impact of the region is diminished by its conditions and characteristics. Hence, the concept of learning is clearly defined in our minds, so that, the main difference between learning regions and less developed regions, is due to its capacity of learning with the interaction of all the subsystems within any region. Learning regions have their innovation subsystems connected, enhancing their capacity to create and diffuse knowledge, ultimately to grow. Also regional governance occupies a central and decisive role on connecting all the subsystems in a way to increase the quality of knowledge transfer between them. Therefore all regional actors participate in the economy of the region, heightening the probabilities of producing impact on national and international level. As Landabasco, Oughton, & Morgan, (1999) stated: “ A learning region is not a parochial region, which ignores the importance of national and international dimensions, particularly in the fields of science, research and technology over and above a narrowly defined concept of innovation as such”. Opportunities for growth are available in all type of regions, the extent in which, regions cannot do it, its because their structures and their regional actors are not performing well. On the other hand, human capital is a key factor for regional development, besides, the interaction between the regional actors with different knowledge would permit the transfer of different education and new ways of
13
dealing with different problems. Notice that local governments have an important role, mainly, in developing regional policies and trying to maximize the productivity of all different subsystems. OECD (2011) defined a usual set of guidelines for multi level of governance. Those set of guidelines “include combining investments in physical infrastructure with the provision of soft infrastructures; improving the co-ordination and implementation of investment strategies across levels of government, by using policy conditionality in transfer agreements or partnerships between levels of government to achieve common objectives; enhancing horizontal co- ordination within functional regions; building transparent management processes; bridging information gaps across public actors; and enhancing data and performance indicator availability trough robust risk management”.
3. Formulation of the dataset and methodology
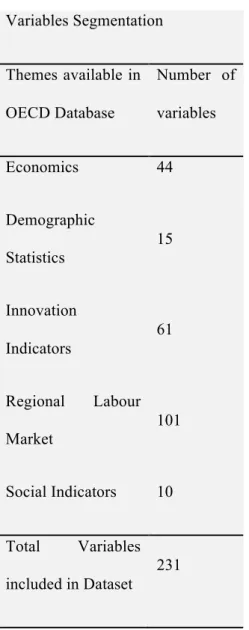
We have chosen the OECD Regional Statistics Database, comprising a total of 231 regionally standardised variables, as our initial dataset. The geographical scope selected for analysis is the OECD Territorial Level II (TL II). The sample, selected from a dataset of 396 regions across 34 OECD countries, consists of 158 regions that form parts of 18 European countries. The sample includes all European countries with data available in the OECD Regional Statistics Database. We considered only European countries1 because their Regional Innovation Systems (RIS) are not comparable, for example, with North-American ones (Cooke, 2001), as shown by the emergence of the so-called European Paradox (Audretsch et al., 2012; Ejermo et al., 2011).
14
Table 1 Themes available on OECD Regional Statistics Database
Variables Segmentation Themes available in OECD Database Number of variables Economics 44 Demographic Statistics 15 Innovation Indicators 61 Regional Labour Market 101 Social Indicators 10 Total Variables included in Dataset 231
Source: Own preparation and OECD Regional Statistics Database
On the other hand, the regional variables were collected over the period from 1998 to 2008 to maximise the fit of the series to the available data. The regions included in the sample are only a portion of all of the regions included in the OECD Regional Statistics Database for Territorial Level II (TL II) because only series that have reasonable numbers of original values were considered for inclusion. This procedure is justified by the need to obtain yearly variation-rates to estimate an unbiased geometrical average for each region over the studied period. In this sense, the time span was also chosen to take into account fit with the original information available to maximise the use of unprocessed data. The remaining missing values were filled in, using various methodologies,
15
depending on the nature of the missing data: (1) Single intermediate values were calculated using the arithmetical mean of the two nearest years; (2) Whenever the data were missing a sequence of two or more values in the middle years, we estimated the yearly variation-rate by matching the previous and subsequent existent values, thus filling the “gap”; (3) If a missing value fell near the beginning or end of the series, a geometrical average of the variation-rates between the available value sequences was applied. Because values were missing for all studied variables, we applied these procedures for each of the 231 variables available in the OECD Regional Statistics Database.
Table 2 European Countries covered: Territorial Level and Number of Regions
European countries covered Territorial Level Number of Regions Austria Level II OECD 7 Belgium Level II OECD 3 Czech Republic Level II OECD 8 Finland Level II OECD 4 France Level II OECD 21 Germany Level II OECD 16
16 Greece Level II OECD 4 Hungary Level II OECD 7 Ireland Level II OECD 2 Italy Level II OECD 21 Nederland Level II OECD 4 Norway Level II OECD 7 Poland Level II OECD 9 Portugal Level II OECD 4 Slovakia Level II OECD 4 Spain Level II OECD 17 Sweden Level II OECD 8
17 United Kingdom Level II OECD 12 Total number of regions 158
Source: Own preparation and OECD Regional Statistics Database
After data collection and missing values estimation procedures were complete, we calculated the yearly variation-rates and the corresponding geometrical averages for each region over the ten-year time span.
To test our first hypothesis that it is possible to identify a clear set of composite dimensions that constitute the input layer of RIS, we applied Factor Analysis. This statistical method enables one to define the underlying structure of a data matrix, thus reducing the original large group of variables to a relatively small number of factors while maintaining the explanatory power of the original dataset. In addition, extracted factors are less sensitive to potential data recording errors than single variables are because the bias is dispersed by the full set of original variables represented by each factor. The assumptions of normality, homoscedasticity and linearity are not required (i.e. or can be applied in a less restrictive manner) under this methodology. Indeed, multicollinearity, which causes serious difficulties in other types of statistical analysis, in this case is desirable, given that the main goal is to identify sets of interrelated variables. Whenever clearly differentiated subgroups of variables emerge where, on the one hand, within each subgroup, variables are highly interrelated, while on the other hand, variables of different subgroups show no significant relationships at all, the original group of indicators can be reduced to several factors. The latter will summarise the information held in common by groups of several variables included in each factor (Buesa et al., 2010; Pestana and Gageiro, 2008).
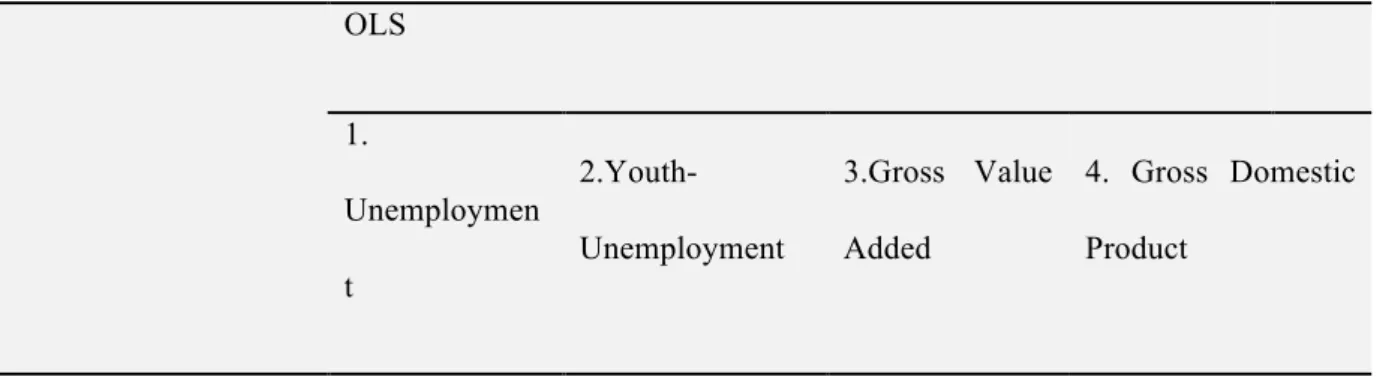
To check our second hypothesis, regarding the identification of mediatory variables and the measurement of their latent effects on the attainment of measurable outcomes at a macro-economic level, we applied the Ordinary Least Squares (OLS) regression. Before computing the OLS regression,
18
the RIS components generated through Factor Analysis are assumed to be Independent or Input variables, while Unemployment, Youth-Unemployment, Gross Value Added (GVA) and Gross Domestic Product (GDP) are designated as Dependent or Output variables.
Unemployment (1), Youth-Unemployment (2), GVA (3) and GDP (4) = const. + β1Corporate R&D + β2Market Potential + β3Demand Sophistication + β4 Governmental R&D Investment + β5Technological Capacity + β6Knowledge Intensity + β7 University R&D Employment + β8Governmental R&D Employment + ε
4. Core-dimensions of RIS
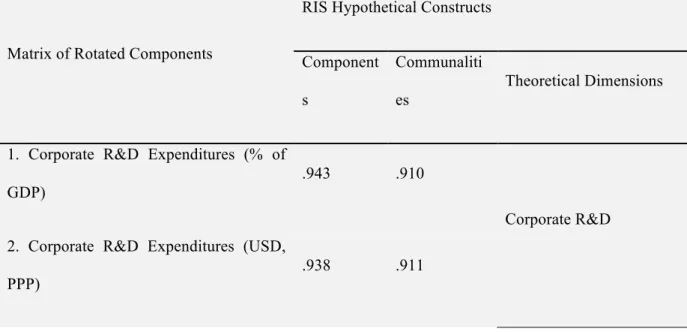
Using Factor Analysis, the original dataset of 231 variables was reduced, through a process of trial-and-error, to only 25 variables, generating 8 factors or underlying dimensions that are linear combinations of the original variables. These factors better reflect the core components of the RIS than each of the individual variables could independently, as they not only group together all related variables but also reflect interactions between factors, as the model correlates each variable to all factors, not just the one in which it is included.
Table 3 Hypothetical Components: Components, Communalities and Theoretical Dimensions
Matrix of Rotated Components
RIS Hypothetical Constructs
Component s
Communaliti es
Theoretical Dimensions
1. Corporate R&D Expenditures (% of GDP)
.943 .910
Corporate R&D 2. Corporate R&D Expenditures (USD,
PPP)
19
3. Corporate R&D Employment (Number)
.895 .834
4. Corporate R&D Employment (% of
total employment) .820 .727*
5. Corporate R&D Expenditures (USD) .815 .689*
6. Population (Number) .920 .911
Market Potential 7. Density (Persons per square kilometre) .914 .909
8. Labour Force (Number) .914 .926
9. Employment (Number) .847 .839
10. GDP per worker (USD) .914 .899
Demand Sophistication
11. GDP per Capita (USD) .907 .870
12. Primary Income per Household (USD)
.890 .908
13. Disposable Income per Household (USD)
.759 .791
14. Governmental R&D Expenditures (% GDP)
.960 .955
Governmental R&D Investment
15. Governmental R&D Expenditures (USD, PPP)
.957 .988
16. Governmental R&D Expenditures (USD)
20
17. High and Medium Technology Employment (% total employment)
.947 .945
Technological Capacity 18. High and Medium Technology
Employment (Headcount)
.936 .927
19. High and Medium Technology Manufacturing (% total manufacturing)
.910 .840
20. Knowledge Intensive Services Employment (% of total employment)
.908 .879
Knowledge Intensity 21. Knowledge Intensive Services (%
total services)
.905 .884
22. University R&D Employment (% total employment)
.897 .890
University R&D Employment
23. University R&D Employment
(Number) .726 .720*
24. Governmental R&D Employment (% total employment)
.804 .806
Governmental R&D Employment
25. Governmental R&D Employment (Number)
.745 .790
Source: Own Preparation. Asterisks* indicate communalities that are less than 0.750.
The communalities (i.e., the correlations of each variable with each of the other variables composing the factor) of the variables are relatively high, most above 0.7502, which indicates a high degree of
2 The only exceptions are Corporate R&D Employment (% of total employment), with 0.727; University R&D Employment (Number), with 0.720 and Corporate R&D Expenditures (USD), with 0.689.
21
preservation of variance, ensuring reliability of the findings. Moreover, the 8 factors retain nearly 87 per cent of the original variance, leaving just a 13 per cent loss of information contained in the original dataset. Another important dimension by which to assess the outcome of a Factor Analysis is
qualitative validation (Manso and Simões, 2009). Here, we take into account two important principles: (1) Parsimony: Factor Analysis aims to explain correlations among an original set of variables with as
few factors as possible while retaining most of the variability in the initial dataset in order to make
theoretical constructs more interpretable, measurable and operational for policy purposes;
(2) Interpretability: Factor Analysis should be used only if the outcomes cohere with the theoretical background and with previous empirical findings within the respective research domains or complementary fields, thus generating clear but consistent “interpretability gains”.
The 25 original variables were integrated into 8 composite dimensions, significantly improving the “interpretability” of the RIS construct, with only a 13 per cent variability loss. That is, the extracted factors are not only consistent but also interpretable in terms of the theoretical framework of the research field, in this case, that of Regional Innovation Systems (RIS). Interrelated variables belong to the same “subsystems” of the overall RIS in which variables belonging to a certain structural component are located just within that factor. Therefore, each factor can be labelled by a “name” that expresses the nature of the set of variables that compose it. Following Pestana and Gageiro (2008), we selected Factor Analysis by Principal Components with VARIMAX rotation and KAISER normalization, as this approach allows us to extract more interpretable factors and, in addition, has other statistical advantages such as predetermination of the angles between axes. Factorial patterns obtained through this specific rotation procedure tend to be more robust than those obtained using alternative methods, assuring maximum orthogonality between factors, which is important for the statistical analyses below.
5. Macro-economical outcomes of RIS
The first model suggests that Technological Capacity (-0.650) and University R&D Employment (-0.415) reduce Unemployment. However, other RIS components, namely, Knowledge
22
Intensity (+0.436) and Market Potential (+0.424), appear to increase Unemployment. The overall RIS structure exerts a statistically significant effect (ρ-value of 0.038) and explains 10.2% of Unemployment variance (R2 of 0.102). The results from the second model suggest that the level of Demand Sophistication (-1.219), University R&D Employment (-1.195) and Governmental R&D Employment (-0.564) have an important role in reducing Youth-Unemployment. The regression model is significant (ρ-value of 0.000), and 18.7% of Youth-Unemployment variance is explained by the overall RIS (R2 of 0.187). It is important to note that the RIS configuration does not have any downside in terms of Youth-Unemployment. In the third regression model, it was found that Demand Sophistication (+1.039), Market Potential (+0.599), Governmental R&D Investment (+0.167), Technological Capacity (+0.132) and Corporate R&D (+0.095) have positive effects on Gross Value Added (GVA) but that Governmental R&D Employment (-0.101) has a negative influence on GVA. The regression model is statistically significant (ρ-value of 0.000), with the RIS model responsible for 87.8% of GVA variability (R² of 0.878). The fourth model estimation shows that Demand Sophistication (+1.257), Market Potential (+0.601), Governmental R&D Investment (+0.145), Knowledge Intensity (+0.093) and Corporate R&D (+0.081) have positive effects on Gross Domestic Product (GDP), although the effort to increase Governmental R&D Employment appears to “consume” (-0.088) some of the wealth generated. The estimation is significant (ρ-value of 0.000) and explains 91.8% of GDP variance (R² of 0.918).
Table 4 Estimation Results. Endogenous Variables: Unemployment (1), Youth-Unemployment (2), GVA (3)
and GDP (4) OLS 1. Unemploymen t 2.Youth-Unemployment 3.Gross Value Added 4. Gross Domestic Product
23 Corporate R&D 0.200 (0.430) -0.073 (0.829) 0.095 (0.013)*** 0.081 (0.020)*** Market Potential 0.424 (0.094)* 0.293 (0.387) 0.599 (0.000)*** 0.601 (0.000)*** Demand Sophistication -0.136 (0.592) -1.219 (0.000)*** 1.039 (0.000)*** 1.257 (0.000)*** Governmental R&D Investment 0.013 (0.960) 0.520 (0.125) 0.167 (0.000)*** 0.145 (0.000)*** Technological Capacity -0.650 (0.011)** -0.367 (0.278) 0.132 (0.001)*** 0.010 (0.767) Knowledge Intensity 0.436 (0.046)** 0.414 (0.221) -0.038 (0.308) 0.093 (0.007)*** University R&D Employment -0.415 (0.043)** -1.195 (0.001)*** 0.011 (0.778) -0.053 (0.128) Governmental R&D Employment -0.228 (0.367) -0.564 (0.097)* -0.101 (0.008)*** -0.088 (0.011)*** Constant 96.500 (0.000)*** 98.607 (0.000)*** 105.337 (0.000)*** 105.430 (0.000)*** F test 2.115 (0.038)** 4.289 (0.000)*** 134.382 (0.000)*** 209.297 (0.000)*** R2 0.102 0.187 0.878 0.918
24
Source: Own preparation. In brackets the p-value. In italics are the non-significant coefficients to 90%. The asterisks *, ** and *** indicate significance at the 10%, 5% and 1% level, respectively. The data includes 158 European regions from OECD Regional Statistics Database.
6. Discussion and policy implications
This study provides empirical evidence that innovation could be managed effectively at the regional level, due the localised nature of knowledge spillovers, absorptive capacity, technological transference, manufacturing set-up and new business formation. It is possible to identify the “subsystems” that shape the overall RIS and that could be generalised to all European regions, despite the differences and idiosyncrasies of the different regions. Surprisingly, the relationships between RIS core-dimensions and the attainment of measurable outcomes at the macroeconomic level show that Governmental R&D Investment does not have any statistically significant impact on Unemployment or Youth-Unemployment. Increasing Governmental R&D Investment contributes to a higher GVA and GDP but is far from being a “panacea” for stagnant growth, due to the relatively small weight of its effects. Although Governmental R&D Investment is a necessary condition for sustainable development (Carlsson et al., 2007; Ejermo et al., 2011), it is not the most important factor in seeking to stimulate economic growth, at least in the context of developed European economies. Governmental R&D Investment has less impact than Demand Sophistication or Market Potential either on GVA or GDP3. This means that RIS effectiveness in translating R&D investment into economic growth depends on creation of the necessary conditions for maintaining or increasing the consumption of goods and services at the regional level. That is, regions should have the levels of income needed to absorb and leverage the growth and the technological development of local supply. Demand Sophistication affects the ability of a given region to grow or increase its Market Potential by attracting skilled, qualified, creative and productive human capital that can develop, design and produce more and better products or services at competitive prices. In this sense, the results are
3 Increasing R&D Investments, either public or private, is not sufficient to enhance economic growth. Specific market factors are crucial in shaping the R&D-growth link, and an innovation policy that only relies on increasing R&D outlays is ineffective in increasing economic growth (Pessoa, 2010).
25
congruent with previous findings of Acs et al. (2008); Gilbert et al. (2008), Norman (2002), Pe’er and Vertinsky (2008), Pires (2005) and Teixeira and Fortuna (2010), suggesting that Market Potential has
a double-role4:
(1) Assuring demand: generating economies of scale that can assure the necessary levels of demand for the products and services produced, assembled, distributed or sold within regional boundaries to achieve attractive levels of remuneration for productive factors (i.e., capital and labour), stimulating
FDI and formation of a medium-technology manufacturing base;
(2) Building “critical mass”: increasing the availability of qualified human capital – embodied in Technological Capacity and Knowledge Intensity – tends to improve companies’ absorptive capacity, productivity, rates of growth, technological sophistication and fit with market needs, leading to higher value-added and thus enhanced competitiveness.
Regional market size and income growth encourage firms to move away from centralised operations and adopt multi-location strategies, leading to increased FDI and the establishment of medium-technology manufacturing (Harhoff, 2000; Leydesdorff and Fritsch, 2006). The critical importance of Market Potential and Demand Sophistication demonstrates the need to manage innovation in an integrated way rather than focusing narrowly on increasing R&D expenditures. For instance, factors that are value-drivers in terms of wealth-creation can at the same time reduce welfare, and vice versa. This is demonstrated by the particular cases of Knowledge Intensity and Governmental R&D Employment. A higher availability of knowledge-intensive services within a given region creates an incentive for companies to outsource in order to replace regular employment. Given the presence of economies of scale and the mobility of service providers within regional boundaries, firms tend to increase their outsourcing, generating additional Unemployment (Friedman, 2005). Knowledge-intensive services are also decoupled from the configuration of the regional economy, and headquarters locations of service providers are more strongly influenced by geographical and logistic factors than by specific RIS characteristics (Leydesdorff and Fritsch, 2006). However, replacing
4 The findings are also congruent with traditional NEG (New Economic Geography) models (e.g., Krugman, 1991; Pires, 2005).
26
core regular employment by specialised service providers allows companies to reduce overall costs and to improve their competitiveness by converting structural costs into variable ones (Piore and Sabel, 1984). In this way, Knowledge Intensity contributes to price flexibility and to firms’ abilities to cope with competitive market environments, generating more sales and leading to slightly higher GDP growth rates. On the other hand, Governmental R&D Employment can have the opposite effects. While it is important in reducing Youth-Unemployment, it also has a negative effect on competitiveness, as seen in GVA and GDP series. It is precisely these differential effects of specific RIS “subsystems” that make it difficult to operationalise for policy purposes, as noted by Uyarra (2010: 116).
Despite the negative side-effects of Governmental R&D Employment on both GVA and GDP, University R&D Employment appears to have a quite important role in reducing Unemployment, especially Youth-Unemployment, while it also does not have a downside in terms of economic growth. This means that replacing Governmental R&D Employment with University R&D Employment can, up to a point, be an effective way to promote both employment and youth-employment by strengthening innovation while avoiding inefficient consumption of public resources. R&D outlays of regional universities are typically measurable and competitive. In addition, they can be benchmarked internationally in terms of scientific outcomes, absorptive capacity enhancement, productivity incorporation and technological transference. Hence, such outlays have a tangible impact on value-added and on the competitiveness of the regional economic capacity. Although some subsystems (i.e., Knowledge Intensity and Market Potential) contribute to additional Unemployment, it is important to note that none of the RIS core-components has a downside in terms of Youth-Unemployment. If balanced with other policies and accounting for the specific trade-offs of each subsystem, the overall RIS quality improvement appears to be among several possible means of simulating additional youth-employment, despite the various ways in which they lead to increased Unemployment. On the other hand, Governmental R&D Investment and Technological Capacity enhancing policies appear to positively affect GVA growth, showing that managing innovation at the regional level can be used to increase wealth in an effective and measurable way. The role of Technological Capacity in
27
GVA growth is congruent with previous findings of Auerswald (2010) that the development of higher technology, embodied in more complex production and in less replicable technologies and products, whenever fitting market needs (Adner and Levinthal, 2001) and matching firms’ absorptive capacity (Harhoff, 2000; Teixeira and Fortuna, 2010), allows for higher prices and thus higher profit margins without decreasing demand levels (Wersching, 2010). Technological Capacity enhancement is the most effective instrument for reducing Unemployment and is a policy without any downside regarding sustainable economical development. It was also found that Governmental R&D Investment and Knowledge Intensity have significant positive effects on GDP, and according to the insights of Friedman (2005), Norman (2002), Piore & Sabel (1984) and Zenger (1994), scale-up of knowledge
intensive services generates competitiveness gains and business volume growth through: (1) Increased flexibility: conversion of structural costs to variable costs, improving companies’
abilities to cope with demand volatility; (2) Improved competitiveness: production management and optimization supported by
knowledge-intensive services allows companies to reduce prices without undermining profitability and improve strategies for coping with bullish markets and dynamic pricing competition. Although Knowledge Intensity slightly enhances GDP growth, it also generates increased Unemployment because it incentivises outsourcing, inducing the replacement of regular employment by external service providers. In this case, the creation of additional Unemployment is much more pronounced than the contribution of Knowledge Intensity to GDP growth, highlighting the need to considerer the specific trade-offs of each policy. Corporate R&D also contributes to creation of the necessary conditions for achieving increased economic growth (Audretsch, 1995; Eckhardt and Shane, 2011; Harhoff, 2000; Huynh and Petrunia, 2010), as appears to be reflected in both GVA and GDP growth rates. According to the literature, increased R&D intensity of firms improves their access to financial resources, regardless of the sizes of such firms (Audretsch and Weigand, 2005), improving the environment for growth within regional clusters (Gilbert et al., 2008). However, despite its small positive effects on economic growth, Corporate R&D is not associated with additional employment or youth-employment gains. The results suggest that the RIS core-dimensions can be used effectively, both for improving welfare and for achieving higher economic growth, if they are measured, planned and implemented in
28
an integrated way. However, the RIS subsystems are not homogenous, and some of them have significant negative side-effects, such as generating Unemployment or slowing economic growth. Increasing Governmental R&D Investment could positively contribute to economic growth, but simply increasing R&D expenditures may be ineffective if not combined with Demand Sophistication and Market Potential policies. It is worth noting that Government R&D Investment does not have a statistically significant impact on employment, indicating the need to assess the trade-offs of policies that could lead to significant increases in government expenditure. Surprisingly, Governmental R&D Employment does not contribute to mass-market employment, despite its quite important role in reducing Youth-Unemployment. At the same time, Governmental R&D Employment appears to be a quite inefficient policy because it consumes excessive financial resources, thereby undermining economic growth, as seen in its negative effects on GVA and GDP. Translating R&D outlays into employment and economic growth does not follow a simple “input-output” logic. Increasing the scale of R&D investment, either public or private, is a necessary condition for sustainable development, but it must be combined with other policy measures to be effective. In terms of wider policy implications, the results reinforce the idea that European Commission Research and Innovation policies must be restructured, shifting from a transnational framework to a more localised, measurable, operational and goal-oriented approach. The emergence of the so-called “European Paradox” shows that R&D investment is not maximally effective and that increasing the scale of public R&D expenditures is not sufficient to generate employment and sustained economic growth. That is, “throwing money at the problem” policies are neither efficient nor effective solutions. The RIS approach may thus be a valid alternative, as it appears to improve regions’ abilities to exploit their differential competitive advantages to overcome the effects of unfavourable input endowments, spatial locations or levels of knowledge base maturity.
29
References
Acs, Z., Bosma, N., and Sternberg, R. (2008) The entrepreneurial advantage of world cities: Evidence from Global Entrepreneurship Monitor (GEM). Friedrich-Schiller University and the Max-Planck-Institute of Economics online paper 22 August, available at: zs.thulb.uni-jena.de/receive/jportal_jparticle_00106353.
Acs, Z., Braunerhjelm, P., Audretsch, D., and Carlsson, B. (2009) The Knowledge Spillover Theory of Entrepreneurship. Small Business Economics 32(1): 15–30.
Adner, R. and Levinthal, D. (2001) Demand heterogeneity and technology evolution: Implications for product and process innovation. Management Science 47(5): 611–618.
Agarwal, R. (1998) Evolutionary trends of industry variables. International Journal of Industrial Organization 16(4): 511–525.
Agarwal, R. and Gort, M. (2002) Firm and product life cycles and firm survival. The American Economic Review 92(2): 184–190.
Aldridge, T. and Audretsch, D. (2011) The Bayh-Dole Act and scientist entrepreneurship. Research Policy 40(8): 1058–1067.
Arundel, A., & Geuna, A. (2004). Proximity and the use of public science by innovative european firms . Economics of Innovation and New Technologies, 13 , 559 -580 .
Asheim, B. and Coenen, L. (2005) Knowledge bases and regional innovation systems: Comparing Nordic clusters. Research Policy 34(8): 1173–1190.
Audretsch, D. (1995) Innovation, growth and survival. International Journal of Industrial Organization 13(4): 441–457.
Audretsch, D. and Feldman, M. (1996) R&D spillovers and the geography of innovation and production. The American Economic Review 86(3): 630–640.
30
Audretsch, D. and Keilbach, M. (2004) Entrepreneurship and regional growth: An evolutionary interpretation. Journal of Evolutionary Economics 14(5): 605–616.
Audretsch, D. B., & Keilbach, M. (2005) The Knowledge Spillover Theory of Entrepreneurship and Economic Growth. Max Planck Institute of Economics .
Audretsch, D. and Keilbach, M. (2008) Resolving the knowledge paradox: Knowledge-spillover
entrepreneurship and economic growth. Research Policy 37(10): 1697–1705
Audretsch, D. and Lehmann, E. (2005a) Do university policies make a difference? Research Policy 34(3): 343–347.
Audretsch, D. and Lehmann, E. (2005b) Does the Knowledge Spillover Theory of Entrepreneurship hold for regions? Research Policy 34(8): 1191–1202.
Audretsch, D. and Thurik, R. (2001a) Linking entrepreneurship to growth. Organisation for Economic Co-operation and Development (OECD) working paper 9 May, doi: 10.1787/736170038056.
Audretsch, D. and Thurik, R. (2001b) What is new about the new economy? Sources of growth in the
managed and entrepreneurial economies. Industrial and Corporate Change 10(1): 267–315.
Audretsch, D. and Weigand, J. (2005) Do knowledge conditions make a difference? Investment,
finance and ownership in German industries. Research Policy 34(5): 595–613.
Audretsch, D., Carree, M., Van Stel, A., and Thurik, R. (2000) Impeded industrial restructuring: The growth penalty. Tinbergen Institute Discussion Papers 95(3) October, available at: papers.tinbergen.nl/00095.pdf.
Audretsch, D., Grilo, I., and Thurik, A. (2012) Globalization, entrepreneurship and the region. EIM Business and Policy Research January, available at: www.entrepreneurship-sme.eu/pdf-ez/H201201.pdf.
Audretsch, D., Lehmann, E., and Warning, S. (2005) University spillovers and new firm location.
31
Auerswald, P. (2010) Entry and Schumpeterian profits: How technological complexity affects industry
evolution. Journal of Evolutionary Economics 20(4): 553–582.
Baumol, W. (2004) Entrepreneurial enterprises, large established firms and other components of the
free-market growth machine. Small Business Economics 23(1): 9–21.
Bejou, D., Wray, B., and Ingram, T. (1996) Determinants of relationship quality: An artificial neural network analysis. Journal of Business Research 36(2): 137–143
Breznitz, D. and Zehavi, A. (2010) The limits of capital: Transcending the public financer-private producer split in industrial R&D. Research Policy 39(2): 301–312.
Brown, J. and Petersen, B. (2010) Public entrants, public equity finance and creative destruction.
Journal of Banking and Finance 34(5): 1077–1088. Buesa, M., Heijs, J., and Baumert, T. (2010) The determinants of regional innovation in Europe: A
combined factorial and regression knowledge production function approach. Research Policy 39(6): 722–735.
Caragliu, A. and Bo, C. (2011) Determinants of spatial knowledge spillovers in Italian provinces.
Socio-Economic Planning Sciences 45(1): 28–37. Carlsson, B. (1989) Industrial Dynamics: Technological, Organizational and Structural Changes in
Industries and Firms. Boston, MA: Wolters Kluwer.
Carlsson, B., Acs, Z., Audretsch, D., and Braunerhjelm, P. (2007) The knowledge filter, entrepreneurship and economic growth. KTH Royal Institute of Technology October, available at: www.infra.kth.se/cesis/documents/WP104.pdf.
Choudhary, M. and Gabriel, V. (2009) Is there really a gap between aggregate productivity and technology? Applied Economics 41(27): 3499–3503.
Ciftci, M. and Cready, W. (2011) Scale effects of R&D as reflected in earnings and returns. Journal of Accounting and Economics 52(1): 62–80.
32
Cooke, P. (2001) Regional innovation systems, clusters, and the knowledge economy. Industrial and Corporate Change 10(4): 945–974.
David, P. and Foray, D. (2002) An introduction to the economy of the knowledge society. International Social Science Journal 54(171): 9– 23.
Dinlersoz, E. and MacDonald, G. (2009) The industry life cycle of the size distribution of firms. Review of Economic Dynamics 12(4): 648–667.
Doloreux, D. (2003) Regional innovation systems in the periphery: The case of the Beauce in Québec
(Canada). International Journal of Innovation Management 7(1): 67–94.
Doloreux, D. and Parto, S. (2005) Regional innovation systems: Current discourse and unresolved
issues. Technology in Society 27(2): 133–153.
Eckhardt, J. and Shane, S. (2011) Industry changes in technology and complementary assets and the creation of high-growth firms. Journal of Business Venturing 26(4): 412–430.
Eckhardt, J., Shane, S., and Delmar, F. (2006) Multistage selection and the financing of new ventures. Management Science 52(2): 220–232.
Ejermo, O., Kander, A., and Henning, M. (2011) The R&D-growth paradox arises in fast-growing sectors. Research Policy 40(5): 664–672.
European Commission (2011) Horizon 2020 - The Framework Programme for Research and Innovation. Communication from the Commission to the European Parliament, the Council, the European Economic and Social Committee and the Committee of the Regions 30 November, available at: http://ec.europa.eu/research/horizon2020/pdf/proposals/communication_from_the_commission_-
33
European Commission (2012a) Regions of knowledge. Capacities work programme 2012-2013 17 December, available at: http://ec.europa.eu/research/participants/data/ref/fp7/154042/q-wp-201302_en.pdf.
European Commission (2012b) Research potential. Capacities Work Programme 2012-2013 17 December, available at: http://ec.europa.eu/research/participants/data/ref/fp7/154048/r-wp-201302_en.pdf.
Eurostat (2013a) Gross Domestic Expenditure on R&D (GERD) by source of funds: Government
sector, available at:
http://epp.eurostat.ec.europa.eu/tgm/refreshTableAction.do?tab=table&plugin=1&pcode=tsc00031&la nguage=en.
Eurostat (2013b) Gross Domestic Expenditure on R&D (GERD) by source of funds: Higher education
sector, available at:
http://epp.eurostat.ec.europa.eu/tgm/refreshTableAction.do?tab=table&plugin=1&pcode=tsc00031&la nguage=en.
Eurostat (2013c) Research and development expenditure by sectors of performance: All sectors,
available at:
http://epp.eurostat.ec.europa.eu/tgm/table.do?tab=table&init=1&language=en&pcode=tsc00001&plug in=1.
Fagerberg, J., Landström, H., and Martin, B. (2012) Exploring the emerging knowledge base of the knowledge society. Research Policy 41(7): 1121–1131.
Feldman , M. P. (1994). Knowledge Complementarity and Innovation. Small Business Economics, 6 , 363 - 372.
Friedman, T. (2005) The World Is Flat: A Brief History of the Twenty-First Century. New York, NY: Farrar, Straus and Giroux.
34
Fritsch, M., & Schwirten, C. (1999). Enterprise - university co operation and the role of public
research institutions in regional innovation systems. Industry and Innovation 6 , 69-83.
Fritsch, M. (2008) How does new business formation affect regional development? Introduction to the special issue. Small Business Economics 30(1): 1–14.
Furman, J. and Hayes, R. (2004) Catching up or standing still? National innovative productivity among follower countries. Research Policy 33(9): 1329–1354.
George, D. and Mallery, P. (2003) SPSS for Windows Step by Step: A Simple Guide and Reference. Boston, MA: Allyn & Bacon.
Gertler, M. S. (2001). Tacit Knowledge and the Economic Geography of context, or the Undefinable Tacitness of being (there). Department of Geography and Program on Globalization and Regional Innovation Systems Centre for International Studies University of Toronto.
Gilbert, B., McDougall, P., and Audretsch, D. (2008) Clusters, knowledge spillovers and new venture performance: An empirical examination. Journal of Business Venturing 23(4): 405–422.
Grootaert , C., & Van Bastelaer , T. (2001). Understanding and Measuring Social Capital: A Synthesis of Findings and Recommendations from the Social Capital Initiative. Washington: The World Bank. Harhoff, D. (2000) R&D spillovers, technological proximity, and productivity growth: Evidence from German panel data. Schmalenbach Business Review 52(3): 238–260.
Hauser, C., Tappeiner, G., & Walde, J. (2007). The Learning Region: The Impact of Social Capital and Weak Ties on Innnovation. Regional Studies, 41 , 75-88.
Hewitt-Dundas, N. and Roper, S. (2011) Creating advantage in peripheral regions: The role of publicly funded R&D centres. Research Policy 40(6): 832–841.
Huynh, K. and Petrunia, R. (2010) Age effects, leverage and firm growth. Journal of Economic Dynamics and Control 34(5): 1003–1013.