Survival patterns of Dekkera bruxellensis in wines and inhibitory
effect of sulphur dioxide
A. Barata, J. Caldeira, R. Botelheiro, D. Pagliara, M. Malfeito-Ferreira
⁎
, V. Loureiro
Laboratório de Microbiologia, Departamento de Botânica e Engenharia Biológica, Instituto Superior de Agronomia, Technical University of Lisbon, 1349-017 Lisboa, Portugal
Received 23 February 2007; received in revised form 1 October 2007; accepted 6 November 2007
Abstract
The wine spoilage yeast species Dekkera bruxellensis, after inoculation in red wines, displayed three survival patterns characterized by: i) initial lag phase followed by growth and sequential death; ii) initial death phase leading to reduced viable counts followed by growth and sequential death; and iii) death phase leading to complete loss of viability. These survival patterns were observed for the same strain in different dry red wine blends with 12% (v/v) ethanol and pH 3.50, in the absence of free sulphur dioxide. For the same wine blend, these patterns also varied with the tested strain.
Under laboratory conditions the addition of 150 mg/l of potassium metabisulphite (PMB) to dry red wine with 12% (v/v) ethanol and pH 3.50 reduced initial cell counts by more than 6 logarithmic cycles, inducing full death within less than 24 h. Winery trials showed that D. bruxellensis blooms were only prevented in the presence of about 40 mg/l of free sulphur dioxide in dry red wine, with 13.8% (v/v) ethanol and pH 3.42, matured in oak barrels. These different amounts of PMB and sulphur dioxide corresponded to about 1 mg/l of molecular sulphur dioxide. Our results therefore demonstrate that the control of populations of D. bruxellensis growing in red wine can only be achieved under the presence of relatively high doses of molecular sulphur dioxide.
© 2007 Elsevier B.V. All rights reserved.
Keywords: Dekkera/Brettanomyces bruxellensis; Sulphur dioxide; Cell death; Wine; Spoilage yeasts; Oak barrels
1. Introduction
The yeasts of the species Dekkera bruxellensis, or its ana-morph Brettanomyces bruxellensis, are responsible for serious economic losses in the wine industry owing to their ability to spoil wines by the production of ethylphenols (Loureiro and Malfeito-Ferreira, 2006). During the last decade these yeasts have been increasingly studied by many research teams aiming to understand their spoiling abilities and to establish control measures (Suárez et al., 2007). Despite this interest there are still issues which are not clearly understood, such as the real effect of preservatives on the inactivation of D. bruxellensis populations in wines. The main preservative used in the wine industry is sulphur dioxide (Ribéreau-Gayon et al., 2006)
but reports about its effect on D. bruxellensis inactivation are often contradictory. This yeast is recovered mainly from wines not protected by sulphur dioxide (Heresztyn, 1986) and some authors refer its sensitivity to values higher than 30 mg/l (Gerbaux et al., 2002; Chatonnet et al., 1992, 1993). Others state that it should be regarded as resistant (Van der Walt and van der Kerken, 1961; Gaia, 1987; Ciolfi, 1991) and growth has been reported under more than 30 mg/l of free sulphur dioxide (Froudière and Larue, 1989). This controversy probably arises from the lack of studies under comparable situations and strain behaviour variability. Despite this controversy, in Australian wines levels of free sulphur dioxide have increased in the last years probably because of the adoption of stricter measures to control Dekkera/Brettanomyces (Godden and Gishen, 2005). These authors established a possible link between this fact and the decrease in wine’s mean 4-ethylphenol concentra-tions observed during the 1996–2002 period. We have shown
International Journal of Food Microbiology 121 (2008) 201–207
www.elsevier.com/locate/ijfoodmicro
⁎ Corresponding author. Tel.: +351 213653448; fax: +351 213653238. E-mail address:[email protected](M. Malfeito-Ferreira). 0168-1605/$ - see front matter © 2007 Elsevier B.V. All rights reserved. doi:10.1016/j.ijfoodmicro.2007.11.020
that 4-ethylphenol is not produced in the absence of growing D. bruxellensis populations (Dias et al., 2003) and so their inactivation results in the lack of 4-ethylphenol production. The present work was therefore aimed at establishing the growth behaviour of D. bruxellensis in wines and evaluating the effect of sulphur dioxide on the viability of a wide range of strains. The conditions used were intended to mimic winery practice in order to establish technological measures to control its activity. 2. Materials and methods
2.1. Yeast strains and maintenance conditions
The strains of D. bruxellensis tested were either obtained from culture collections or isolated from wine-related environ-ments by our laboratory (Table 1). The Dekkera spp. strains were maintained in slants of GYP medium (20 g/l glucose (Merck, Darmstadt, Germany), 5 g/l yeast extract (Difco Laboratories, Detroit, USA), 10 g/l peptone (Difco) and 20 g/l agar, pH 6.0) added of 5 g/l of calcium carbonate (Merck), at 4 °C. The strain Saccharomyces cerevisiae ISA 1000 and the type strain of B. anomalus ISA 1652 were used for comparative purposes.
2.2. Tolerance to ethanol and potassium metabisulphite (PMB) The tolerance evaluation to ethanol and PMB was performed according to the liquid medium assimilation tests described by
Kurtzman and Fell (1998). Briefly, fresh cultures obtained by growth on GYP slants (24–48 h) were dispersed in 5 ml of Ringer diluent (Oxoid, Basingstoke, England) contained in test
tubes (16 mm diameter). A card with black lines approximately 0.75 mm wide was used to check the turbidity of the yeast suspension. When the black lines became visible through the tube as dark bands, one drop was delivered, with a sterile Pasteur pipette, to each of the growth broths’ test tubes. The growth media consisted of 4 ml Yeast Nitrogen Base with amino-acids (YNB, Difco) (6.7 g/l) supplemented with glucose (20 g/l) and different levels of ethanol (Merck) (8, 10, 12, 13, 14, 14.5, 15, 15.5, 16, 16.5, 17 and 17.5% v/v) or PMB (Merck) (40, 60, 70, 80, 90, 100, 120, 140, 160, 180, 200 and 210 mg/l), at initial pH 3.50. For each concentration growth was positive when the lines of the black cardboard became diffuse (value++). Then 3 drops of yeast suspension were inoculated in the following higher ethanol or PMB concentration. After 3 weeks of incubation at 25 °C, growth was considered negative when black lines were distinguishable but with indistinct edges visible through the test tube (value+). In this way the results reflect the tolerance of cells adapted to the antimicrobial agent.
2.3. Growth in wines and effect of ethanol and pH
A loopful of fresh culture (24–48 h) was used to inoculate 50 ml of culture broth (6.7 g/l YNB, 20 g/l glucose, 10% (v/v) ethanol, pH 3.50) previously filter-sterilised through a cellulose acetate membrane (0.22 μm pore size, 47 mm diameter, Millipore). Incubation occurred at 25 °C with orbital shaking (120 rpm). Growth was followed by measurement of the absorbance at 640 nm. When OD was about 0.5 units, red wine (100 ml in 250 ml cotton-plugged Erlenmeyer flasks) was inoculated to give an initial population of 104 cells/ml. Incu-bation was performed by orbital shaking (150 rpm) at 25 °C. During incubation, wine samples were decimally diluted and cellular viability determined by surface-plating 0.1 ml onto GYP medium, in duplicate. Metabolically-active cells were estimated by methylene blue staining (0.1 g/l methylene blue (Merck) in a 20 g/l sodium citrate (Sigma) solution) following the protocol described byThomas et al. (1978). Experimental wines were obtained by a blend of several commercial red wines without residual sugar. The free sulphur dioxide present in the blends was removed by the addition of acetaldehyde ( Ribéreau-Gayon et al., 2006). The ethanol content was adjusted to 8%, 10% or 12% (v/v) with a solution of 5 g/l of tartaric acid (Merck) or 99% pure ethanol (Merck). The pH value was adjusted to 3.00 or 3.50 with concentrated NaOH (Merck) or HCl (Merck). The final wine blends were sterilised by filtration through cellulose acetate membranes (0.22 μm pore size, 47 mm diameter, Millipore).
2.4. Effect of potassium metabisulphite (PMB) in wines Yeast suspensions were prepared as described before (lines 111–117) and inoculated in a red wine blend to give an initial count of about 104 cells/ml. Blends (50 ml of wine) were maintained in 100 ml Erlenmeyer flasks plugged with rubber stoppers. These stoppers were perforated by cotton-plugged hypodermic needles to minimize evaporation losses. Incubation was carried out at 25 °C without shaking for up to 10 days.
Table 1
Origin of analyzed strains
Species Strains ISAa Sourcea Saccharomyces
cerevisiae
1000 IGC 4072, Fermivin, commercial starter Brettanomyces anomalus 1652 CBS 77T b, IGC 5153, Stout beer Dekkera bruxellensis
1649 CBS 72T, IGC 4179, Lambic beer
1146 UCD 605
1327, 1600 Sparkling white wines (Portugal) 1700, 1703, 1791, 2128 Red wines (Dão, Portugal) 1717 White wine (Estremadura, Portugal) 2101, 2102, 2104, 2132 Red wines (Alentejo, Portugal) 2114, 2115, 2116, 2120 Red wines (Ribatejo, Portugal) 2206, 2208, 2210 Red wine (Estremadura, Portugal) 2150 Red wine (Portugal)
2172 Red wine (Spain)
2173, 2174 Red wine (California, USA) 2202, 2203, 2204, 2205 Red wines (ISVEA, Italy) 2207 Red wine (Terras do Sado, Portugal) 2209, 2211, 2212 Red wines (Douro, Portugal) 2297, 2307 Barrique wood after red wine storage 2298 Insect in winery
a ISA (Instituto Superior de Agronomia, Lisbon, Portugal), IGC (Gulbenkian
Institute of Science, Oeiras, Portugal), CBS (Centraalbureau voor Shimmelcultures, Delft, The Netherlands), UCD (University of California, Davis, USA), ISVEA (Istituto per lo Sviluppo Viticolo Enologico ed Agroindustriale, Tuscany, Italy).
b
Cellular viability was periodically measured by surface-plating 0.1 ml of wine sample onto GYP agar. PMB (100 mg/l) was added to wines when about 106–107CFU/ml were attained. The percentage of active cells was measured by methylene blue staining, as described before. At the end of the experiment, cell viability was determined in the remaining wine volume by plating onto GYP agar after 0.22 μm membrane filtration (Millipore). Results are the mean of two independent experiments.
A selected group of strains resistant to 100 mg/l PMB (ISA 2101, 2172 and 2298) was further tested against the addition of 100, 150 and 200 mg/l of PMB during the growth phase, as described before. In order to test the influence of different cellular adaptation to wine, these strains were also previously grown in red wine (6% (v/v) ethanol, pH 3.50, without free sulphur dioxide), inoculated in dry red wine blends (12% (v/v) ethanol, pH 3.50, without free sulphur dioxide) and challenged against 100 mg/ PMB, by use of the protocol described before. 2.5. Effect of sulphur dioxide at winery level
Winery trials were conducted in commercial 2004 dry red wine (13.8 % (v/v) ethanol, pH 3.42) stored in new French oak barrels (225 l) maintained under 4 levels of free sulphur dioxide targeted at 25 mg/l, 30 mg/l, 45 mg/l and 60 mg/l. Sulphur dioxide concentrations were checked every 15 days with the iodine titration method recommended by the International Organization of the Vine and Wine (OIV). Sulphur tablets were used to adjust the free sulphur dioxide concentration to the required level (Ribéreau-Gayon et al., 2006). Samples were taken with a sterile pipette (200 ml) from the wine surface and from the barrel bottom, serially diluted with Ringer solution or concentrated by membrane filtration (0.22μm pore size, 47 mm diameter, Millipore). Viable cells were counted after inoculation on Dekkera/Brettanomyces differential medium (DBDM) plates as described byRodrigues et al. (2001). Small pinpoint olive-green colonies on plates releasing a phenolic smell were microscopically examined after incubation for 12 days at 25 °C. The reported counts (CFU/ml) corresponded to colonies
showing cells with shapes characteristic of D. bruxellensis (presence of boat or ogival shapes and bud scars).
3. Results
3.1. Ethanol and PMB tolerance screenings
The tolerance to ethanol and PMB of Dekkera spp. and S. cerevisiae, measured in synthetic culture media at initial pH 3.50, is shown inTables 2 and 3, respectively. S. cerevisiae was relatively more tolerant to ethanol, growing under 16% (v/v), while the 2 most resistant strains of D. bruxellensis grew under 15.0% (v/v) ethanol. Most strains of this species (20 over 29) grew under 14.5% (v/v) ethanol. The most sensitive strains tested (2 over 29) grew in the presence of 13.5% (v/v) ethanol. The type strain of B. anomalus was the most ethanol-sensitive strain, being inhibited by the presence of ethanol higher than 8% (v/v). Concerning PMB, the most resistant strain was also S. cerevisiae, growing under 200 mg/l of PMB, while 17 strains of D. bruxellensis grew in the range of 60 to 90 mg/l. Six strains did not grow under the lowest PMB concentration tested (40 mg/l). B. anomalus was able to grow under 90 mg/l of PMB.
3.2. Behaviour of yeast populations in wines
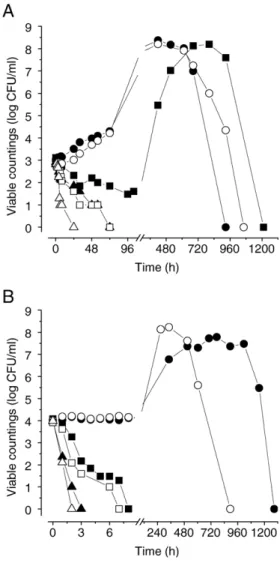
Fig. 1 shows the survival patterns of two D. bruxellensis
strains in a dry red wine blend as a function of ethanol and pH. Three different patterns were observed: i) initial lag phase followed by growth and death under a bell-shaped curve; ii) initial death phase followed by growth and death under a bell-shaped curve; iii) death phase after inoculation without viability recovery. The extent of the lag phase or the magnitude of death rate depends on the stress exerted on yeast populations. For both strains and pH values, growth was observed under 8% (v/v) ethanol and death under 14% (v/v). Only the strain ISA 1791 was able to grow after an initial death phase at 12% (v/v) ethanol and pH 3.50. This initial death phase was characterized
Table 2
Maximum ethanol concentration (% v/v) allowing growth in YNB broth with glucose (20 g/l) and initial pH 3.50, at 25 °C, for a maximum incubation period of 29 days
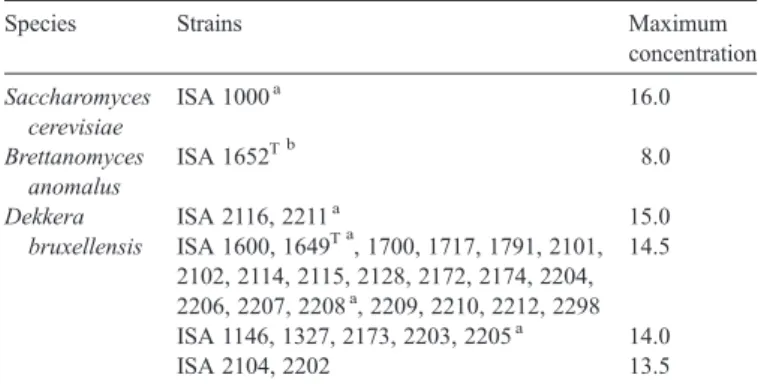
Species Strains Maximum
concentration Saccharomyces cerevisiae ISA 1000a 16.0 Brettanomyces anomalus ISA 1652T b 8.0 Dekkera bruxellensis ISA 2116, 2211a 15.0 ISA 1600, 1649T a, 1700, 1717, 1791, 2101, 2102, 2114, 2115, 2128, 2172, 2174, 2204, 2206, 2207, 2208a, 2209, 2210, 2212, 2298 14.5 ISA 1146, 1327, 2173, 2203, 2205a 14.0 ISA 2104, 2202 13.5
a Where the duplicates did not show the same results, the highest score is
presented. The difference between the duplicates was no higher than 0.5% (v/v).
b
Type strain.
Table 3
Maximum initial potassium metabisulphite concentration (mg/l) allowing growth in YNB broth with glucose (20 g/l) and initial pH 3.50, at 25 °C, for a maximum incubation period of 21 days
Species Strains Maximum
concentration Saccharomyces cerevisiae ISA 1000 200 Brettanomyces anomalus ISA 1652T a, b 90 Dekkera bruxellensis ISA 1700a 90 ISA 2114, 2206, 2212, 2209a 80 ISA 1791, 2102, 2203, 2211, 2298 70 ISA 1327, 1717, 2115, 2128, 2174, 2202a, 2207 60 ISA 1146, 1649T, 2101, 2116, 2173, 2210 40 ISA 1600, 2104, 2172, 2204, 2205, 2208 b40
a Where the duplicates did not show the same results, the highest score is
presented. The difference between the duplicates was no higher than 10 mg/l.
b
by the similarity between the viable counts obtained by plating and the numbers of metabolically-active cells estimated by the methylene blue stain. Contrarily, the viable counts determined during the death occurring after the stationary phase were at least 10 times lower than the number of metabolically-active cells (results not shown).
The yeast behaviour was determined in several other dry red wine blends with ethanol and pH adjusted to 12% (v/v) and 3.50, in the absence of free sulphur dioxide. Under these con-ditions, the strain ISA 1791 showed either full death or growth depending on the wine blend (results not shown).
3.3. Effect of PMB under laboratory conditions
The previous experiments with different red wine blends prepared with equal concentrations of ethanol (12% v/v) and pH values (pH 3.50) induced different behaviours for the same D. bruxellensis strain. The behaviour of different strains must therefore be determined simultaneously with the same wine
blend to obtain comparable results. To mimic the effect of PMB on wine-adapted yeast populations, the preservative was added when cell counts attained 106–107CFU/ml.
A total of 19 strains were inoculated in a dry red wine blend (12% (v/v) ethanol and pH 3.50), resulting in different behav-iours. The type strain ISA 1649 died within 24 h of inoculation and strain ISA 2121 did not attain more than 2.5 × 10²CFU/ml in the course of the experiment. The behaviour of the remaining 17 strains is illustrated by the growth pattern of 4 strains in
Fig. 2. While some strains exhibited a significant viability loss after wine inoculation followed by cellular growth, others initiated the growth phase without showing a decrease in viable counts. The values of minimum and maximum viable counts attained before the addition of PMB for the tested 19 strains are shown inTable 4.
The effect of 100 mg/l PMB added to red wine was evaluated in the 17 strains displaying maximum viable counts higher than 106 CFU/ml. Fig. 2 shows the behaviour of the above-mentioned 4 illustrative strains after PMB addition. Strains ISA 2172 and ISA 2298 resumed growth after the death induced by PMB addition. In opposition, strains ISA 1703 and ISA 2173 did not recover their viability during the course of the ex-periment. To check the absence of viable cells in the tested wines, the total wine volume was analyzed at the end of the experiment. These two strains did not show the presence of viable or metabolically-active cells. For all 17 strains, the minimum and maximum viable counts determined after PMB addition are shown in Table 4. A total of 7 strains were in-activated by this level of PMB. The populations of the other 10 strains were partially inactivated by 100 mg/l PMB and resumed growth after the initial death phase.
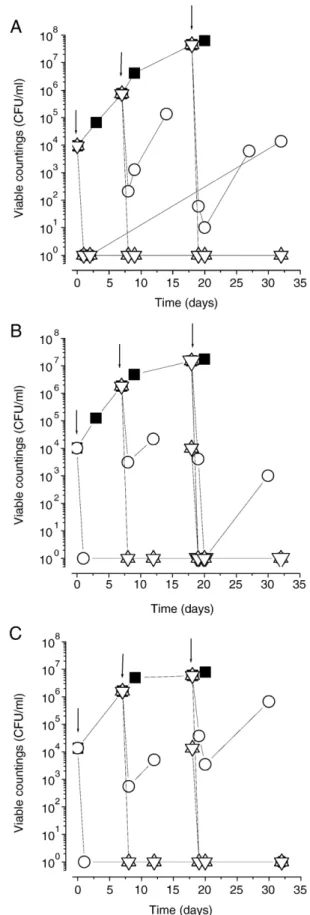
Three of the resistant strains isolated from red wines with different origins (ISA 2101 and 2172) and from insects (ISA 2298) were used to study the effect of increasing concentrations of PMB added during different growth phases (Fig. 3). Levels of 150 mg/l and 200 mg/l fully killed cell populations during any growth phase of the 3 strains. The addition of 100 mg/l was
Fig. 1. Viability of Dekkera bruxellensis ISA 1791 (filled symbols) and ISA 2150 (open symbols) inoculated in wine blends at pH 3.50 (A) and pH 3.00 (B) at 8 (●, ○), 12 (■, □) and 14 (▲, Δ) % (v/v) ethanol. The value 0 for viable countings indicates the absence of colonies in the volume of 0.1 ml of wine sample.
Fig. 2. Effect of the addition of 100 mg/l of potassium metabisulphite on the viability of several strains of D. bruxellensis grown in red wine with pH 3.50 and 12% (v/v) of ethanol. Symbols: (■, □) ISA 1703; (●, ○) ISA 2298; (▲, Δ) ISA 2173; (♦, ◊) ISA 2172. Before sulphite addition: filled symbols; after sulphite addition: open symbols. The value 100indicates the absence of colonies
only effective in the initial growth phase against strains ISA 2172 and 2298. Strain ISA 2101 was partially killed and re-covered its viability, being detected at 1.4x10⁴ CFU/ml after 32 days of incubation.
The effect of cellular wine adaptation on the sulphur dioxide tolerance was mimicked by wine inoculation with cells of strains ISA 2101, 2172 and 2298, previously grown in red wine with 6% (v/v) ethanol. All wine-adapted strains showed ex-ponential growth not preceded by a lag phase or initial death upon wine inoculation (results not shown). Wine-adapted cells did not, however, exhibit higher tolerance to PMB added in the early stationary phase (results not shown).
3.4. Effect of PMB under winery conditions
The effect of sulphur dioxide was tested in a practical situa-tion where spontaneous D. bruxellensis populasitua-tions may attain high densities, as in the case of wine ageing in oak barrels. Red wines maintained in new oak barrels were monitored for the presence of D. bruxellensis at 3 different dates in 2005 (10th June, 23rd July and 20th October).Table 5shows viable cell counts in different barrels treated with increasing levels of free sulphur dioxide. Only average concentrations above 39–40 mg/l
were effective in preventing the growth of D. bruxellensis, in wine taken from either the upper or lower level of the barrels. In aqueous solutions at 20 °C, the percentage of molecular sulphur dioxide, at pH 3.42, is about 2.5%, which increases with ethanol
Table 4
Minimum and maximum viable countings (CFU/ml) of D. bruxellensis strains during growth and after the addition of 100 mg/l potassium metabisulphite (PMB), in a red wine blend adjusted to 12% (v/v) ethanol and pH 3.50 Strain Before PMB addition After PMB addition
Minimum (CFU/ml) Maximum (CFU/ml) Minimum (CFU/ml) Growth recoverya 1327 5.0 × 10³ 1.6 × 10⁷ b10 + 1600 5.5 × 10 1.3 × 10⁷ 2.7 × 10² + 1649T b10 b10 Ndb Nd 1700 3.2 × 10² 1.7 × 10⁷ 5.5 × 10⁴ + 1703 b10 1.3 × 10⁷ b10 − 1717 4.5 × 10 1.0 × 10⁷ 1.3 × 10⁶ + 1791 2.5 × 10 1.2 × 10⁷ b10 − 2101 5.2 × 10³ 1.4 × 10⁷ 5.1 × 10⁴ + 2104 1.2 × 10³ 1.3 × 10⁷ 7.2 × 10⁴ + 2115 3.1 × 10³ 1.3 × 10⁷ b10 − 2120 3.5 × 10³ 4.3 × 10⁶ b10 − 2121 b10 2.5 × 10² Nd Nd 2128 6.7 × 10² 5.8 × 10⁶ 3.7 × 10³ + 2132 4.0 × 10³ 1.6 × 10⁷ 6.1 × 10³ + 2172 2.8 × 10³ 1.4 × 10⁷ 10 + 2173 1.3 × 10⁴ 1.1 × 10⁷ b10 − 2297 1.5 × 10³ 8.7 × 10⁶ b10 − 2298 2.8 × 10³ 3.1 × 10⁶ 1.0 × 10⁴ + 2307 4.0 × 10³ 9.8 × 10⁶ b10 −
a (+), presence of growth after initial death or lag phase; (−), absence of viable
cells until the end of the experiment.
b Not determined.
Fig. 3. Effect of the addition of increasing concentrations of potassium meta-bisulphite on the viability of D. bruxellensis ISA 2101 (A), 2172 (B) and 2298 (C), grown in wine with pH 3.50 and 12% (v/v) of ethanol. Sulphite was added at 3 different times during growth as indicated by the arrows. Symbols: (■) absence of PMB; (○) after addition of 100 mg/l; (△) after addition of 150 mg/l; (▽) after addition of 200 mg/l. The value 10° indicates the absence of colonies in the volume of 0.1 ml of wine sample.
content and temperature (Ribéreau-Gayon et al., 2006). Then 40 mg/l of free sulphur dioxide corresponded to 1 mg/l molec-ular sulphur dioxide. The average concentrations of 24–30 mg/l did not prevent the development of D. bruxellensis during the 4 months’ storage. In particular, barrel C (under 26±6 mg/ free sulphur dioxide), that showed 1 CFU/ml at the second sampl-ing date, presented counts higher than 3 × 10⁴CFU/ml after 3 months. The highest counts were observed in two samples taken from the barrels' bottom under 24 ± 4 or 26 ± 6 mg/l free sulphur dioxide, after 4 months. D. bruxellensis was detected, at the end of the test period, under 29 ± 6 and 30 ± 5 mg/l of free sulphur dioxide in the bottom level but not in the upper level of the barrels.
4. Discussion
The utilization of tolerance screenings in synthetic media enabled the comparison of the behaviour of D. bruxellensis with S. cerevisiae. This last species, used in wine fermentation, is relatively more tolerant to ethanol and sulphur dioxide than D. bruxellensis. The type strain of B. anomalus was the most sensitive to ethanol, growing only in the presence of 8% (v/v). This higher sensitivity, if valid for a larger number of strains, could explain the absence of this species from wines, as hypo-thesized by Loureiro and Malfeito-Ferreira (2003). Conterno et al. (2006)also showed that 35 strains of D. bruxellensis grew in the presence of 10% (v/v) ethanol, but higher concentrations were not assayed. The ethanol tolerance is believed to be one of the main factors limiting yeast growth in wines. Concerning D. bruxellensis, our results in synthetic media indicate that 14.5 to 15.0% (v/v) could be considered as the upper level permitting its proliferation in wines. Although we did not succeed in growing cells in wine with ethanol adjusted to 14% (v/v) and pH 3.50 under laboratory conditions, we observed growth in real wine with 13.8% (v/v) and pH 3.42 matured in oak barrels. This fact suggests that under winery conditions cells are better
adapted to overcome the environmental stresses. Overall, those tolerance values agree with the absence of D. bruxellensis isolation from high ethanol red wines and from fortified wines (as reviewed by Loureiro and Malfeito-Ferreira, 2003). This observation is also in accordance with empirical experience of sherry wines where increasing ethanol to 15% (v/v) prevents D. bruxellensis growth but enables the development of S. cerevisiae film-forming strains (Ibeas et al., 1997). Thus, although relatively tolerant to ethanol, D. bruxellensis should be regarded as more sensitive than S. cerevisiae.
The results presented in this work explain to a reasonable extent the behaviour of D. bruxellensis populations observed in real wines. The difficulty in obtaining comparable behaviours with equivalent laboratory wine blends corresponds to the empirical observation that some wines, with similar ethanol and pH values, seem to be more vulnerable to yeast spoilage than others. In particular, white wines induced full cell death when assayed in parallel with red wines (unpublished observations). Thus, the absence of “horse sweat” taint in white wines (Loureiro and Malfeito-Ferreira, 2006) may be explained by its resistance to D. bruxellensis growth. Growth in white wines could only be achieved either by lowering ethanol content or increasing pH values to unrealistic levels (unpublished obser-vations). Further studies are required to clarify the different cellular behaviour in red and white wines.
In red wines the observed initial death phase and sequential growth have also been reported byGrbin and Henschke (2000) andDu Toit et al. (2005).Fugelsang and Zoecklein (2003)did not notice the existence of a death phase, probably because viable counts were determined on a weekly basis. These authors described two types of growth cycles, one showing a bell-shaped pattern, similar to our observations, and the other dis-playing a second growth phase, ranging from 61 to 712 days' duration. We did not observe this second growth phase, perhaps because of different incubation conditions. The physiological mechanisms underlying the initial death phase should be metabolically different from those of the final death phase owing to the significantly higher proportion of metabolically-active cells, evidencing the presence of an metabolically-active but not culturable population in the final decline phase.
In winery practice sulphur dioxide may be added as PMB aqueous solutions (Ribéreau-Gayon et al., 2006). Our screening results showed that S. cerevisiae is considerably more tolerant to PMB than D. bruxellensis.Conterno et al. (2006)presented a tolerance screening using 35 D. bruxellensis strains that were able to grow in the range of 10 to 50 mg/l sulphur dioxide, which correlates well with our results, as we know that PMB yields about 57% of sulphite (Ribéreau-Gayon et al., 2006). The tolerance tests carried out in red wine showed that 100 mg/l of PMB was enough to kill about 106cells/ml in 7 out of 17 strains, or that 150 mg/l fully killed 3 of the most resistant strains. The range 100–150 mg/l PMB may correspond to about 33–50 mg/l free sulphur dioxide that at pH 3.50 is equivalent to 0.66–1.0 mg/l of the active molecular form (Ribéreau-Gayon
et al., 2006). This range is in accordance with the value
estimated in the winery trial and so we suggest the average value of 1 mg/l molecular sulphur dioxide to prevent D.
Table 5
Enumeration of Dekkera bruxellensis populations (CFU/ml) during the maturation of red wine (13.8 % ethanol, pH 3.42) in new oak barriques under different levels of free sulphite
Free SO2
(mg/l)a
Barriques Sampling dateb
10th June 23th July 20th October
29 ± 6 A top b1 b1 b1 A bottom b1 b1 3 24 ± 4 B top b1 b1 2 B bottom b1 b1 3.6 × 10⁴ 26 ± 6 C top b1 b1 2 C bottom b1 1 N3.0×104 30 ± 5 D b1 b1 b1 D bottom b1 b1 1 43 ± 7 E both levels b1 b1 b1 39 ± 6 F both levels b1 b1 b1 51 ± 9 G both levels b1 b1 b1 56 ± 10 H both levels b1 b1 b1 a
Average and standard deviation of 5 successive determinations.
b
The valueb1 corresponds to absence of counts after membrane filtration of 100 ml of wine.
bruxellensis blooms in ageing barrels. Our laboratory tests in static Erlenmeyer flasks seem therefore to be adequate in-dicators of cellular behaviour under winery conditions. The killing effect of sulphur dioxide was similar when we used the viability measurements by plating and the determination of metabolically-active cells. Thus, contrary to Du Toit et al. (2005), we did not observe the existence of an active but non-culturable population after the addition of sulphur dioxide. In addition,Du Toit et al. (2005)recommended the maintenance of 25–35 mg/l free sulphur dioxide in bulk wines to prevent D. bruxellensis growth.Ribéreau-Gayon et al. (2006)advised the level of 30 mg/l of free sulphite at pH 3.4–3.5 to eliminate viable D. bruxellensis cells. Our results suggest that a higher concentration of sulphur dioxide should be kept to avoid cellular growth. This difference may be explained by the fact that we used yeast populations adapted to wine, at relatively high contamination rates (about 106CFU/ml) in semi-aerobic conditions in Erlenmeyer flasks. Then the level of 1 mg/l of molecular sulphite may be looked as a yardstick for sulphur dioxide utilization when winemakers are faced with D. bruxellensis blooms and corresponds to our winery experience in the prevention of serious infections.
The ability to resume growth after an initial decline during which cells are not detected by plating seems to be a typical behaviour of D. bruxellensis. The regular monitoring of these yeasts is essential to prevent the building-up of contamina-tions, even when past microbial control results are null, because growth may start when conditions become more favourable. The physiological mechanisms underlying this feature are not known.Uscanga et al. (2000) hypothesized that their survival was the result of exceptional resistance to minimal nutrient conditions. Our results showed that D. bruxellensis is no more resistant than S. cerevisiae to major inhibitors like ethanol and sulphur dioxide and so, probably, the mechanisms underlying the ability to survive in nutritionally-poor environments is the key to explain their proliferation when the environment be-comes less stressing.
Acknowledgements
The research work was supported by FCT and by POCI 2010 (project POCI/AGR/ 56771/2004), under the frame of the European Fund FEDER.
References
Chatonnet, P., Boidron, J., Dubourdieu, D., 1993. Influence des conditions d’élevage et de sulfitage des vins rouges en barriques sur le teneur en acide acétique et en ethyl-phenols. Journal International Sciences de la Vigne et du Vin 27, 277–298.
Chatonnet, P., Dubourdieu, D., Boidron, J.N., Pons, M., 1992. The origin of ethylphenols in wines. Journal of the Science of Food and Agriculture 60, 165–178.
Ciolfi, G., 1991. Ecologia dei lieviti vinari. Vini d’Italia 33, 41–46.
Conterno, L., Joseph, C.M.L., Arvik, T.J., Henick-Kling, T., Bisson, L.F., 2006. Genetic and physiological characterization of Brettanomyces bruxellensis strains isolated from wines. American Journal of Enology and Viticulture 57, 139–147.
Dias, L., Pereira-da-Silva, S., Tavares, M., Malfeito-Ferreira, M., Loureiro, V., 2003. Factors affecting the production of 4-ethylphenol by the yeast Dekkera bruxellensis in enological conditions. Food Microbiology 20, 377–384. Du Toit, W.J., Pretorius, I.S., Lonvaud-Funel, A., 2005. The effect of sulphur
dioxide and oxygen on the viability and culturability of a strain of Acetobacter pasteurianus and a strain of Brettanomyces bruxellensis isolated from wine. Journal of Applied Microbiology 98, 862–871.
Froudière, I., Larue, F., 1989. Conditions de survie de Brettanomyces (Dekkera) dans le mout de raisin et le vin. Actualités Oenologiques (Séances du Symposium International d’Oenologie). Dunod, Bordeaux, France, pp. 297–303. Fugelsang, K., Zoecklein, B., 2003. Population dynamics and effects of
Brettanomyces bruxellensis strains on Pinot noir (Vitis vinifera L.) wines. American Journal of Enology and Viticulture 54, 294–300.
Gaia, P., 1987. Caraterizzazione tassonomica ed enologica de lieviti anomali fonte di inquinamento dei vini. Annali dell’Istituto Sperimentale per l’Enologia Asti 18, 290–305.
Gerbaux, V., Vincent, B., Bertrand, A., 2002. Influence of maceration tem-perature and enzymes on the content of volatile phenols in Pinot noir wines. American Journal of Enology and Viticulture 53, 131–137.
Godden, P., Gishen, M., 2005. Trends in the composition of Australian wine. The Australian and New Zealand Wine Industry Journal, 20 5, 21–46. Grbin, P.R., Henschke, P.A., 2000. Mousy off-flavour production in grape juice
and wine by Dekkera and Brettanomyces yeasts. Australian Journal of Grape and Wine Research 6, 255–262.
Heresztyn, T., 1986. Metabolism of volatile phenolic compounds from hidroxy-cinnamic acids by Brettanomyces yeast. Archives of Microbiology 146, 96–98.
Ibeas, J.I., Lozano, I., Perdigones, F., Jimenez, J., 1997. Effects of ethanol and temperature on the biological aging of sherry wines. American Journal of Enology and Viticulture 48, 71–74.
Kurtzman, C.P., Fell, J.W (Eds.), 1998. The Yeasts, ATaxonomic Study, 4th edition. Elsevier, Amsterdam.
Loureiro, V., Malfeito-Ferreira, M., 2003. Spoilage yeasts in the wine industry. International Journal of Food Microbiology 86, 23–50.
Loureiro, V., Malfeito-Ferreira, M., 2006. Spoilage activities of Dekkera/ Brettanomyces spp. In: Blackburn, C. (Ed.), Food Spoilage Microor-ganisms. Chapter 13. Woodhead Publishing Limited, Cambridge, England, pp. 354–398.
Ribéreau-Gayon, P., Dubourdieu, D., Donèche, B., Lonvaud, A., 2006. 2nd ed. Handbook of Enology. The Microbiology of Wine and Vinifications, 1. John Wiley and Sons, Ltd, Chichester, England.
Rodrigues, N., Gonçalves, G., Malfeito-Ferreira, M., Loureiro, V., 2001. Development and use of a differential medium to detect yeasts of the genera Dekkera/Brettanomyces. International Journal of Food Microbiology 90, 588–599.
Suárez, R., Suárez-Lepe, J.A., Morata, A., Calderón, F., 2007. The production of ethylphenols in wine by yeasts of the genera Brettanomyces and Dekkera. A review. Food Chemistry 102, 10–21.
Thomas, D., Hossack, J., Rose, A., 1978. Plasma-Membrane lipid composition and ethanol tolerance in Saccharomyces cerevisiae. Archives of Micro-biology 117, 239–245.
Uscanga, M., Delia, M.L., Strehaiano, P., 2000. Nutritional requirements of Brettanomyces bruxellensis: growth and physiology in batch and chemostat cultures. Canadian Journal of Microbiology 46, 1046–1050.
Van der Walt, J.P., van der Kerken, A.E., 1961. The wine yeasts of the Cape. Part V. Studies on the occurrence of Brettanomyces schanderlii. Antonie Leeuwenhoek 27, 81–90.