Maria Inês Neves de Sousa
Data mining for anomaly detection in maritime
traffic data
Dissertação para obtenção do grau de Mestre em Ciências
Militares Navais, na especialidade de Marinha
Alfeite
2018
Maria Inês Neves de Sousa
Data mining for anomaly detection in maritime traffic data
Dissertação para obtenção do grau de Mestre em Ciências Militares Navais, na especialidade de Marinha
Orientação de: CFR RES Aldino Manuel dos Santos de Campos Coorientação de: Victor José de Almeida e Sousa Lobo e de
Rui Filipe Pedroso Maia
O aluno mestrando, O orientador,
_____________________ _____________________
ASPOF Neves de Sousa CFR RES Aldino Campos
Alfeite
“We are drowning in information, but starving for knowledge.”
To my family… Thank you.
Acknowledgements
There are many people I would like to thank.
To my Thesis Supervisor, CFR RES Aldino Campos, for his guidance and prompt response. His patience and composure were very important, helping me to stay focused and motivated during the course of this dissertation.
To Rui Maia, for his enthusiasm and all the help given throughout this year, providing me with the tools that I needed to choose the right direction and complete my dissertation with success.
To Professor Victor Lobo, for his insightful comments and help given, his advices were of extreme importance.
To CFR Fidalgo Neves, for all the interest demonstrated and willingness to help whenever he could, especially in the early stages of this dissertation.
I would also like to thank all the Organisations and participants that helped me throughout this project, particularly Direção de Tecnologias de Informação e
Comunicações, INOV-INESC, Centro de Operações Marítimas, Direção de Análise e Gestão da Informação and Instituto Hidrográfico.
To my family, for all the love, support and encouragement given, it was essential. To Alexandre, for his patience and for making this journey easier. It would not be the same without you.
Abstract
For the past few years, oceans have become once again, an important means of communication and transport. In fact, traffic density throughout the globe has suffered a substantial growth, which has risen some concerns. With this expansion, the need to achieve a high Maritime Situational Awareness (MSA) is imperative. At the present time, this need may be more easily fulfilled thanks to the vast amount of data available regarding maritime traffic. However, this brings in another issue: data overload. Currently, there are so many data sources, so many data to obtain information from, that the operators cannot handle it. There is a pressing need for systems that help to sift through all the data, analysing and correlating, helping in this way the decision making process.
In this dissertation, the main goal is to use different sources of data in order to detect anomalies and contribute to a clear Recognised Maritime Picture (RMP). In order to do so, it is necessary to know what types of data exist and which ones are available for further analysis. The data chosen for this dissertation was Automatic Identification System (AIS) and Monitorização Contínua das Atividades da Pesca (MONICAP) data, also known as Vessel Monitoring System (VMS) data. In order to store 1 year worth of AIS and MONICAP data, a PostgreSQL database was created. To analyse and draw conclusions from the data, a data mining tool was used, namely, Orange. Tests were conducted in order to assess the correlation between data sources and find anomalies. The importance of data correlation has never been so important and with this dissertation the aim is to show that there is a simple and effective way to get answers from great amounts of data.
Resumo
Nos últimos anos, os oceanos tornaram-se, mais uma vez, um importante meio de comunicação e transporte. De facto, a densidade de tráfego global sofreu um crescimento substancial, o que levantou algumas preocupações. Com esta expansão, a necessidade de atingir um elevado Conhecimento Situacional Marítimo (CSM) é imperativa. Hoje em dia, esta necessidade pode ser satisfeita mais facilmente graças à vasta quantidade de dados disponíveis de tráfego marítimo. No entanto, isso leva a outra questão: sobrecarga de dados. Atualmente existem tantas fontes de dados, tantos dados dos quais extrair informação, que os operadores não conseguem acompanhar. Existe uma necessidade premente para sistemas que ajudem a escrutinar todos os dados, analisando e correlacionando, contribuindo desta maneira ao processo de tomada de decisão.
Nesta dissertação, o principal objetivo é usar diferentes fontes de dados para detetar anomalias e contribuir para uma clara Recognised Maritime Picture (RMP). Para tal, é necessário saber que tipos de dados existem e quais é que se encontram disponíveis para análise posterior. Os dados escolhidos para esta dissertação foram dados Automatic Identification System (AIS) e dados de Monitorização Contínua das Atividades da Pesca (MONICAP), também conhecidos como dados de Vessel
Monitoring System (VMS). De forma a armazenar dados correspondentes a um ano de
AIS e MONICAP, foi criada uma base de dados em PostgreSQL. Para analisar e retirar conclusões, foi utilizada uma ferramenta de data mining, nomeadamente, o Orange. De modo a que pudesse ser avaliada a correlação entre fontes de dados e serem detetadas anomalias foram realizados vários testes.
A correlação de dados nunca foi tão importante e pretende-se com esta dissertação mostrar que existe uma forma simples e eficaz de obter respostas de grandes quantidades de dados.
Palavras-chave: conhecimento situacional marítimo, dados, tráfego marítimo, AIS,
Contents
ACKNOWLEDGEMENTS ... IX
ABSTRACT ... XI
RESUMO ... XIII
CONTENTS ... XV
LIST OF FIGURES ... XVII
LIST OF TABLES ... XXI
LIST OF ABBREVIATIONS AND ACRONYMS ... XXIII
1. INTRODUCTION ... 2 1.1. Motivation ... 7 1.2. Topic’s relevance ... 7 1.3. Goals ... 8 1.4. Structure ... 8 2. LITERATURE REVIEW ... 10
2.1. Maritime Situational Awareness ... 10
2.2. Maritime Domain Data ... 16
2.3. Concept of Anomaly ... 28
2.4. Anomaly Detection ... 29
2.5. Data mining tools ... 30
3. WORKFLOW AND DATA PROCESSING ... 38
3.1. Workflow ... 38
3.2. Data collection ... 39
3.3. Data Processing: AIS and MONICAP ... 39
3.4. PostgreSQL Database ... 44
4. DATA ANALYSIS TOOLS ... 50
4.1. Selected area ... 50
4.2. Data Mining for anomaly detection using Orange ... 51
5. TESTS AND RESULTS ... 58
5.1. Data correlation tests and results ... 58
5.2. Anomaly Detection tests and results ... 72
6.CONCLUSION ... 86 6.1. Summary ... 86 6.2. Constraints ... 87 6.3. Future work ... 87 REFERENCES ... 89 APPENDIX A ... 95
ANNEX A–INTERNATIONAL REQUIREMENTS FOR AISCARRIAGE ... 97
List of figures
Figure 1 - Main international maritime routes (Jornal da Economia do Mar, n.d.). ... 3
Figure 2 - Real time maritime traffic (Marine Traffic, n.d.). ... 3
Figure 3 - Data, information, knowledge and wisdom (context vs understanding) (Marinha, 2018). ... 7
Figure 4 - Challenges of Maritime Situational Awareness ... 14
Figure 5 –AIS Functioning – Slots (Navigation Center, n.d.). ... 19
Figure 6 – Example of information given by AIS. ... 21
Figure 7 - AIS data, reports inside the Maritime Operational Area. ... 24
Figure 8 - MONICAP system's functioning (Direção-Geral de Recursos Naturais, Segurança e Serviços Marítimos, n.d.). ... 25
Figure 9 - Continuous monitoring equipment (XSEALENCE, n.d.). ... 26
Figure 10 - Example of MONICAP messages. ... 26
Figure 11 - Collective Anomaly example (Chandola, 2009). ... 29
Figure 12 - Knowledge discovery process. ... 31
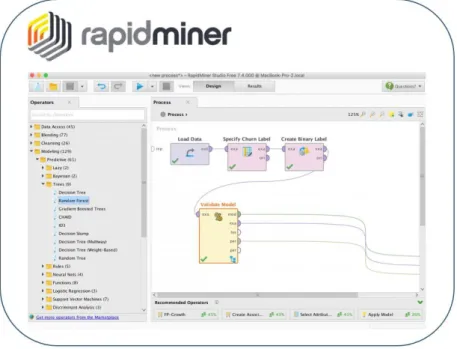
Figure 13 - Rapid Miner environment. ... 32
Figure 14 - WEKA environment. ... 33
Figure 15 - Weka GUI Chooser. ... 33
Figure 16 - Orange environment. ... 34
Figure 17 - Orange main widget groups ... 35
Figure 18 - Steps of the research. ... 38
Figure 19 - Excel daily file. ... 40
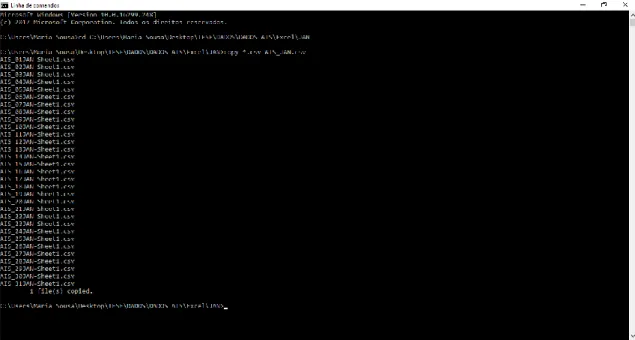
Figure 20 - Conversion from .xlsx files to .csv. ... 41
Figure 21 - Aggregation of the daily .csv files into monthly .csv files. ... 41
Figure 22 - Shapefile created through ArcGIS... 42
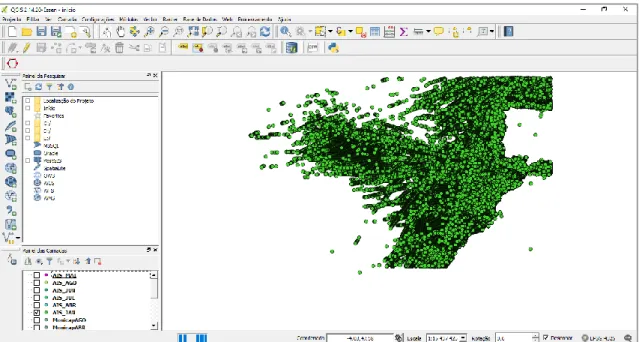
Figure 23 - QGIS vector layer added. ... 43
Figure 24 – QGIS to PostgreSQL connection. ... 43
Figure 25 – Database in the pgAdmin interface. ... 44
Figure 26 - pgAdmin tables of AIS_MONICAP_2017 database. ... 46
Figure 27 - Example of one of the AIS tables created. ... 46
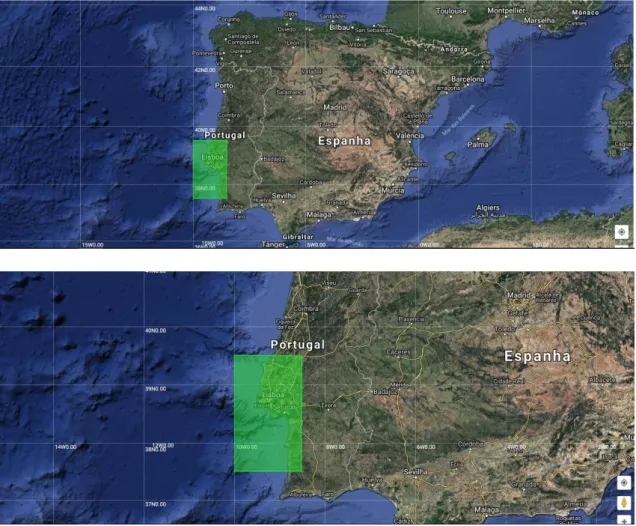
Figure 28 - Selected area (Daftlogic, n.d.). ... 50
Figure 29 - Traffic density in the chosen area (Marine Traffic, n.d.). ... 51
Figure 31 - Distance calculation methods available in Orange. ... 53
Figure 32 - Orange's impute widget. ... 53
Figure 33 - Different classification based on k value. ... 54
Figure 34 - Example of Gaussian distribution (Boost, n.d.)... 55
Figure 35 - Orange's outlier widget. ... 56
Figure 36 - Data file insertion. ... 58
Figure 37 - Selection of features. ... 59
Figure 38 - Distance selected, Euclidean. ... 59
Figure 39 - Distance matrix application. ... 60
Figure 40 – Example of color gradient based on distances. ... 61
Figure 41 - Distance matrix results between AIS data. ... 62
Figure 42 - Distance matrix results. ... 62
Figure 43 - Values used to analyse results of distance matrix. ... 63
Figure 44 - Distance obtained from correlating AIS and MONICAP data. ... 64
Figure 45 – Values used to analyse distance matrix with 8 minutes difference. ... 65
Figure 46 - Results obtained from correlating AIS and MONICAP data. ... 66
Figure 47 - Orange scheme without time data... 66
Figure 48 - Distance matrix results without time data. ... 67
Figure 49 - Distance matrix results for test 2. ... 68
Figure 50 - Distance matrix results in test 3 ... 69
Figure 51 - AIS and MONICAP data used on test 3. ... 70
Figure 52 - Results after Impute widget... 71
Figure 53 - Distance matrix results in test 3 b). ... 72
Figure 54 - Anomaly detection test Orange Workflow ... 73
Figure 55 - Impute widget erroneous results ... 74
Figure 56 - Branch of the workflow - Analysing records SOG = 0 ... 74
Figure 57 - Records with SOG = 0 on 1st of March, corresponding to a total of 3024 records... 75
Figure 58 - Outlier widget configuration ... 75
Figure 59 - a) Outlier Records; b) Inlier Records. ... 76
Figure 60 - Vessel with MMSI 255125111 route on 1st of March. ... 77
Figure 61 - SOG Outlier detection. ... 77
Figure 62 - Results of SOG outlier detection. ... 78
Figure 63 - SOG outlier detection after filtering. ... 78
Figure 65 - Features selection for traffic separation scheme. ... 80 Figure 66 - Outlier widget for traffic separation scheme. ... 81 Figure 67 - TSS of Cape Roca ... 81 Figure 68 - Crossing a traffic lanes according to International Regulations for
Preventing Collisions at Sea. ... 82 Figure 69 - Traffic separation scheme, a) Every record; b) Outlier records. ... 83 Figure 70 - TSS anomalous records. ... 83
List of tables
Table 1 – Example of MONICAP data format. ... 26 Table 2 – AIS and VMS comparison (Navigation Center, n.d.). ... 28 Table 3 - Summary table of the 3 data mining tools explored (Predictive Analytics Today, n.d.). ... 36 Table 4 - PostgreSQL processing capability (Database guide, n.d.). ... 44 Table 5 - Summary of the conducted tests. ... 84
List of Abbreviations and Acronyms
ACID Atomic, Consistent, Isolation and Durability
AIS Automatic Identification System
AMT Autoridade da Mobilidade e dos Transportes ANACOM Autoridade Nacional de Comunicações AOM Área Operacional Marítima
APA American Psychological Association
ASPOF Aspirante a Oficial
BMM BlueMassMed
BRITE Baseline for rapid Iterative Transformational Experimentation
C2 Command and Control
CADOP Centro de Análise de Dados Operacionais
CENTRIX Combined Enterprise Regional Information Exchange System
CFR Capitão-de-fragata
CFR Community Fleet Register
CINAV Centro de Investigação Naval
CISE Common Information Sharing Environment
COG Course Over Ground
COMAR Centro de Operações Marítimas COP
CSM
Common Operating Picture
Conhecimento Situacional Marítimo
CSV Comma Separated Values
DGRM Direção-Geral de Recursos Naturais, Segurança e Serviços Marítimos
DITIC Direção de Tecnologias de Informação e Comunicações
DOTMLPII Doctrine, organization, trainning, logistic, leadership, personnel, infraestructure and interoperability
DSC Digital Selective Calling
EMC Equipamento de Monitorização Contínua EMSA European Maritime Safety Agency
EO Earth Observation
ETA Estimated Time of Arrival
EU CDC European Union Cooperative Data Centre
EUROSUR European Border Surveillance System
FASTC2AP Fast Connectivity for Coalition Agents Program
FND Forças Nacionais Destacadas
GIS Geographic Information System
GMDSS Global Maritime Distress Safety System
GMSK Gaussian Minimum Shift Keying
GNSS Global Navigation Satellite System
GPS Global Positioning System
GUI Graphical User Interface
I2C Integrated System for Interoperable sensors & Information sources
for Common abnormal vessel behaviour detection & Collaborative identification of threat
IMO International Maritime Organization
ITU International Telecommunication Union
KDD Knowledge Discovery in Databases
KEEL Knowledge Extraction based on Evolutionary Learning
KNIME Konstanz Information Miner
LRIT Long-range Identification and Tracking
MARISA Maritime Integrated Surveillance Awareness
MARSUNO Maritime Surveillance in the Northen Sea Basins
MATLAB MATrix LABoratory
MCCIS Maritime Command and Control Information System
MDA Maritime Domain Awareness
MMSI Maritime Mobile Service Identity
MONICAP Monitorização Contínua das Atividades da Pesca MRCC Maritime Rescue Coordination Centre
MSA Maritime Situational Awareness
MSSIS Maritime Safety and Security Information System
NATO North Atlantic Treaty Organization
NEREIDS New Services Capabilities for Integrated and Advanced Maritime Surveillance
NGA National Geospatial-Intelligence Agency
NIRIS Networked Interoperable Real-Time Information Services
NMEA National Marine Electronics Association
PERSEUS Protection of European seas and borders through the intelligent use of surveillance
PJ Polícia Judiciária
RMP Recognised Maritime Picture
ROT Rate Of Turn
SADAP Sistema de Apoio à Decisão para a Atividade de Patrulha
SAR Search and Rescue
SAR Synthetic Aperture Radar
SEABILLA Sea Border Surveillance
SEF Serviço de Estrangeiros e Fronteiras
SIMTISYS Simulator for Moving Target Indicator System
SOG Speed Over Ground
SOLAS Safety of Life at Sea
SOTDMA Self-Organizing Time Division Multiple Access
STI Superintendência das Tecnologias de Informação TIDE Technology for Information, Decision and Execution
USA United States of America
VHF Very High Frequency
VMS Vessel Monitoring System
VoIP Voice over Internet Protocol
VTS Vessel Traffic Services
WEKA Waikato Environment for Knowledge Analysis
WGS World Geodetic System
C
HAPTER
1
INTRODUCTION
1.1
Motivation
1.2
Topic’s relevance
1.3
Goals
1.4
Structure
1. Introduction
In the last decade, oceans have regained an unparalleled importance to all nations, mainly due to the financial influence they represent for each country, especially for those that are considered coastal States, with large sea borders.
Nowadays, oceans are used by almost every country as an effective and cost efficient way to commerce goods. In fact, maritime traffic has increased significantly, being considered the main route of global trade.
The United Nations refer that “the world shipping fleet provides not only transport connectivity to global trade but also livelihoods to the people working in maritime businesses in developed and developing countries” (United Nations, 2017). In fact, if the values at the beginning of 2017 are to be considered “the world fleet’s commercial value amounted to $829 billion, with different countries benefiting from the building, owning, flagging, operation and scrapping of ships” and “with over 80 per cent of global trade by volume and more than 70 per cent of its value being carried on board ships and handled by seaports worldwide, the importance of maritime transport for trade and development
cannot be overemphasized” (United Nations, 2017).
Accordingly, the growth in sea transport has consequently resulted in the intensification of traffic density. This brings new issues regarding the navigation and maritime transport at safety and security levels (Sulemane, 2015).
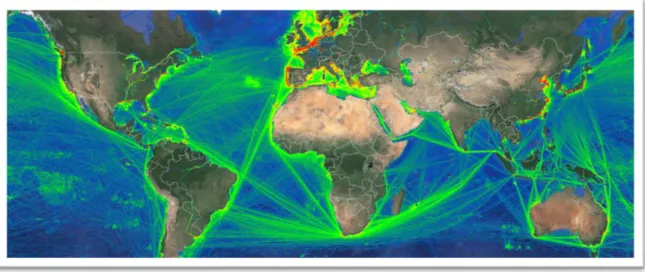
More specifically, Portugal, a coastal State with 92.226,0 km2 (Pordata, 2016), located on the South West Europe, has a vast maritime area under its domain. As observed in Figures 1 and 2, it is easy to conclude the vast commercial routes and immeasurable amount of ships that cross the Portuguese jurisdictional waters.
According to Autoridade da Mobilidade e dos Transportes (AMT)1, cargo trade at
the Portuguese mainland ports grew 5.1% by the end of October 2017 to a record of 81.3 million tonnes. Lisbon stands out, with a year-on-year gain of 26% for the best record in the last nine years. By trading 10.3 million tonnes, the port of the capital alone contributed with 2.1 million tonnes to the increase in activity on the mainland (Transportes e Negócios, 2017).
1 Transports and Mobility Authority. It is the regulatory and oversight body for the transport sector in
Figure 1 - Main international maritime routes (Jornal da Economia do Mar, n.d.).
Figure 2 - Real time maritime traffic (Marine Traffic, n.d.).
In addition to trade, there are also other resources in national waters, likewise important, which are of considerable value and need to be protected and preserved. Therefore, it is clear the need to ensure the proper use of the sea, preventing its illegal exploitation by defending its interests, encouraging the overall stability. It is crucial to have an adequate monitoring of national waters, to guarantee safety and security.
Portugal is located in a privileged position, not only in terms of international maritime traffic for being near focal points of maritime traffic, but also because of its responsibility in the area of Search and Rescue (SAR). With its archipelagos located in the North Atlantic, this State is responsible for a SAR area almost 63 times bigger than
the country itself, with 5.754.848 km2 (Direção-Geral de Recursos Naturais, Segurança e Serviços Marítimos, n.d.).
In Portugal, it is the Portuguese Navy that has the responsibility of ensuring that the country can use the sea for its own interests. Like other navies throughout the world, it is based on a dual concept structure. Considering this structure, on the one hand, they use their ships and means to perform in actions of military defence and in support of foreign policies. On the other hand, they use them to perform in actions concerning the authority and security of the country as well as to support the development of various areas such as scientific and cultural, thus allowing the maximization of resources. In other words, by carrying out missions of military and non-military nature.
That is why the Portuguese Navy, together with Polícia Judiciária (PJ)2 and
Serviço de Estrangeiros e Fronteiras (SEF)3, plays a big part in the fight against illegal maritime activities. From these illegal activities, the following stand out: terrorism (in Europe and possibly, in the near future, against the shipping lines essential for the world economy), illegal immigration and human trafficking (mostly from the North of Africa to Europe), piracy (for example near Guinea Gulf), drug trafficking (such as cocaine and haxixe), illegal fishing and depletion of natural resources, among other more (Melo, 2011).
Due to its geographical position, Portugal is in the centre of the scene of multiple illicit activities of transnational networks. Illegal activities are inextricably linked to trade by sea.
Some of these illicit activities, like drugs and weapons traffic, can be very difficult to detect. There is no specificity in the type of ship that carries them, so in order to detect them, in an appropriate amount of time, cross-agency collaboration is paramount.
On the other hand, illicit activities such as illegal fishing and unauthorised scientific research can be more easily controlled, by being specialised vessels. However, that is not an absolute truth because, depending on the size of the fishing vessels, they may or may not have to report their position, in addition to the fact that they are not as straightforwardly detected by coastal sensors.
2 Judiciary Police.
Both the European Union (EU) and the North Atlantic Treaty Organization (NATO) are counting on Portugal means to prevent and, if need be, deter any activity that could jeopardize the safety and security of ships passing through this large area of maritime responsibility. This is not an easy task as more threats assume a diffuse feature, not easily recognisable and requiring more of the surveillance systems and their operators.
Two different perspectives can be adopted concerning threats at sea. The first, maritime safety, has as a main goal to guarantee the safety of navigation and of those who are at sea, by preventing maritime accidents and, if not possible, deal with the outcome and the consequences that may arise from those accidents. It also has the goal of protecting the maritime environment and its sustainability by preventing the exploitation of resources and pollution. The second, maritime security, aims to combat illegal actions at sea (Sousa, 2013). This kind of threats are much more complex, because they depend on third parties seeking to exploit the vulnerabilities of coastal states, in covert actions.
Taking into consideration the sea’s economy growth, there is the need to create a system that has the capacity to integrate all the information coming from different sources.
The integration of all these sources of information will certainly allow to improve and increase maritime situational knowledge, contributing to a more conscious action throughout the decision cycle, making good use of time and financial resources.
By belonging to the National Emergency Service network, Maritime Rescue Coordination Centre (MRCC) allows the Portuguese Navy to give a quick and specialized response to emergency and rescue situations in its area of responsibility.
Centro de Operações Marítimas (COMAR)4, however, is the focal point for command and control of all the activity carried out by the Navy, having to be in constant coordination with all entities with responsibilities in marine areas under sovereignty, jurisdiction or national responsibility (Marinha, 2018).
COMAR “has an interagency and interdepartmental approach” (Marinha, 2018), not only on a national level (the Portuguese Navy, National Maritime Authority, Portuguese Air Force, SEF and PJ, among others) but also on an international level,
where several information networks coexist in order to improve the coordinated efforts of the different state departments, on their areas of jurisdiction and national responsibility. These networks include military and non-military information.
The fact that MRCC and COMAR occupy the same building is a substantial practical advantage. It allows access to different systems, therefore improving Maritime Situational Awareness (MSA), thus helping to monitor activities at sea.
When it comes to COMAR’s role in in the military defence functions and support of the State's foreign policy, it maintains a permanent monitoring on the missions of
Forças Nacionais Destacadas (FND)5, such as those missions under the guidance of the European Union and NATO in the fight against piracy in Somalia or NATO counter-terrorism missions in the Mediterranean (Marinha, 2018).
COMAR also maintains a continuous monitoring on all Navy’s vessels with assigned mission in national waters as well as on the means of the National Maritime Authority. It acts as a pillar in the management of Navy’s operational information. In order to do this, it relies on the Centro de Análise de Dados Operacionais (CADOP)6.
For this dissertation, it is also important to distinguish two almost interchangeable concepts such as surveillance and monitoring.
Maritime surveillance can be understood as the systematic observation of maritime areas by all means available, with the goal of controlling the movement of vessels or other vehicles, operating on the surface or sub-surface of the seas and oceans. The ability to continuously cover large areas, with features like accuracy, data discrimination and confidence describe what surveillance is all about.
Monitoring, on the other hand, can be distinguished from surveillance considering its main goal. The aim is to maintain and improve standard and safety procedures in order to have a better understanding of the environment by using actions belonging to surveillance, with this knowledge being continuously improved over time (Carolas, 2016). The monitoring therefore consists in controlling one or more parameters in order to detect anomalies.
5 National Abroad Forces.
1.1. Motivation
Each coastal state recognises the importance of the sea resources and the importance to take all measures so that what is his remains his, defending their rights in what concerns exploitation and exclusivity. Therefore sea presence is fundamental, and due to the vastness of maritime areas under Portuguese sovereignty or jurisdiction, that may not always be an easy task, opening the opportunity for thirds parties to use resources that do not belong to them. In order to ensure that laws and regulations are enforced, coastal states should bet on improving the surveillance on their areas.
As a matter of fact, most of the activities taking place in Portugal’s maritime area are not a direct, but a transitory threat. Nonetheless, it is important to avoid the absence of authority at sea, taking a special care to not disregard any surveillance measures. It is by maintaining a high level of maritime situational awareness, that Portugal can counteract any attempts of illicit activities, always being one step ahead.
1.2.
Topic’s relevance
The biggest problem regarding all the available data is the difficulty to transform data in information and then putting into practice all the acquired knowledge. There is so much data available that it is difficult to discern what is important and what can be put in second plan. It is when connections between data sets are analysed or context is introduced that some insight is usually gained, as it is represented in Figure 3.
Figure 3 - Data, information, knowledge and wisdom (context vs understanding) (Marinha, 2018).
The need to integrate tools that merge data from different sources and compile them into a single system is increasingly evident. At a time when illicit trafficking in the
sea surpasses values never seen before and illegal migration is a harsh reality, there is a pressing need to introduce means to help the decision making of who is on the ground seeking guidance.
At the level of the Portuguese Navy, as an end-user, this subject gains particular prominence. Having access to a software that could respond to the diversity of challenges that the naval units come cross would be an added value.
1.3. Goals
In this dissertation, the main goal is to answer the following question:
How to maximize the achievement of Maritime Situational Awareness by detecting anomalies using different sources of data?
However, in order to do so, it is important to gain some insight on the area and answer some questions derived from the above, such as:
What is Maritime Situational Awareness and what is the current state of it in Portugal?
What data sources contribute to a good Recognized Maritime Picture (RMP)? And which ones are available?
How can the data be used to detect anomalies in the maritime traffic?
1.4. Structure
The following dissertation is divided into 6 chapters, including introduction and conclusion. Chapter 2 consists of a literature review, where concepts as Maritime Situational Awareness, anomaly and anomaly detection will be addressed as well as a brief explanation will be presented on some data mining tools. Chapter 3 will consist on a description of the methodology and all the processes the data underwent since its collection to the moment they were inserted in PostgreSQL database. Chapter 4 will describe the scope of the study area as well as all the techniques used in the data analysis. Chapter 5 will present all the tests conducted and the respective results. The conclusion, will summarize what were the results, the difficulties felt and future projects that could be taken into consideration.
In order to protect data confidentiality, all information regarding vessel’s identity was modified. Any resemblance to reality is purely coincidental.
The referencing style present throughout this dissertation is American Psychological Association (APA).
C
HAPTER
2
LITERATURE REVIEW
2.1 Maritime Situational Awareness
2.2 Maritime Domain Data
2.3 Concept of Anomaly
2.4 Anomaly Detection
2.5 Data Mining Tools
2. Literature Review
2.1. Maritime Situational Awareness
Maritime Situational Awareness is a very important concept and must be fully understood. The first thing that must be comprehended is that MSA’s concept is not a static one (Pereira, 2010) and more often than not it does not result from the input of one single system but from the combination of several working together. To some authors, MSA is “the capability of understanding events, circumstances and activities within and impacting the maritime environment” (Arguedas, 2015). Other definitions go even further and say that MSA should facilitate the process of decision making and permit an effective operational response (Estado Maior da Armada, 2012).
The concept of Maritime Situational Awareness appeared based on an already existing concept, Maritime Domain Awareness (MDA), following a NATO summit in Riga, 2006. In May 2008, it was presented by NATO a MSA Concept Development Plan with the main purpose of implementing a MSA with a Doctrine, Organization, Training, Logistic, Leadership, Personnel, Infrastructures and Interoperability (DOTMLPII) approach (Veloso, 2015).
MSA seeks to obtain, as a final result, a fully clarified surface picture, receiving
to that end the contributions of several surveillance and monitoring systems as well as knowledge generated by other sources. If data is able to cover “all aspects of a situation of interest in a timely manner, one can then say that complete and continuous situational awareness has been achieved” (Martineau, 2011). However, it is important to understand that total situational awareness “would be akin to omniscience and achieving it would be a utopia” (Martineau, 2011).
In order to produce knowledge regarding the maritime domain by identification of patterns of the maritime community, reliable and continuous data must be collected from all kinds of data sources.
Therefore, the creation of safety applications that are capable of detecting behavioural patterns of ships and anomalies that indicate potential situations of infraction is not only feasible but of utmost importance. These applications might help the security forces clarifying the maritime picture. Only then will it be possible to take action in a timely manner, maximizing the use of resources and minimizing risks (Estado Maior da Armada, 2012). The goal is to have automation in the generation of alerts in order to trigger the corresponding actions.
In today’s world, the prime challenge of MSA is the “aggregation of large amounts of heterogeneous data and their transformation into useful and reliable information to support users in the decision making process” (Arguedas, 2015). From the analysis of a large volume and variety of data with spatial and geographic representation, using techniques that can detect connections between events, it is possible to provide mechanisms to draw certain conclusions (Arguedas, 2015).
In fact, there are so many sources of data nowadays that the issue now is not the lack of data but the overwhelming amount of it. Therefore, there have been developed several automation processes in order to deal with that amount of data. It is even considered that “to manually pore through and to analyse the information in a bid to identify potential maritime threat is tedious, if at all possible” (Chen, 2013).
The ability to extract knowledge that is useful, but is usually hidden, from data is becoming more and more important in the 21st century (Ahlemeyer, 2014). On a computational level, the industry has suffered numerous technological advances, in both the hardware and software sectors, being able to store, process and analyse a large amount of data with an increasingly ease.
2.1.1.
NATO’s role
NATO developed several systems that contribute to MSA. Baseline for Rapid Iterative Transformational Experimentation (BRITE) was developed as “part of the initiative Technology for Information, Decision and Execution (TIDE) superiority”. It is a “National Geospatial-Intelligence Agency (NGA) program of record that provides a client-server system for image dissemination” (North American Job Bank International Networking, n.d.).
Maritime Safety and Security Information System (MSSIS) is another one of these systems. It is “a freely-shared, unclassified, near real-time data collection and distribution network” (Maritime Safety and Security Information System, 2008). It collects Automatic Identification System (AIS) data from ships from member countries and broadcasts them almost in real time (Veloso, 2015). Its main goal is to increase maritime security and safety by promoting a “multilateral collaboration and data-sharing among international participants” (Maritime Safety and Security Information System, 2008). This allows to have a RMP at a very low cost.
Maritime Command and Control Information System (MCCIS) also contributes to MSA, by providing as well “a high quality RMP” (Maritime Safety and Security Information
System, 2008) and giving inputs to NATO’s Common Operational Picture (COP). MCCIS has appeared “as the C2 (Command and Control) tool of choice for NATO’s maritime component commanders” (Germain, 1997).
Another one of these systems is Fast Connectivity for Coalition Agents Program (FastC2AP). FastC2AP is a “human-interactive, rule-based program” which focus on helping operators in specifying “vessel behaviours and characteristics that drive alerts and prompt operators to analyse those vessels further” (National Research Council, 2008).
Combined Enterprise Regional Information Exchange System (CENTRIX) is an “operational level network, supporting regional commanders and their staffs at a variety of security levels” (Mitchell, 2013) which allows the exchange of a Common Operational Picture, e-mails with attachments, web-enabled services, chat and Voice over Internet Protocol (VoIP).
Networked Interoperable Real-Time Information Services (NIRIS) is a system that “displays real time maritime, ground, air tactical and theatre missile defence data received from control reporting centres” (Kowalczyk, 2009). It contributes by transforming data into interoperable information, based on NATO and commercial standards, by offering a package of services that allow data compilation and dissemination (Veloso, 2015).
2.1.2. Europe’s role
In 2008, a new project was embraced by European Union, being supported by the Council and European Parliament. Common Information Sharing Environment (CISE) was developed in order to establish itself as a system of information sharing, with the main purpose of expanding each country’s maritime surveillance. It was supported by the countries’ need to ensure safety and protection of the seas and oceans (Veloso, 2015).
The end result intended for CISE is to turn maritime surveillance the most accessible and coherent as possible between all individuals, not exactly to collect data. This would be accomplished by having automatic data sharing mechanisms that would allow access to relevant information in real time.
Maritime Surveillance in the Northern Sea Basins (MARSUNO), was created with the purpose of supporting CISE, overcoming legal, technical and administrative obstacles (Veloso, 2015) in what concerns the sharing of information beyond borders. It counted with the participation of 9 countries throughout 24 months: Belgium, Finland, France, Germany, Latvia, Lithuania, Estonia, Poland and Sweden as the central partner.
BlueMassMed (BMM), on its turn, was created with the intent of “increasing the interoperability between the existing control and location systems” and “evaluate the project’s partners capability of sharing surveillance information” in the areas where they intervene. It was supported financially by the European Commission and by Portugal, Spain, Italy, France, Greece and Malt (Instituto Hidrográfico, n.d.), and intended to centre its efforts on monitoring the maritime situation in the Mediterranean and Atlantic approaches, establishing the prototype on which collaboration should be expanded at European level (Pereira, 2010).
In order to developed CISE’s security component, other 7 initiatives were financed by EU, namely, European Border Surveillance System (EUROSUR), Protection of European seas and borders through the intelligent use of surveillance (PERSEUS), Integrated System for Interoperable sensors & Information sources for Common abnormal vessel behaviour detection & Collaborative identification of threat (I2C), Sea Border Surveillance (SEABILLA), Dolphin, New Services Capabilities for Integrated and Advanced Maritime Surveillance (NEREIDS) and Simulator for Moving Target Indicator System (SIMTISYS) (Veloso, 2015).
In the Portuguese Navy, the document that regulates the definition of Maritime
Situational Awareness is IOA 114 – Conceito de Conhecimento Situacional Marítimo7. It
was developed to be used in support of decision making regarding maritime operations (Estado Maior da Armada, 2012). In an ever changing environment such as the sea, subject to multiple threats and security issues, being able to have the upper hand is key. In order for that to happen, it is essential to continuously monitor the maritime environment so that superiority of information (Estado Maior da Armada, 2012) is attained and can be used to protect the security and the state’s authority. This superiority can be achieved by obtaining relevant data, processing it and creating connections between the different types of data and therefore turn data into information. This superiority is only possible if there is confidence and integrity regarding the information
received. So information, on a military level, is shared on a need to know basis. Access restrictions are justifiable, however it poses as “a major problem in the domain of anomaly detection” (Martineau, 2011).
The management of the sea is not an easy feat considering how many national and international entities are involved, sharing responsibilities, dependencies and lines of authority. Each one has their own goals and concerns, using different systems to store, analyse, fuse, validate and share data (Estado Maior da Armada, 2012). Data sharing, or its lack thereof, is one of the main obstacles in the search of maritime situational awareness. It is through data that one gains information and now, 21st century, more than ever, information is a tool that grants power. That is why data sharing has usually several deterring policies. This causes big discrepancies between the several systems that help to achieve MSA. The amount and disparity of data (often not interoperable) and information generated concerning the maritime domain is often a hindrance, making it hard to coordinate and use on an operational level.
The construction of a robust MSA capability faces different challenges that need to be overcome. As it is shown on Figure 4, these challenges can be of 4 different kinds (Estado Maior da Armada, 2012).
On a technical level, it is difficult to have a predefined architecture and ensure interoperability between the several systems. On a geographical point of view, the amount of sensors and systems required depend on the size and location of the area.
On an organizational standpoint, it is important to have an agile structure that allows responding to the different levels of performance in the maritime domain (Estado Maior da Armada, 2012). From a legal perspective, what immediately stands out, as
MSA Challenges
Technical Geographical Organizational Legal
mentioned before, is the data sharing policies, because each organization or agency has its own directives, concerning data distribution, that must be followed.
Although there is often certain interferences concerning information sharing and exchange, it is extremely advantageous. Firstly, it grants access to data that would not be possible to access by own means. Secondly and lastly, because it allows to save up resources and avoid unnecessary work and effort. In this way, it is not technical matters that pose so much of a problem but the policies for data sharing.
Generating MSA involves 5 different steps: acquisition, fusion and analysis, diffusion and archive (Estado Maior da Armada, 2012).
Having an archive where all the data is stored is of particular relevance considering new algorithms and methods can be applied to that data and tested, in order to generate automatic alarms that can help the operator. This is especially important considering that “human(s) are always in the loop. Systems are made to improve the performance of operators, not to fully replace them” (Martineau, 2011).
The Portuguese Navy counts with the support of several information systems, such as Oversee. Oversee is a software developed by the company Critical Software and is considered to be a “system of systems” (Estado Maior da Armada, 2017) because it integrates information from several systems and shows it in a user-friendly manner. It was first intended to assist SAR activities, however, because it has access to classified databases and systems, such as NATO MCCIS, it can be used on an operational level, aiding to increase MSA.
It essentially receives and allows the visualization of Global Maritime Distress and Safety System (GMDSS)8 alerts. However, it also allows the integration of others sources of information. Systems like AIS, Satellite – Automatic Identification System (SAT-AIS), Vessel Monitoring System (VMS), also known as Monitorização Contínua
das Atividades da Pesca (MONICAP)9 (European Economic Community, 1993), Long Range Identification and Tracking (LRIT) system, among others, can be inserted in Oversee.
8 GMDSS is an international system that through satellite technology and radio communication equipment aims to provide automated communication for ships in distress.
Currently, there are several projects that aim to improve MSA. The most recent one, is Maritime Integrated Surveillance Awareness (MARISA). It has, as one of the main goals, the fusion of heterogeneous data and information, creating a toolkit that allows an effective information sharing, the identification of possible risk situations and assist the process of decision making. It counts with the participation of 22 partners located in 9 European countries. Portugal assures its participation with Inovaworks (a national technological company), INESC-INOV (a development entity) and through the
Portuguese Navy with Centro de Investigação Naval (CINAV)10. It was through CINAV
that this dissertation topic was suggested in order to contribute, if possible, to MARISA project.
2.2. Maritime Domain Data
In general, data can have two origins: NATO systems or external commercial sources. Before going through several tools of fusion and analysis in order to produce information, it is necessary to compile and share data with other systems with the same degree of classification.
The data acquired on the geographic distribution of vessels can be divided into two groups, “self-reporting or observation-based” (Arguedas, 2015) according to the way the data is obtained.
There are several examples of self-reporting data, such as AIS, LRIT and VMS/MONICAP, each one of them with different purposes, such as collision avoidance, security and safety and fisheries monitoring (Arguedas, 2015).
Long-Range Identification and Tracking of ships is one of these sources and it was established in 2006 as an international system by the International Maritime Organization (IMO). LRIT system uses vessels’ satellite communications in order to transmit its information, such as position, which is transmitted at least four times a day. The European Union Cooperative Data Centre (EU CDC) tracks over 8000 ships per day and it aims to disseminate LRIT information on European ships around the world, being one of the largest LRIT distribution centres (European Maritime Safety Agency, n.d.). As a result, LRIT is one of the data sets used by the European Maritime Safety Agency (EMSA) and other organizations interfaces, being of great importance for maritime safety and awareness. AIS and MONICAP will be discussed later on, considering that, in spite
10 Portuguese Naval Research Centre.
of all these data sources, they are the ones that will be further analysed throughout this dissertation.
EMSA was developed in 2002 and it aims to decrease the risk of “maritime accidents, maritime pollution from ships and to prevent the loss of human life during the navigation” (Dorel, 2013). This is achieved with the creation of legislation, introducing measures regarding maritime safety and defence, which are generated in accordance with the already existing rules of the member states. EMSA is also responsible for providing information, upon request, to competent national authorities and European Union institutions. One example of this, is the on-going cooperation with COMAR, as EMSA provides permanent access to information regarding maritime awareness. Therefore, the collection of big sets of data is a must in order to maintain a constant monitoring of the seas.
Observation-based data, on its turn, is collected by passive or active sensors. Examples of this type of data are Synthetic Aperture Radar (SAR), space-based Earth Observation (EO) (Arguedas, 2015). These sensors’ detection capabilities depend on a variety of factors, whether they are of a more technical sort (e.g. resolution) or of an environmental nature (e.g. Sea state).
SAR main advantage is the fact that it benefits from “the long-range propagation characteristics of radar signals” (Sandia National Laboratories, n.d.) and the “information processing capability of modern digital electronics to provide high resolution imagery” (Sandia National Laboratories, n.d.). It is independent of flight altitude (providing a high resolution capability), independent of the weather (provided that the proper frequency range is selected) and it also has day/night capability due to its own illumination (Moreira, 2013).
2.2.1. AIS
AIS was developed with the main goal of providing itself “as a tool for maritime safety – vessel collision avoidance” (Tetreault, 2005), intended to be used by Vessel Traffic Services (VTS) in order to track and monitor vessel movements operating near their coasts and to assist ships’ watch-keepers. It is expected that AIS, as a VTS tool, would “be used in conjunction with traditional VTS sensors and tools” (Tetreault, 2005) to assist the VTS watch-stander to have a thorough and broad comprehension of the maritime traffic, allowing him to monitor the current situation and offer recommendations to mariners.
By providing coastal stations with the information required under “mandatory or voluntary reporting schemes as well as for VTS purposes”, AIS can help reducing “the work of the watch-keeper” (MCANET, n.d.).
Therefore, AIS is “an international standard for ship-to-ship, ship-to-shore and shore-to-ship communication of information” (Tetreault, 2005). It was regulated and normalized by the International Telecommunication Union (ITU) and implemented by IMO afterwards.
All International Requirements for carriage of AIS can be found on Chapter V, Regulation 19.2.4 of the Safety of Life at Sea (SOLAS) Convention. This regulation can be found in Annex A.
No matter the area where the ships are operating, across the ocean or near the coast, AIS works in an “autonomous and continuous mode” (Navigation Center, n.d.). For transmission, only one radio channel is necessary. The radios associated with the AIS consist of “1 full-range Very High Frequency (VHF) transmitter, 1 Digital Selective Calling (DSC) Ch. 70 receiver (used for frequency management and DSC polling), and 2 VHF Gaussian Minimum Shift Keying (GMSK) receivers” (Tetreault, 2005). However, in order to prevent problems regarding interferences in communication, each station transmits, as well as receives, more than 2 radio channels, with the following frequencies: “161.975MHz (AIS1) and 162.02MHz (AIS2)” (Melo, 2011) with the added possibility of shifting channels without any loss of communication.
There are two types of AIS, class A and class B. Class B AIS was designed as “a more economical, of smaller reach and of limited information transmitted alternative” (Melo, 2011). When compared to Class A AIS, it has an inferior reporting frequency.
AIS diverges from other kind of maritime equipment because it uses a protocol called Self-Organizing Time Division Multiple Access (SOTDMA). By not having to rely upon receiving any kind of stimulus for broadcasting, it can be set apart from other kind of equipment.
“AIS equipment self-organizes its broadcasts” (Tetreault, 2015) so that there is no interference regarding messages between AIS equipment operating in close proximity.
Each AIS station establishes “its own transmission schedule (slot)” taking into consideration “data link traffic history and knowledge of future actions by other stations” (Navigation Center, n.d.).
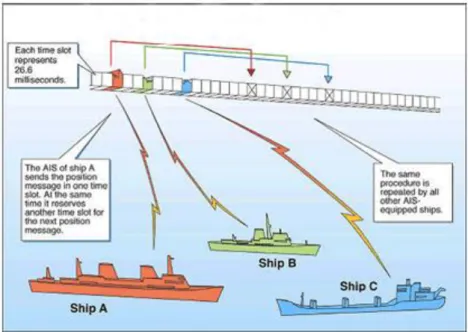
Every 60 seconds, 2250 time slots are established. As there is two frequencies, overall there are “4500 slots per minute available” (Melo, 2011). A simple position report regarding one AIS station is included into one of those 2250 slots. Each AIS unit automatically “determines what slots are available for its use, broadcasts its intentions for slot use to other units to allocate the slots, and transmits its messages” (Tetreault, 2015). Figure 5 represents this process.
Figure 5 –AIS Functioning – Slots (Navigation Center, n.d.).
Overlapping of slot transmissions is easily avoided by constant synchronization. The selection of each slot is “randomized within a defined interval, and tagged with a random timeout of between 0 and 8 frames” (Tetreault, 2015). Before changing its slot assignment, each station announces the new location and the respective timeout.
Regarding coverage, it depends on the height of the antenna, being AIS coverage similar to other VHF applications. Compared to radar, AIS has a slightly better performance when it comes to propagation. It is not usually affected by the weather, only by the “shielding of the transmitted signal by land masses and buildings” (International Maritime Organization, n.d.). In spite of this, its wavelength is significantly longer than radar, being able to reach around the contour of the land and even in certain circumstances behind small islands, if they are not too high.
In general, at sea, AIS has a range of 15 to 20 nautical miles. Base stations, on its turn, can expand the range up to 40 to 60 miles (Marine Traffic, n.d.), provided that aspects as the weather conditions, elevation, antenna type and obstacles surrounding the antenna are favourable.
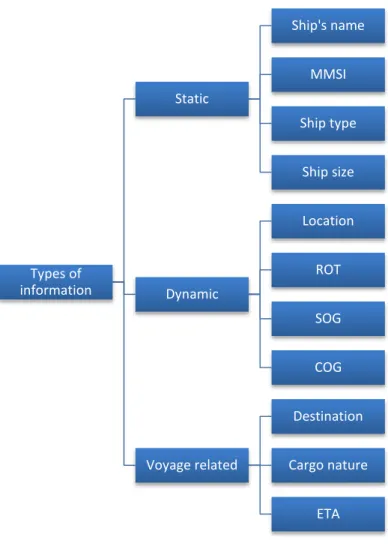
AIS can broadcast three types of information (Figure 6):
Static, which includes the ship’s name, Maritime Mobile Service Identity (MMSI)11, ship type, ship size, among others;
Dynamic, such as the ship’s location (latitude and longitude), its Rate of Turn (ROT), Speed Over Ground (SOG), Course Over Ground (COG);
Voyage related data such as vessel destination, cargo nature and Estimated Time of Arrival (ETA).
11 MMSI is a series of nine digits and its purpose is to uniquely identify stations, whether they are ship
Figure 6 – Example of information given by AIS.
These types of information are compiled into messages that are autonomously broadcast “at a regular time interval” and “can be received by on board transceiver and terrestrial and/or satellite base station” (Mao, 2016). Static information, as well as voyage related information is broadcast “every 6 minutes” (Tetreault, 2015) or as requested. On its turn, dynamic information is transmitted almost instantaneously, “every 2 to 10 seconds” increasing to “every 3 minutes” if the vessel is anchored, depending on each AIS class.
There is, however, some technical issues that arise when it comes to deal with AIS data.
Firstly, it is of utmost importance that all the information contained therein must be correctly inserted (concerning static and voyage related information) and functioning properly (when it comes to dynamic inputs).
Types of information Static Ship's name MMSI Ship type Ship size Dynamic Location ROT SOG COG Voyage related Destination Cargo nature ETA
Secondly, taking into consideration that there is a vast amount of data available, handling it is no easy feat. Making it useful for obtaining Maritime Situational Awareness is one of the main goals, but for that to happen several steps must be taken. Data validation, data correlation and data fusion are some of those steps. The integration with different systems is favourable but is not as straightforward as it may seem. Moreover, the storage of such a big volume of data and making it available for being analysed by expertise is another challenge that must be faced.
There are many AIS providers. One of them is Marine cadastre, which has data collected by the United States of America (USA) Coast Guard. It contains data from 2009 to 2014 on United States’ waters. Another one is Sailwx, which contains data related to a small portion of the ships worldwide. Only “those that participate in the World Meteorological Organization's program of voluntary at-sea weather reporting, and those vessels operating AIS transponders within range of a participating shore station” (Sailwx, n.d.) are contained in Sailwx database. Another one is Marine Traffic. This last one differs from the others by providing historical data at a certain cost, in relation to the volume of data requested and the processing desired (Marine Traffic, n.d.).
The data is delivered in Comma Separated Values (CSV) format and can be from terrestrial AIS receivers or Satellite AIS Receivers. As the name indicates, CSV files use the comma as a separator for each value in a text file. It can also use tab or semicolon to separate values. CSV files have several advantages, such as being a simple file, opened by text editors and easily manipulated in a programing level. It also consumes less memory than Excel files.
Although there are many AIS data providers, there is no “standard AIS
benchmark database in maritime research area” (Mao, 2016). This is a great inconvenience considering all the time, effort and money involved to have a usable dataset which can be used later on by different researchers. It also gains importance considering that there is no way of comparing different methods or algorithms for anomaly detection or motion prediction because there is not a unique database to test them.
“The Portuguese Navy has a network of AIS stations” (Soares, 2012). The data obtained from those stations is then directed “to a server in the Navy’s private network designated AIS server” (Soares, 2012).
The AIS server is located in Lisbon, more precisely in Direção de Tecnologias de
Informação e Comunicações (DITIC)12, that is an organ of Superintendência das
Tecnologias de Informação (STI)13 that assures the exercise of the technical authority in the field of Navy’s communication and information systems (Chefe do Estado Maior da
Armada, 2016). It receives, through Portuguese Navy communications’ infrastructures,
AIS messages that compiled enable the assessment of the world panorama.
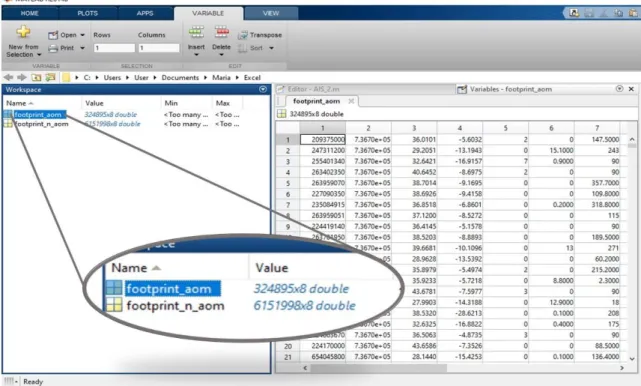
This raw data, which comes in National Marine Electronics Association (NMEA) format, is collected in MATLAB (MATrix LABoratory) files, of the type *.mat, containing what corresponds to 10 minutes of raw AIS data and is, later on, compiled in a daily file, acknowledged as “F” type file (Melo, 2011), F of footprint. Through Sistema de Apoio à
Decisão para a Atividade de Patrulha (SADAP)14 it is possible to have access to the files compiled in a daily basis. This system will be further analysed in the next section of this document.
As it is represented in Figure 7, each daily file is divided in two sub-matrixes, one that contains reports inside the Maritime Operational Area15 (footprint_aom.mat) and other that includes reports outside of it (footprint_n_aom.mat) (Melo, 2011).
12 DITIC - Directorate of Information and Communication Technologies. 13 Superintendence of Information Technologies.
14 SADAP – Activity Patrol Decision Support System. 15Área Operacional Marítima (AOM).
Figure 7 - AIS data, reports inside the Maritime Operational Area.
2.2.2. MONICAP
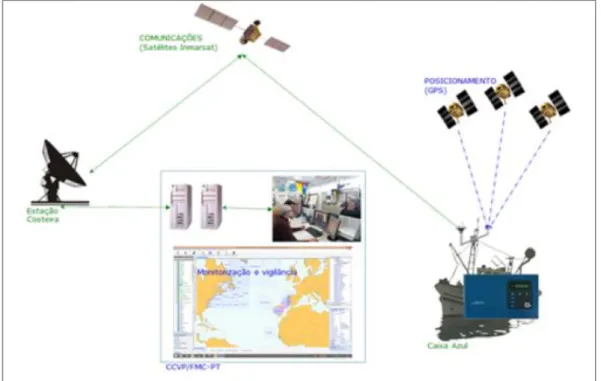
Another data type used in this dissertation is MONICAP. MONICAP or VMS, made its first appearance in 1987 (Bhargava, 2012) and is a system which aims to monitor the inspection of fishing activities (INOV, n.d.).
As it is shown in Figure 8, it uses “Global Positioning System (GPS) for the location and Inmarsat C for satellite communications between vessels and a ground control station” (INOV, n.d.).
Figure 8 - MONICAP system's functioning (Direção-Geral de Recursos Naturais, Segurança e Serviços Marítimos, n.d.).
MONICAP is currently “in operation in six countries, monitoring daily thousands of vessels” (XSealence, n.d.). According to Portuguese Law Decree 310/98, article 3, line b), all ships with an over-all length of 15 meters are required to have this system on board, regardless of the place where the vessels are carrying out their activities and the fishing gear they possess.
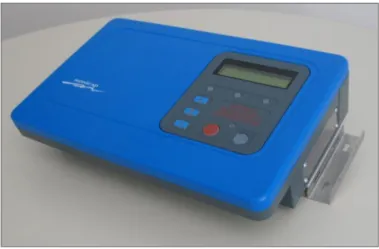
It is based on “telecommunications technologies and geographic information” and it consists of a “continuous monitoring equipment16 installed on fishing vessels, also labelled (…) as blue box” (European Economic Community, 1993). Figure 9 represents the designated “blue box”.
Figure 9 - Continuous monitoring equipment (XSEALENCE, n.d.).
It allows monitoring from shore, position and speed of ships on which the MONICAP box is installed. As it is shown in Table 1 and Figure 10, the MONICAP system sends data in the following format:
Table 1 – Example of MONICAP data format.
Vessel name
Community Fleet Register (CFR) number
dd-mm-yy Hh:mm:ss Longitude Latitude COG SOG
Altair PRT
000022323 24-01-2017 02:51:00 -27.32461232 62.14296321 089 7.40
Figure 10 - Example of MONICAP messages.
The “blue box” sends this data “through satellite to a coordinator centre in Norway” (Soares, 2012). The data is then distributed to the correspondent country, taking
into consideration the country’s maritime jurisdiction when it comes to fishing activities (Soares, 2012). In Portugal, the organ responsible for receiving the data is the Ministry of the Sea, through Direção-Geral de Recursos Naturais, Segurança e Serviços
Marítimos (DGRM)17 which in turn sends it to the Portuguese Navy, more specifically DITIC. MONICAP data is stored in SADAP information system, which was developed by the Portuguese Navy in 2006 (Melo, 2011). SADAP also allows access to “statistics regarding fishery inspection activities and access to the latest position of fishing vessels operating in the Portuguese Exclusive Economic Zone (EEZ)” (Soares, 2012). Every 2 hours, the position of all vessels equipped with MONICAP is sent to DITIC through e-mail.
Besides allowing the monitoring of the fishing activities, it allows the reception and transmission of meteorological data and assists in the control of maritime traffic.
MONICAP’s biggest advantage is its high reliability. It has several mechanisms that guarantee that the box equipment is not violated by presumable transgressors who would want to cover up illicit activities. That is what separates MONICAP from AIS data, the permeability to external interference. One disadvantage is the way the data is received, via e-mail, streaming near real-time would be best. In addition, the field with the vessel name can be vague considering that the names can repeat themselves. However, with the appearance of the Community Fleet Register number (CFR) that no longer poses a problem.
AIS and VMS are disparate and independent “tracking systems”. Although each one of them has its own advantages, by correlating both data sources it is possible to accurately build a specific track of a ship and identify its activity. AIS can be used to deal with the VMS outages, which is not a rare event, and VMS can help corroborating some of the AIS data. The main differences between AIS and VMS are presented in Table 2.
17 General Directorate for Natural Resources, Safety and Maritime Services. It results from the fusion of
Instituto Portuário e dos Transportes Marítimos (IPTM) with Direção-Geral das Pescas e Aquicultura
Table 2 – AIS and VMS comparison (Navigation Center, n.d.).
2.3. Concept of Anomaly
Firstly, one must clarify that there is no consensus on the meaning of anomaly. From the dictionary, anomaly can be considered a “deviation from the common rule, type, arrangement, or form” or even as “an incongruity or inconsistency” being often a synonym of “peculiarity” (Dictionary, 2018). The meaning of pattern is also relevant here. By definition, “a pattern is composed of recurring events that repeat in a predictable manner” (Martineau, 2011). What can be predicted is often considered as “normal” and what cannot, is considered as anomalous.
However, the boundary between what is regarded as normal and abnormal is very thin, considering that the prediction of normal behaviours is not an easy task. This is especially true when the “anomalies are the result of malicious actions” (Chandola, 2009), with the goal of masking anomalous observations as normal. It should be kept in mind that what is normal is often changing and evolving.
Two concepts that often are used undistinguishably is abnormality and threat. Although usually threats are anomalies, not all anomalies are considered threats. In fact, for some, “an anomaly is only a threat in context” (Seibert, 2009). To be able to classify an anomaly, whether or not it poses a threat, is an advantage because it allows to handle them in order of priority.
Several types of anomalies can be considered, falling into the following categories:
Point anomalies: if a certain data instance stands out from the rest of the data as being anomalous then it is considered a point anomaly.
Contextual Anomalies (or conditional anomalies): data instances that under a certain context gain another dimension and fall out of the ordinary. It is only when
the context is introduced that the data may be classified as anomalous, otherwise it does not stand out.
Collective anomalies: in this type of anomaly an individual data instance on its own does not attract attention as an anomaly. However, the occurrence of a group of data instances together may be considered as anomalous. Figure 11 helps to better understand this type of anomaly. It shows the output of a human electrocardiogram and the highlighted region represents the anomaly: a low value for an abnormally long time (Chandola, 2009).
Figure 11 - Collective Anomaly example (Chandola, 2009).
2.4. Anomaly Detection
Although the majority of the systems were developed with the purpose of raising situational awareness, they can be used in anomaly detection. Due to the amount of data being generated every day, it is necessary to “sift through large quantities of data and highlight elements worthy of interest” (Martineau, 2011).
The problem of anomaly detection can be quantified as a “two class classification problem” (Gonzalez, 2002), as normal or abnormal.
One of the things to be done first is to identify extreme values in the dataset or data inconsistencies. An example of this can be an AIS transmitter that stops its transmission in an area that supposedly has coverage or AIS records that register abnormally high speeds.