UNIVERSIDADE DE LISBOA
FACULDADE DE CIÊNCIAS
DEPARTAMENTO DE FÍSICA
Monte Carlo LINAC Simulations using PRIMO
for IMRT Treatment Verification
Mestrado Integrado em Engenharia Biomédica e Biofísica
Perfil de Radiações em Diagnóstico e Terapia
Vanessa Cristina Inácio Pita
Dissertação orientada por: Professor Doutor João Miranda Santos
Professor Doutor Luís Filipe Peralta
i
Acknowledgments
The realization of this project was an achievement to my professional life as much as it was an experience for my personal life. I would like to express my sincere gratitude to all of those who made it possible and helped me to overcome all the adversities.
Dr. João Santos, I would like to thank you for the opportunity to join me in Medical Physics, Radiobiology and Radiation Protection Group, in Porto IPO Research Center (CI-IPO); and also for guiding me in this project, being always available and motivating me with your enthusiasm for this subject.
Dr. Anabela Dias, thank you for the supervision provided in partnership with Dr. João and for all the help given.
Alessandro, the huge knowledge in Monte Carlo and your ideas were an asset for this work. Thank you so much for sharing them with me and for always making things look simpler than I figured.
Bruno, Fábio, Filipa, Filipe, Rafael, Rita, Susana, e Vera, ex- interns of the service and frequent presence in laboratory 2, a big thank you to everyone. Without you my adaptation process to IPO would have not been so easy. Thank you for the affection, for the concern and for the friendship and all the good moments we shared, I will never forget each of you.
Dra Joana, Diana, Sofia and all the Medical Physics Department of Porto IPO, with no exception, you were incredible to me. Thank you for your friendliness, for always being very helpful to me, and for welcoming me so openly.
Professor Luis Peralta, I am thankful to you for being my internal supervisor and also for your availability and concern.
Sofia, Sílvia, Raquel and Débora, my dear friends, thank you very much for your regular presence in my life in Porto and for always being with me.
My dear Fábio, your strength and unconditional support in the final phase of this project was crucial to me. Therefore, an enormous “thank you” for always believed in me.
Irene, Paulo, João and my whole family, I have no words to express my gratitude to you, for all you have done for me. Without your support, none of this would have been possible.
ii
Resumo
As simulações de Monte Carlo são consideradas o método mais eficiente para executar cálculos de dose absorvida em radioterapia externa, porque fornecem uma descrição muito detalhada e completa dos campos de radiação e do transporte de partículas nos tecidos. Existem atualmente vários códigos de Monte Carlo neste contexto, mas este trabalho focar-se-á no PRIMO. O principal objetivo com o desenvolvimento deste projeto é mostrar que o PRIMO é uma ferramenta com enorme potencial para simular tratamentos de IMRT, e que por esta razão pode ser muito útil na verificação clínica destes tratamentos.
A radioterapia de intensidade modulada (IMRT, do inglês Intensity-Modulated
Radiation Therapy), resulta da evolução da técnica de radioterapia conformacional
tridimensional (3D-CRT, do inglês Three-Dimensional Conformal Radiotherapy). Esta veio acrescentar à conformação geométrica do feixe de radiação, a capacidade de modulação da intensidade do mesmo. Por ser extremamente precisa a aplicação de um feixe de radiação nesta técnica, é possível aplicarem-se elevadas doses de radiação ao tumor, preservando ao máximo os tecidos saudáveis. Contudo, esta técnica requer um planeamento mais complexo e um maior número de profissionais envolvidos desde o planeamento até à execução do tratamento.
Antes de ser efetuado um tratamento de IMRT é necessário fazer uma verificação precisa da dose que será administrada ao paciente, recorrendo a ferramentas de garantia do controlo da qualidade. Com estas, são comparadas as distribuições de dose adquiridas com um fantôma com as simuladas no sistema de planeamento do tratamento. Para que o tratamento seja aplicado a um paciente, é necessário que a compatibilidade seja superior a 95%, utilizando um índice gama a 3% e 3mm, o que não ocorre sempre. Quando este nível de concordância não é atingido é necessário analisar o que influenciou esse resultado, e por vezes refazer o plano de tratamento, sem que grandes conclusões acerca desta não concordância sejam apontadas. Uma vez que, para realizar estes testes, é utilizada uma matriz com várias câmaras de ionização separadas entre si, neste caso em concreto, uma matriz com 729 câmaras de ionização separadas por 1 cm, é associado a esta medição um dado erro. Este erro poderá estar, por vezes, na origem da não concordância entre o planeamento efetuado e a sua irradiação num fantoma. Por esta razão, nestas situações, seria interessante a existência de um método alternativo de teste para contrapor estes resultados, como por exemplo aqueles que têm por base os cálculos de Monte Carlo, tal como é o caso do PRIMO.
O PRIMO é um programa de simulações de Monte Carlo, que tem por base o código PENELOPE. Este permite que sejam calculadas distribuições de dose em fantômas ou num
iii paciente, com a precisão característica dos métodos de Monte Carlo. Contudo, contrariamente ao que acontece com a maioria dos programas de Monte Carlo, o PRIMO apresenta a particularidade de ter uma interface gráfica muito apelativa ao utilizador, sendo muito intuitivo, e por isso de fácil utilização. Este programa permite escolher o acelerador linear a utilizar, recorrendo a uma base de dados disponibilizada pela IAEA, e definir muitos outros fatores (energia nominal, SSD, tamanho do campo, etc.), tal como ocorre aquando de uma aquisição de distribuições de dose num fantôma. É por este motivo, que se acredita que este programa poderá ser um ótimo complemento à verificação e aprovação de tratamentos de IMRT, tendo sido esta razão pela qual o programa foi escolhido para realizar este trabalho.
Tratando-se de um programa bastante recente, a primeira etapa deste trabalho consistiu na validação do mesmo para os aceleradores utilizados. Este processo consistiu na comparação das curvas de dosimetria básica: o perfil que mostra a percentagem de dose em profundidade (PDD, do inglês Percentage Depth Dose), e ainda os perfis transversais X e Y.
Na prática, estas curvas são medidas diretamente num LINAC, utilizando um tanque de água para a sua aquisição e os seus resultados foram usados para a comparação com os dados simulados. Esta medição é efetuada a cada 6 meses (ou sempre que haja intervenções no acelerador que as justifiquem), no sentido de verificar se as curvas medidas se encontram dentro dos parâmetros aceitáveis, por comparação às curvas obtidas aquando da instalação do LINAC e sua consequente aceitação (processo designado comummente por commissioning). Para escolher as curvas a usar na validação do programa, foi realizado um estudo sobre a sua evolução ao longo do tempo, que resultou na escolha do PDD e perfis laterais obtidos na aceitação do aparelho.
No PRIMO, estas curvas foram simuladas, para o mesmo aparelho utilizado nas medições práticas, num fantoma equivalente ao tanque de água, já existente no programa. O LINAC escolhido para este estudo foi um CLINAC 2300 da Varian, por ser um aparelho existente no serviço de Radioterapia do IPO do Porto e também no PRIMO. A validação foi um processo efetuado por tentativa e erro. A cada simulação se alterava um dado parâmetro (energia inicial, focal spot, técnica de redução da variância, etc.). Quando terminava a simulação, o PDD e perfis laterais eram comparados com as curvas já selecionadas. Se os resultados não apresentassem um grau de concordância de 95% ou mais, segundo o índice gama a 2% e 2mm, alterava-se um parâmetro e refazia-se a simulação. Quando os resultados simulados apresentaram boa concordância, o programa foi validado e o trabalho prosseguiu, rumo ao seu objetivo final. Relativamente a este método de comparação, é pertinente referir que este índice gama é o critério de comparação também utilizado na prática clínica, embora nesse contexto se use o índice gama para 3% e 3 mm.
iv A comparação das curvas de dosimetria básica simuladas e medidas foi realizada diretamente no PRIMO, nesta etapa inicial. Contudo, para se poder progredir neste trabalho seria necessário comparar imagens e não curvas, isto é comparar distribuições de dose 2D/3D em vez de 1D, o que não é possível usando o PRIMO. Por esta razão, os resultados obtidos nas simulações com o PRIMO tiveram de ser exportados e transformados em imagens DICOM, com o auxílio de funções criadas utilizando o Matlab, para que se pudesse realizar as comparações utilizando outro programa. O programa mais usado neste contexto foi o Verisoft, que é o programa utilizado nas comparações efetuadas aquando da verificação dos tratamentos de IMRT.
A segunda etapa consistiu na adição do MLC aos campos simulados e, na sua consequente, validação. Para isso, foi simulado um campo 10x10 cm2 com um MLC estático tendo uma dada conformação. Esse campo simulado pelo PRIMO foi comparado com o mesmo campo simulado pelo TPS, e também com o mesmo campo irradiado no LINAC. No final, as três modalidades foram comparadas entre si e todas tinham de ser compatíveis, segundo os mesmos critérios de comparação do índice gama. Quando essa compatibilidade foi encontrada, considerou-se o MLC validado e passou-se à fase seguinte.
O último passo neste projeto foi a simulação de um campo 10x10 cm2 com MLC dinâmico. Este passo é equivalente a fazer a simulação de um campo de IMRT na técnica que utiliza o MLC por segmentos. Nesta fase foi preciso compilar 89 campos que, no final, perfizeram um campo de IMRT. Esse campo simulado foi, à semelhança do ocorrido anteriormente, comparado também com a sua simulação pelo TPS e irradiação no LINAC. Uma vez verificada uma compatibilidade de 96% entre o campo simulado e medido, para um índice gama a 2% e 2mm, ficou demonstrada a potencialidade do programa para simular tratamentos de IMRT usando simulações de Monte Carlo.
Este projeto foi um estudo preliminar à simulação de tratamentos de IMRT usando o PRIMO, no qual, no final, se conseguiu simular um plano de IMRT com sucesso, pois este apresentou uma concordância aceitável com os resultados experimentais. Apesar de este trabalho ter muito por onde ser continuado, pois estudos mais aprofundados sobre os tratamentos mais complexos são necessários, os resultados corroboram a tese de o PRIMO ser uma ferramenta muito promissora para a simulação de tratamentos de IMRT em ambiente clínico, em especial na garantia de qualidade dos mesmos.
Palavras-chave: Radioterapia; IMRT; Simulações de Monte Carlo; PRIMO; Teste do índice gama.
v
Abstract
Monte Carlo (MC) approach is considered the gold standard method to perform absorbed dose calculations in external radiotherapy because it provides the most detailed and complete description of radiation fields and particle transport in tissues. Several codes are available and recently a new MC Penelope based code and graphic platform named PRIMO was developed. PRIMO has a user-friendly approach, a suitable and competitive characteristic for clinical activity. Nevertheless, advanced features such as Intensity Modulated Radiotherapy (IMRT) are not introduced yet. The aim of this work is to have a preliminary result on the feasibility of MC simulation of IMRT procedures, making use of the PRIMO software, showing that it can be an useful tool in clinical verification of IMRT treatments.
The first stage of this work was PRIMO validation for a Varian Clinac 2300, the same LINAC model used in practical acquisitions. This process consisted in comparing basic dosimetry curves acquired on LINAC using water tank with PRIMO simulations of them. Once
Percentage Depth Dose (PDD) and lateral profiles X and Y simulated and acquired in practice
showed compatibility higher than 95%, using the gamma index criteria with 2% and 2mm, the program is validated.
After validation, Multileaf Collimator (MLC) was added and validated. To achieve this goal, a 10x10 cm2 field with a static MLC with a given conformation was simulated. This field simulated by PRIMO was compared to the same field simulated by the TPS, and also with the same field irradiated on LINAC. In the end, the three methods were compared and all had to be compatible, according to the same gamma index comparison criteria. When this compatibility was found, MLC was validated and the work could proceed to the next stage.
The last step in this project was the simulation of a 10x10 cm2 field with dynamic MLC. At this stage it was necessary to build 89 fields that in the end, their sum make one IMRT field. As it had happened before, this simulated field was also compared with its simulation by TPS and its irradiation on LINAC. The compatibility between them was checked using the gamma index criteria of 2% and 2mm and it was found that 96% of the points were coincident. This fact demonstrated PRIMO capability to simulate IMRT treatments and consequently, IMRT treatments verification.
vi
List of Communications
Resulting from the work presented in this thesis a communication was presented in one of the most important conferences in radiotherapy around the world, organized by the European Society for Radiotherapy & Oncology (ESTRO), the ESTRO 35. Bellow is the communication bibliographic reference:
V. Pita, A. Esposito, A.G.Dias, J. Lencart, J.A.M. Santos, “PRIMO software as a tool for Monte Carlo treatment quality control in IMRT: a preliminary study”, poster presentation in ESTRO 35, Turin, Italy, April 2016.
vii
Acronyms
AAA Anisotropic Analytical Algorithm
CT Computed Tomography
CTV Clinical Tumor Volume DCS Differential cross sections
DICOM Digital Imaging and Communications in Medicine
DVH Dose volume histogram
EPID Electronic Portal Imaging Device
FWHM Full width at half maximum
GTV Gross tumor volume
IAEA International Atomic Energy Agency
IMRT Intensity Modulated Radiation Therapy
LINAC Linear accelerator
MC Monte Carlo
MLC Multi Leaf Collimator
MRI Magnetic Resonance Imaging
MU Monitor Units
OAR Organ at risk
PBC Pencil Beam Convolution PDD Percentage Depth Dose PET Positron Emission Tomography
PHSP Phase-space
PTV Planning Tumor Volume QA Quality Assurance
SBRT Stereotactic Body Radiotherapy
SRS Stereotactic Radiosurgery SRT Stereotactic Radiotherapy SSD Source to Surface Distance TPS Treatment Planning System VRT Variance Reduction Technique
viii
List of Figures
Figure 2.1 – Diagram of a linear accelerator in photon mode [10]. ... 6
Figure 2.2 – Multileaf collimator [12]. ... 7
Figure 2.3 – Main components of a LINAC [11]. ... 8
Figure 2.4 - Basic design of a cylindrical Farmer type ionization chamber [15]. ... 9
Figure 2.5 – Water tank phantom for basic dosimetry[18]... 10
Figure 2.6 – Geometrical PDD definition. Q is an arbitrary point at depth Z and P is the point at Zmax. A corresponds to the field size [11]. ... 11
Figure 2.7 – PDD curves in water for various photon beams at SSD of 100 cm [11]. ... 11
Figure 2.8 – Beam profiles of 10 MV at various depths in water, for field sizes of 10 cm x 10 cm and 30 cm x 30 cm[11]. ... 12
Figure 2.9 – a) 3D Conformal RT technique using uniform beams; b) IMRT technique using non uniform beams [17]. ... 15
Figure 2.10 – Beam incidence and dose color wash on 3D-CRT (on the left) and Beam incidence and dose color wash on IMRT(on the right) [21]. ... 15
Figure 2.11 – Solid water phantom used in IMRT treatments quality control [45]. ... 21
Figure 2.12 – Scheme that has all the components of PRIMO [55]. ... 23
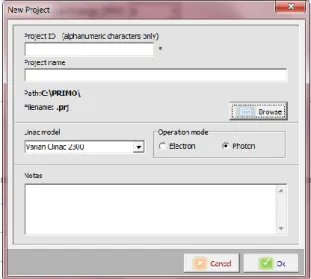
Figure 3.1 – PRIMO window that opens when new Project is selected... 28
Figure 3.2 – Parameters of Segment 1. ... 28
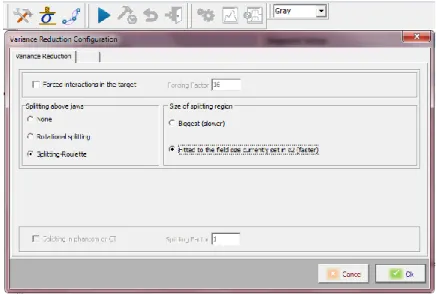
Figure 3.3 – Variance reduction configuration for s1. ... 29
Figure 3.4 – Simulation configuration. ... 29
Figure 3.5 - Parameters of Segment 2. ... 30
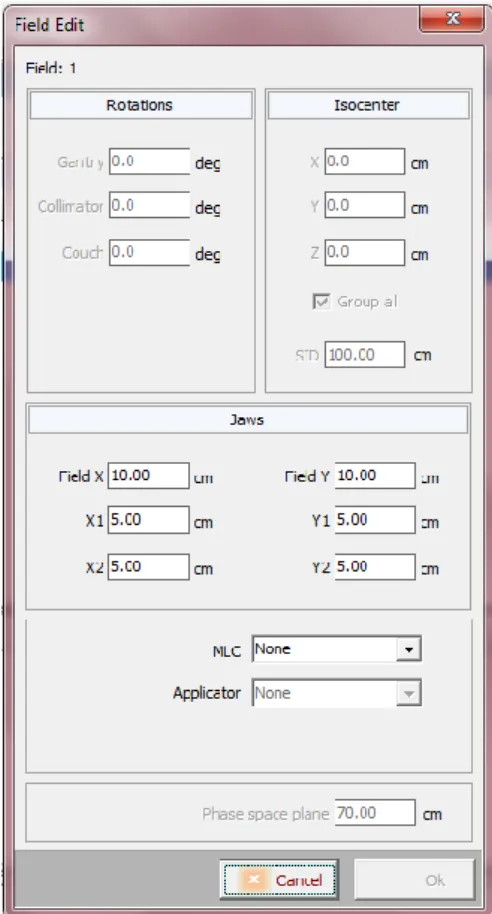
Figure 3.6 – Configuration of the irradiation field. ... 31
Figure 3.7 - Parameters of Segment 3. ... 31
Figure 3.8 - Variance reduction configuration for s3. ... 32
Figure 3.9 – Solid water phantom used in IMRT treatments quality control in Porto IPO being mounted on the LINAC table for a verification procedure. ... 35
Figure 3.10 – PTW matrix of 27 x 27 cm2 formed by 729 ionization chambers, spaced by 1 cm, which is used in the solid water phantom at IMRT treatments quality control [45]. ... 35
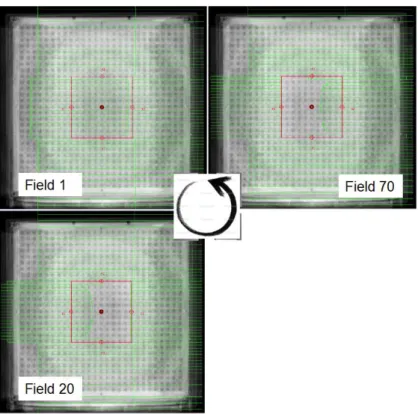
Figure 3.11 – MLC static configuration. ... 37
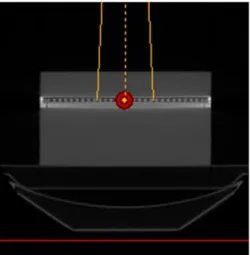
Figure 3.12 – Example of Dynamic IMRT divided into 89 static MLC shaped fields. ... 37 Figure 3.13 – Simulation Setup. The red mark indicates the isocenter placed at the center of the ion chamber array. The isocenter is at 100 cm distance from the beam source. The
ix numerical voxelized phantom is created by the internal conversion tool of PRIMO, once the CT
scan calibration curve is introduced. ... 38
Figure 4.1 - Maximum dose depth. ... 40
Figure 4.2 – Flatness over the years for lateral profile X. ... 41
Figure 4.3 – Symmetry over the years for lateral profile X. ... 41
Figure 4.4 - Flatness over the years for lateral profile Y. ... 42
Figure 4.5 - Symmetry over the years for lateral profile Y. ... 42
Figure 4.6 – Number of histories in function of the simulation time. ... 44
Figure 4.7 – PDDs from simulations with the same conditions but with different time as stop criteria. A – PDD from simulation with 1.97 x 10⁶ histories. B – PDD from simulation with 9.37 x 10⁶ histories. ... 45
Figure 4.8 – Percentage of passing points in function of the number of histories. ... 46
Figure 4.9 - Percentage of passing points as function of the energy. ... 47
Figure 4.10 – Illustration of lateral profile variation when increasing focal spot. ... 48
Figure 4.11 - Percentage of passing points in function of splitting factor. ... 49
Figure 4.12 - Comparison between Clinac 2300 (DHX5) PDD from 2011 and corresponding PRIMO simulation. The gamma function analysis (2%, 2mm) showed that 100% of the points was lower than 1. ... 50
Figure 4.13 - Comparison between Clinac 2300 (DHX5) lateral profile Y from 2011 and corresponding PRIMO simulation. The gamma function analysis (2%, 2mm) showed that 90.54% of the points was lower than 1. ... 50
Figure 4.14 – Phantom Setup. ... 50
Figure 4.15 – Comparison between Clinac 2300 (DHX5) PDD from 2011 and corresponding PRIMO simulation. The gamma function analysis (2%, 2mm) showed that 99.66% of the points was lower than 1. ... 51
Figure 4.16 – Comparison between Clinac 2300 (DHX5) lateral profile X from 2011 and corresponding PRIMO simulation. The gamma function analysis (2%, 2mm) showed that 100% of the points was lower than 1. ... 52
Figure 4.17 - Comparison between Clinac 2300 (DHX5) lateral profile Y from 2011 and corresponding PRIMO simulation. The gamma function analysis (2%, 2mm) showed that 100% of the points was lower than 1. ... 52
Figure 4.18 – PRIMO simulation results. ... 54
Figure 4.19 – Image output created by MATLAB from PRIMO notepad document. ... 54
Figure 4.20 - Comparison between PRIMO simulation and LINAC irradiation of an open field. 55 Figure 4.21 - Comparison between PRIMO simulation and TPS of an open field. ... 56
x Figure 4.22- Comparison between TPS and LINAC irradiation of an open field. ... 57 Figure 4.23 – Comparison between PRIMO simulation and TPS of a static MLC field. ... 58 Figure 4.24 - Comparison between PRIMO simulation and LINAC irradiation of a static MLC field. ... 59 Figure 4.25 - Comparison between TPS and LINAC irradiation of a static MLC field. ... 60 Figure 4.26 – Gafchromic film after the dynamic field irradiation... 61 Figure 4.27 – 2D Comparison obtained in Doselab between dynamic field measured with a gafchromic film and with the same measurement in ion chamber matrix. The gamma function analysis (3%, 3mm) showed that 98.8% of the points was lower than 1. ... 61 Figure 4.28 – A - Dose distribution for the dynamic IMRT treatment, measured with ionization chamber array, placed at 100 cm distance from the LINAC head under 5 cm of water equivalent. B – Dose distribution at the matrix for the simulated dynamic plan. C - Comparison between PRIMO simulation and LINAC irradiation of a dynamic MLC field. ... 62
xi
Table of Contents
Acknowledgments ... i
Resumo ... ii
Abstract ... v
List of Communications ...vi
Acronyms ... vii
List of Figures ... viii
Table of Contents ... xi
1 Introduction ... 1
1.1 Motivation ... 1
1.2 Intensity modulated radiotherapy (IMRT) ... 2
1.3 Monte Carlo LINAC simulation ... 3
1.4 Objectives of this work ... 5
2 Experimental and theoretical background ... 6
2.1 Linear Accelerators ... 6
2.2 Dose measurement ... 8
2.3 Phantoms for basic dosimetry ... 9
2.4 Percentage Depth Dose (PDD) ... 10
2.5 Lateral Profiles acquisition and characterization ... 11
2.5.1 Flatness ... 12
2.5.2 Symmetry ... 13
2.6 Modern Radiotherapy Techniques ... 13
2.6.1 3DCRT ... 13
2.6.2 IMRT ... 13
2.6.3 Volumetric Modulated Arc Therapy - VMAT ... 15
2.6.4 Tomotherapy ... 16
2.6.5 SRS, SRT and SBRT ... 16
2.6.6 Treatment monitoring ... 16
2.6.7 Image guided patient positioning techniques ... 17
2.7 Treatment Planning System (TPS) ... 17
2.7.1 Treatment planning ... 17
2.7.2 Dose calculation algorithms ... 18
xii
2.7.4 Dose distribution verification techniques ... 20
2.8 Phantoms for IMRT verification ... 20
2.9 Monte Carlo dose distribution calculations ... 21
2.10 PRIMO (Penelope based MC code) ... 23
2.11 Use of Gamma Index function for MC simulations validation ... 24
3 Methodology ... 26
3.1 Basic Dosimetry ... 26
3.1.1 Basic Dosimetry Curve Analysis ... 26
3.2 PRIMO Simulation ... 27
3.3 PRIMO validation ... 32
3.4 PRIMO output problem ... 33
3.5 Quality Assurance (QA) Test ... 34
3.6 MLC Tests ... 36
4 Results and Discussion ... 39
4.1 Basic Dosimetry Curves Analysis ... 39
4.2 PRIMO validation ... 43
4.3 PRIMO output problem ... 53
4.4 MLC Tests ... 54
5 Conclusions and Future Work ... 63
Bibliography ... 67
Appendices ... i
Appendix A ... ii
A.1. Functions to write a new PRIMO file ... ii
A.2. Functions to read and interpret PRIMO files using a slab phantom in the simulation ...iv
1
1 Introduction
1.1 Motivation
IMRT is a technique that has been progressively implemented since the 90s, in the United States and in Europe. Initially, it started as a technique only used in international reference institutions, but nowadays a number of smaller radiotherapy departments have it also implemented. In Portugal, the scenario is not different, with IMRT being implemented in more and more hospitals. This is a technique that allows the geometric conformation of the radiation beam to the target volume with a high accuracy. Simultaneously, it allows the modulation of the beam intensity, which creates fluence maps according to different tumor activity [1]. Thus, the results of IMRT clinical application were promising, with direct impact on the improvement of patient's life quality, decreasing some adverse effects of therapy [2].
However, IMRT treatments needs supplementary quality assurance tests before its application on patients, in addition to those necessary in other conventional radiotherapy techniques. These tests have as goal the comparison between the plans calculated by the treatment planning system (TPS) with its application to a phantom. Thus, the compatibility between them is estimated. The agreement between them is calculated based on the gamma index. If compatibility is higher than 95%, to a gamma index on 3% and 3mm, the treatment is approved.
Sometimes this compatibility is not achieved and, in some cases, there is no apparent reason to that. The usage of matrix detectors to the practical acquisition of dose fluence is pointed out as possible cause for this incompatibility, because the matrix has spaces with no detectors. In IPO Porto is used a PTW 27x27 matrix, which has 729 ionization chambers spaced by 1 cm. The spaces between chambers have to be interpolated which can be an error source. For this reason, more accurate systems to calculate the applied dose profiles would be helpful in this situation.
Nowadays, Monte Carlo simulations are pointed out as one of the most accurate methods to calculate dose distributions in radiotherapy, because of the high range of samples, which allows a dose calculation very close to reality. However, these methods require long time of computation and are not much user friendly. Recently, a new program of dose calculation using Monte Carlo, named PRIMO, was developed with the advantage of simplifying the calculation process to the users, becoming faster and user-friendly. PRIMO is an excellent tool of dose distribution calculation, which appears to be very useful in those cases of
2 IMRT treatment verification that are not compatible because no apparent reason. This fact arose as motivation for the development of this work, because it is believed that within this project interesting things about IMRT treatments simulation with Monte Carlo and about IMRT treatments verification could be found out, or at least, a big step in this direction.
1.2 Intensity modulated radiotherapy (IMRT)
Intensity Modulated Radiation Therapy (IMRT) is a high precision radiotherapy technique that enables the administration of high doses of radiation to the target volume, while minimizing the dose to normal surrounding tissue very effectively. This kind of dose distribution is achieved through application of several radiation beams with different incident angles and different radiation intensities. Thus, a non-uniform dose distribution is created, being conformed to the structures undergoing treatment, whether they are concave or convex [3]. When compared to conventional radiotherapy techniques, IMRT has the advantage of deliver higher intensity dose, minimizing the side effects in healthy tissues and organs surround.
The treatment process begins with the planning Computed Tomography (CT) scan, which is sent to the 3D planning system, so that the medical oncologists could delineate the target volumes and organs at risk. In some cases other image modalities are needed to plan an IMRT treatment, such as Magnetic Resonance Imaging (MRI) or Positron Emission Tomography (PET), which are fused with the CT planning to help doctors to delineate the volumes of interest.
In IMRT the plan is made by a technique called “inverse treatment planning”, which means that minimum and maximum doses, required for tumor control, are prescribed in the target volumes. The same thing happens to healthy tissues, in which are also prescribed maximum doses. Thus, the dose distribution fits precisely around the tumor or target volume, saving the healthy tissues.
In general, this modality of radiotherapy uses about five to nine radiation fields oriented around the patient and administered by linear accelerators (LINAC) collimation systems with multiple leaves, which are called MLC (Multi Leaf Collimator). The dose distribution adapted to the volumes to treat is achieved because of the movement of the MLC leaves and because of the incidence angle of the beams [4], as already referred.
It is a highly complex technique in which a large number of professionals are involved, such as radiation oncologists, dosimetrists, radiation technologists and medical
3 physicists. The complexity of the process involves a very accurate verification of the administered dose through quality checks performed by the medical physicists, for each plan, before apply it to a patient. These tests are performed using phantoms that are irradiated with the dose planed by dosimetrists in TPS. Then, the dose distribution obtained in the phantom is compared with the one calculated in TPS and if they are compatible, the planned treatment can be applied to the patient.
1.3 Monte Carlo LINAC simulation
Monte Carlo simulation is a statistical methodology that relies on a big random sampling to get similar results to reality. It allows you to experiment with variables a sufficiently large number of times to more accurately the chance of a result happen.
In practice, whenever you come across situations with some level of uncertainty and want to use Monte Carlo simulation, you will have to go through four steps. First, a model of the problem is done. Second, random values are generated for the uncertainties of the problem. Then, the third step, the values uncertainties are replaced to calculate the result. Finally, the solution of the problem is estimated. With the evolution of these methods, their application was extended to several fields of study, as for example in radiotherapy.
Monte Carlo simulations started to be used in radiotherapy dose calculations, becoming a common method to check other dose calculation methods in complex cases, where the simple methods were not able to work accurately. The development of a Monte Carlo beam model for linear accelerators (LINACs) was one of the first and most important step in Monte Carlo dose calculations. The calculation of the exact dose by Monte Carlo method requires accurate characterization of the radiation source [5].
To simulate the production of photon beams in a LINAC, the head components have to be precisely defined because they influence the output beam. Commonly, these components are the target, primary collimator and flattening filter, which have the greatest influence on the shape of the photon spectrum; and also the ionization chamber, the mirror and the secondary collimator. Information about components geometry and materials of the LINAC can be obtained from the manufacturer.
To evaluate the dose distribution in a particular geometry, it is necessary that the state of particles in the incident beam is precisely known, i.e. energy, orientations and positions of photons, electrons and positrons. This data set is called phase space files (PHSP). Obtain a phase space in MC simulations of LINACs is achieved by defining a sensitive volume that stores
4 information about particles passing through. Generally, this volume is a thin circular cylinder that sits above the secondary collimator. In this case the phase space becomes a virtual LINAC and can be used in different simulations, paying attention if the amount of particles stored in the file is a sufficient sample to obtain the required precision.
Phase space files (PHSP) are used as a primary generator in a simulation, which avoids the need for a detailed description of the geometry and materials, which are often a trade secret, and are rarely shared with the user`s machine. The availability of data PHSP also allows easy use of various beam qualities dosimetry studies, as detector characterization and the development of dose protocols.
The International Atomic Energy Agency (IAEA) has promoted a project to build a database to make public representative PHSP files of linear accelerators (and Co-60 units) used in external radiotherapy, compiling the existing data that has been properly validated. The IAEA PHSP format was designed and approved by a committee of international experts for use in medical applications [6]. This format was implemented in newer versions of general purpose MC codes as BEAMnrc / EGSnrc and Penelope, which are considered the state of -the -art for the electron-photon transport engaged in medical applications[7]. More recently, a Penelope based computer software named PRIMO was created, which is promising software in Monte Carlo LINAC simulation and will be used in this work.
PRIMO project was released in 2013 and it is a program that simulates linear accelerators and estimated absorbed dose distributions in water phantoms and CT scans (in dicom format). This software combines an appealing graphical interface to the user with computation processes based on the Monte Carlo code PENELOPE. The most of Varian and Elekta LINACs can be simulated by PRIMO, including electron applicators and multileaf collimators (MLC). The radiation fields may be stored in intermediate phase-space files which comply with the IAEA format. Thus, simulations can be done by steps and using information from other simulations already performed, saving computing resources and time. The program has also graphical and numerical tools to analyze phase-space files. Its graphical interface allows users to simulate and analyze results without performing very elaborate procedures [8]. Thereby, a prior very detailed knowledge of the Monte Carlo method or the inner LINAC operation is not a prerequisite to perform simulations at Primo, which does not occur in other such programs.
5
1.4 Objectives of this work
This project aimed to demonstrate the existence of an alternative method, based on Monte Carlo simulations, to calculate dose distribution profiles of IMRT treatments, since they require a verification process before applying the treatment to a patient. This study intends to demonstrate the usefulness of PRIMO in this context. Sometimes, IMRT treatments verification fail, i.e., the treatment plan does not correspond to the one irradiated in the phantom, without any apparent reason. That can happen due to physical limitations of MLC, which leads to LINAC incapacity to reproduces the generated plan in TPS. Another fact pointed out is related to the fact that the verification processing is performed using a matrix, which have ionization chambers separated by 1 cm. This makes the data acquisition of irradiations discrete in space, meaning that some results must be interpolated. This interpolation could not match exactly to the planned by TPS, being necessary to redo the verification process. Thus, this project aimed to demonstrate that PRIMO software has potential to simulate IMRT treatments and, perhaps, in the future, PRIMO can be used for IMRT verifications of dose distributions calculations, when there is no correspondence between TPS and LINAC irradiation. In order to achieve this major goal, it is necessary to structure the work in stages.
First of all, PRIMO software must be validated. At this stage the main goal is to demonstrate that the program can simulate a Clinac 2300, one of the LINACs used in IPO Porto. That is made by comparing basic dosimetry curves simulated and obtained with LINAC.
The second task is related to the validation of the MLC. Thus, a field with a given irradiation features and a given MLC conformation is simulated with Primo. At this stage, the objective is to demonstrate that simulation results are compatible with LINAC irradiation of the same field and with its calculation in TPS. As a result, there will be MLC validation and consistent evidence that the program can simulate a static irradiation field.
Ending the project, the last step has as objective the simulation of a single dynamic field and also, its comparison with LINAC irradiation and TPS calculation of this same field. If the three modalities are compatible, the main objective of this work is fulfilled, proving the potential of PRIMO software to simulate a complete IMRT treatment, once it successfully simulates a single irradiation field.
6
2 Experimental and theoretical background
2.1 Linear Accelerators
Radiation therapy consists on the usage of high energy radiation for tumors treatment, making them smaller by the destruction of tumor cells. In this technique, X-rays, gamma rays and charged particles could be used. Radiation can be applied by an external device to the body, which is called external radiotherapy, or inserting radioactive material into the body, near to cancer cells, which is called brachytherapy.
Most of the time, external radiation therapy sessions are made using a linear accelerator (LINAC), equipment that produces high energy x-rays. This radiation is applied to the patient, in the tumor region in a way that tumor cells are destroyed and healthy tissues around the tumor are saved.
The radiation production by a LINAC equipment is based on thermionic emission, similarly to what occurs in conventional x-rays. Thereby, an electron beam is emitted by an electron gun and accelerated in a tube due to high frequency microwaves generated by a Magnetron or a Klystron [9]. The electrons can be used directly to treatments on body surface or they can hit a metal target of high atomic number and be transformed into photons to use in deeper treatments (Figure 2.1). For this reason the LINACs make available two or more photon energies and several electron energies.
Figure 2.1 – Diagram of a linear accelerator in photon mode [10].
The beam modulation and its alignment are achieved by collimators in the inside of the LINAC head. All the LINACs have collimators, known as traditional collimators, which are distinguished between primary and secondary collimators. The primary collimator is made up of a relatively large lead block (or simply a heavy metal alloy), in order to produce a cross conical beam. The secondary collimator consists in pairs of metal blocks positioned in a perpendicular way between them. These blocks are called jaws and they control the field size for each treatment. This type of collimators only restrict rectangular fields [11].
7 However, the most recent models of LINACs have an additional type of collimation made of several thin leaves that allows a better conformation to the tumor shape. This system is called Multileaf Collimator (MLC) and it allows the irradiation of irregular fields without personalized protections for each patient (Figure 2.2). This system of collimation in a LINAC brings an increase on the initial investment but, in a long term this cost is overcome. This happens because individual protections hard to do are not needed, the treatment time is diminished, which increases the profitability of the LINAC and improve the treatments. Nowadays, the MLC used in clinical practice have 80 till 160 leaves, each one with some millimeters until 1 cm of wide. Every leaf is controlled with a computer, thus conformations with more than 1 mm of accuracy can be achieved and consequently irregular fields can be formed.
Figure 2.2 – Multileaf collimator [12].
In the LINAC head, ionization chambers are also present, which allow the dose monitoring and the end of the treatment when the prescribed dose has been delivered. The gantry is the LINAC component that moves around the table where the patient is lying down. The table movements can be longitudinal, lateral and rotational. In the LINAC positioning the isocenter has to be placed in a volume of millimeters for every movement. Multiple or rotational beams are applied but in all cases the tumor must be the key target. One way to ensure this happens is to locate the tumor on the isocenter on which everything runs around. In Figure 2.3 a blueprint of a LINAC is represented.
Several diseases can be treated with a LINAC, using several techniques such as conventional techniques, Intensity-Modulated Radiotherapy (IMRT), Imaging Guided Radiation (IGRT), Stereotactic Radiosurgery (SRS) and Stereotactic Body Radiotherapy (SBRT) [13].
8 Figure 2.3 – Main components of a LINAC [11].
2.2 Dose measurement
Currently the biological effects produced in irradiated tissues are associated with a quantity called absorbed dose. This quantity is defined as the average energy deposited per mass unit of a certain volume element and it is measured in gray (1Gy = 1J / kg)[14]. Absorbed dose is a macroscopic quantity, not stochastic and therefore not described the sequence of microscopic energy deposition processes. However, it is the spatial distribution of ionization caused by the incident radiation that determines the biological effect.
Ionizing radiation itself cannot be measured directly. The detection is performed by the result produced by radiation interaction with sensitive means (detector). To be used as a dose meter for ionizing radiation (which is called dosimeter), a material must have certain properties such as: accuracy and precision in measurement, linearity, dose or dose rate dependence, energy dependence, directional dependence and spatial resolution [15].
In the measurement process of dose absorbed, several types of detectors of different materials and shapes can be used, in a radiotherapy context. The most common are the
9 ionization chambers, followed by dosimetric radiosensitive films, solid state detectors (as TLDs) and electronic devices, usually made of silicon.
In general, an ionization chamber is constituted by a center electrode (anode) and the chamber wall, which is coated with a conductive material that acts as cathode. The detector sensitive volume is delimited by the chamber wall, forming a cavity filled with a gas or a gas mixture at a relatively low pressure. Between the anode and the cathode, a potential difference is applied to separate the ion pairs produced. As a result, negative ions migrate to the anode and positive ions to the cathode. This ion flow produces an extremely low electric current which can be measured by an electrometer, a device that measures small currents [15].
The Farmer type ionization chambers (Figure 2.4) are widely used due to its accuracy in reading. It is recommended for MV photon beams and for electron beam with energies above between 10 MeV to 45 MeV [16].
Figure 2.4 - Basic design of a cylindrical Farmer type ionization chamber [15].
2.3 Phantoms for basic dosimetry
The calibration of a LINAC consists in a set of procedures in order to getting depth curves yield and dose profile for each irradiation field, energy, type of radiation and for each beam modifier accessory. To obtain this dosimetric database for a radiation treatment unit is a meticulous experimental work, which is called basic dosimetry [17].
Usually, this calibration is performed in a cubic water phantom (Figure 2.5), whose dimensions are much greater than the irradiation fields dimensions used in clinical situations. The incidence of the beam is perpendicular to the water surface at a specific distance from the focus of the radiation. The set - up has ionization chambers to acquire the data.
10
Figure 2.5 – Water tank phantom for basic dosimetry[18].
2.4 Percentage Depth Dose (PDD)
The Percentage Dose Depth (PDD) is a curve that shows a ratio between the absorbed dose in several depths and the absorbed dose in a reference depth (Zmax). In Equation 1 is seen the quotient that defines a PDD, in which Dd represents the dose at any depth and Dd0 represents the dose at a fixed reference depth (Figure 2.6) [19]. This curve is defined for a given material, for a specific field of irradiation, for a certain irradiation beam energy and Source to Surface Distance (SSD) [11].
Equation 1
The PDD curve has an initial point which represents the dose deposited on a patient skin (or phantom surface). The photons interact with the matter, which increase the dose in the patient (or phantom) until the maximum. That area, between incident surface and the point where the maximum dose is achieved is called build-up region. In this area the interaction between photons and tissues releases electrons, which leave their energy in a certain distance of their origin.
The percentage depth dose (beyond the depth of maximum dose) increases with beam energy. Higher-energy beams have greater penetrating power and thus deliver a higher-percentage depth dose (Figure 2.7). In the practice, the acquisition of these profiles is made by using a water phantom, which is a tank made of acrylic full of water with controlled height and leveling.
11
Figure 2.6 – Geometrical PDD definition. Q is an arbitrary point at depth Z and P is the point at Zmax. A corresponds
to the field size [11].
Figure 2.7 – PDD curves in water for various photon beams at SSD of 100 cm [11].
2.5 Lateral Profiles acquisition and characterization
The dose distribution (along the) the central axis is only a portion of the patient’s dose distribution. For two or three dimensions the distribution is achieved by the combination of the central axis distribution with the off-axis profiles. The dose measurement of these last profiles is made on perpendicular axis to the central one using some depths of acquisition. The most used depths dose of measurement are the depth of maximum dose , and the 5, 10 cm, 20 and 30 cm, which are used for the planning systems.
The profile of a megavoltage radiation beam is composed by three distinct regions: the central region, the umbra, and the penumbral region (Figure 2.8). The central region goes from the central axis to 1 cm or 1.5 cm of the geometric field border. The umbra is the region outside the radiation field. The penumbral region is the one that suffers the source penumbra
12 influence, the collimator radiation transmission and radiation scatter, which together make the physical penumbra. In this region the dose change abruptly and depends on the source size, on the collimation position and the lateral electronic scatter.
The beam profile analysis is based on some parameters that define its uniformity, which are the flatness and symmetry.
Figure 2.8 – Beam profiles of 10 MV at various depths in water, for field sizes of 10 cm x 10 cm and 30 cm x 30
cm[11].
2.5.1 Flatness
The flatness is a parameter calculated using the maximum and minimum dose values of 80% of the beam profile central part, as can be seen at Equation 2.
Equation 2
According to the LINAC components and details of its beam an excess of filtration can be seen on the central axis for the maximum dose depth. This fact occurs because the LINAC has a filter which will flat the beam. This effect will be less pronounced with the increase of the depth. In this situation the profile will present more rounded borders rather than peaks. The emission of lower energy photons outside the central axis explain this fact, when comparing to the ones emitted on the central axis [11].
The traditional LINACs for clinical use usually require that the flatness would be lower than 3%, for measurements with a 10 cm depth and a SSD of 100 cm and for the bigger field available (commonly 40 x 40 cm2).
13 2.5.2 Symmetry
The symmetry is a parameter measured at the maximum dose depth, since it is the most critical area for this evaluation, because in that point the beam profile has the peaks already referred. According to Task Group 142 [20], for the same profile, the beam should present a symmetry with a maximum disagreement of 2% between two points at the same distance from the central axis.
Another way to measure beam symmetry is calculating the areas besides the central axis until the point of 50% dose value and compare them using Equation 3.
Equation 3
2.6 Modern Radiotherapy Techniques
2.6.1 3DCRTThe tridimensional conformal radiotherapy (3D-CRT) is a technique that uses multiple beams with uniform radiation intensity to irradiate the exact treatment area, according to the security margins [21]. This exact targeting makes it possible to use higher levels of radiation in treatment, which are more effective in shrinking and killing tumors.
2.6.2 IMRT
Intensity Modulated Radiotherapy is an evolution of 3D-CRT, because the applied fields have variable intensities (Figure 2.9). It is a modality of external radiotherapy extremely
accurate that allows the administration of high radiation doses on the target volume, reducing the dose in the healthy tissues around. The radiation is applied according to the tridimensional shape of the tumor, which is achieved by the beam modulation (Figure 2.10). Similarly to 3D-CRT, IMRT allows a geometrical conformation adding a dosimetric adjustment to the irradiated area [17]. Therefore, the toxicity of the treatment, the side effects in a short and long term will be reduced [22].
Despite the benefits of IMRT in relation to the 3D-CRT, this technique requires a more severe treatment plan. In both techniques the targets and structures to protect are
14 selected by the doctor, which are called the volumes of interest for the treatment. However, in IMRT a technique called inverse planning is introduced, while in 3D-CRT a common planning is used. In 3D-CRT simple beams are shaped considering field margins that will compensate the daily variations in configuration and the beam characteristics. In this case, the quantity and angle of incidence of beams and its configuration are chosen and then the dose in the volumes of interest is calculated. Then the plan is analyzed in terms of dose, confirming if the maximum dose in the organs at risk is not achieved. The plan can be remade changing some parameters in order to find the best treatment plan: the one with lower dose in the organs at risk and higher dose at the tumor. On the other hand, in the IMRT treatment planning the opposite process occurs. The dose in the target and in the structures to be protected is prescribed by the doctor. For this purpose tolerance levels for each organ have to be determined [23]. Then, the program used to planning creates a series of modulation patterns in order to find the configuration that best match to the desired plan [21]. In general, 5 to 9 irradiation fields are used in an IMRT treatment, which are administered to the patient by linear accelerators with multi-leaf collimation systems.
According to the way of delivering IMRT, there are two techniques that can be distinguished: IMRT with segmental MLC, which is known as step and shoot; and IMRT with Dynamic MLC. The step and shoot technique is a discrete mode of IMRT delivery, in which the MLC leaves move to their next position while the beam is off [24]. In this case, the sum of all radiation segments will produce the intensity modulated field. In contrast, with the dynamic MLC technique the MLC leaves are in continuous motion during all treatment. The desired intensity of radiation in a specific point is achieved by a variation on MLC leaves motion speed and the changes in their position[21].
Even though IMRT has emerged in the beginning as an experimental technique, mainly in academic environment, nowadays there are a growing number of centers in Europe using IMRT in clinical practice [25]. Currently, IMRT is particularly indicated to the treatment of prostate tumors, head and neck, gynecological, gastrointestinal and central nervous system tumors.
This technique requires many resources and time to its implementation. A large number of professionals are necessary from treatment planning, until its implementation and also some procedures have to be done. Thus, acceptation and commissioning tests are needed to implement IMRT, but also quality assurance tests of the treatments are a requisite to apply an IMRT treatment to a patient.
15
Figure 2.9 – a) 3D Conformal RT technique using uniform beams; b) IMRT technique using non uniform beams [17].
Figure 2.10 – Beam incidence and dose color wash on 3D-CRT (on the left) and Beam incidence and dose color wash
on IMRT(on the right) [21].
2.6.3 Volumetric Modulated Arc Therapy - VMAT
VMAT allows carrying intensity modulated treatment only in one arc. This is achieved through the simultaneous variation of several parameters, as MLC leaves pattern, dose rate and rotation speed of the gantry. This treatment technique produces high compliance absorbed dose distributions and is quite effective in terms of treatment time [26].
RapidArc ™ (Varian Medical Sistems, Palo Alto, CA, USA) is one of the solutions already in the market for this type of treatment [27]. RapidArc™ has recently been introduced in clinical practice in various institutions after an intensive validation [28]. This introduction requires a new work methodology, being necessary introduce a quality assurance program and systematic dosimetric verification.
16 2.6.4 Tomotherapy
Tomotherapy is a type of image-guided IMRT that combines imaging and treatment capabilities in one unit [29]. The part of tomotherapy machine that delivers radiation for both imaging and treatment can rotate completely around the patient in the same manner as a normal CT scanner. This equipment can capture MV CT images of the patient’s tumor immediately before treatment sessions, to allow for very precise tumor targeting and sparing of normal tissue. The intensity modulation is obtained by a binary collimator that opens and closes, according to computer control. Meanwhile the fan beam runs continuously around the patient and bed moves at a predetermined rate[30].
2.6.5 SRS, SRT and SBRT
Stereotactic Radiosurgery (SRS), Stereotactic Radiotherapy (SRT) and Stereotactic Body Radiotherapy (SBRT) are three techniques closely related. All of them are delivered on a LINAC and require extreme precision in patient positioning, because they are normally used when exist the need of spare immediately adjacent normal tissue[31].
In SRS a high radiation dose is given to a certain brain region of a patient in one or a few fractions. The goal of SRT is to disrupt cell division processes without completely destroying the local tissue. SRS, on the other hand, is an ablative technique where the goal is to deliver sufficient dose to the target area to kill all the cells in the target region. In this technique a fractionated schedule of delivery is used, although that schedule may be accelerated in a hypofractionated regime of as few as 3-5 treatment sessions. The difference between this technique and SBRT is the body region where the technique is applied. Thus the first one treats brain and spine tumors , the second one treats other body regions as lungs, liver, pancreas and kidneys, for example [32].
2.6.6 Treatment monitoring
In radiotherapy treatments the periodic verification of radiation fields is important, which is achieved through the use of images. In the most common LINACs, the image acquisition systems comprise a robotic arm having a panel with a matrix of detectors, called portal imaging system. With these detectors it is possible to obtain images, resulting from patient output radiation, due to the attenuation caused by tissues. These images contain
17 anatomical information of the patient and are used to verify the effects of the treatment. Thus, in treatment monitoring by portal images periodic information on target position and movement are obtained (within the same session or between consecutive sessions). Then it is compared with reference imaging, giving feedback to correct the patient setup and optimize target localization. These images also have the potential to provide feedback that may help to adapt subsequent treatment sessions according to tumor response [33].
2.6.7 Image guided patient positioning techniques
Image Guided Radiotherapy is a technique that allows checking the patients positioning while they are in the treatment table. Images can be acquired through the portal imaging system or with the Megavoltage Cone-Beam CT technique. In the first case, the patient is irradiated with a very low dose in two orthogonal directions (one above and one side), which will create 2D images that can be compared with the corresponding image in the planning computed tomography (CT). In the second case, the LINAC rotates around the patient allowing the creation of a 3D image, which is also compared to the CT planning, which gives information about the patient position in relation to the isocenter.
The imaging scans obtained are processed by computers to identify changes in a tumor’s size and location due to treatment. They allow the position of the patient or the adjustment of the planned radiation dose during treatment. The imaging repetition can increase the accuracy of radiation treatment and may allow reductions in the planned volume of tissue to be treated, thereby decreasing the total radiation dose to normal tissue [34].
2.7 Treatment Planning System (TPS)
2.7.1 Treatment planningThe treatment planning systems (TPS) are used on external radiation therapy to simulate the radiation beams and its dose distribution. Consequently, the tumor control is maximized and the complications with healthy tissues are minimized. The help of complex calculation systems are needed to elaborate the patients’ treatment plans [35].
To start the planning phase patients CT scans are performed, in which they are in the same position of the external radiation treatment. Sometimes, when the gross tumor volume
18 (GTV) location is hard to define, other types of images are required, as PET or MRI for example. Thus, the physician has to delineate the several volumes [36]:
GTV (Gross Tumor Volume) – Tumor or tumor extent detected and / or visible by medical palpation or identified in complementary diagnostic images (CT, MRI, PET / CT).
CTV (Clinical Tumor Volume) – Volume of treating tissue which comprises the GTV associated with microscopic disease extent.
PTV (Planning Tumor Volume) – Defined by CTV and safety margins (about 1 cm). These margins compensate for changes due to the variation in size and shape of the CTV tissues and daily variations of the patient's face.
OAR (Organ at risk) – Healthy tissues/ organs close to the tumor, whose tolerance doses might influence the volume and / or the dose levels to irradiate.
After this selection, the treatment plan is made using the TPS. The treatment plans for each patient have information about the position of the gantry, collimators and treatment table. The field dimensions, protections to use and dose are also information on the treatment plan. Based in all selected mechanical properties and dose values assigned to each treatment plan are found the Monitor Units (MU) that should be applied in each irradiation field of treatment. In the final phase of the planning process dose volume histograms are created, which are evaluated by doctors for approval of treatment plan.
There are several planning systems available in the market, but in the context of this project the Eclipse system is the most important to refer, because is the one used in IPO Porto. With this system the radiotherapy treatment plan is a faster and easily process. In the particular case of IMRT treatments, Eclipse combines tools from 3D-CRT with a fast, accurate and interactive dose optimization. Furthermore this system also allows automatic optimization of beam geometry, simplifying the task of select the best incidence angles of beam radiation in IMRT [37].
2.7.2 Dose calculation algorithms
One of the most used dose calculation algorithm is the pencil beam. This technique assumes that any collimated photon beam incident on the patient is a group of lots of smaller, narrow pencil beams. Each of these pencil beams has a central axis ray along which it deposits
19 some dose. The dose deposition pattern varies with the intensity and the spectrum of the beam that is incident on the patient [38].
The Anisotropic Analytical Algorithm (AAA) is a considered a 3D Pencil Beam superposition-convolution model [26] and it was the first algorithm of this kind being implemented on Eclipse Treatment Planning System from Varian Medical Systems.
The superposition-convolution algorithms are explained by a model in which the dose deposition is seen as weighted responses (kernels) superposition for specific radiations. Kernels represent the transport and dose deposition energy of secondary particles coming from the irradiation point. When kernels are spatially invariant, this superposition can be evaluated using convolutions [26].
AAA applies kernels derived from Monte Carlo calculations, which are sized to be adjusted to local density. This algorithm considers tissues heterogeneity anisotropically by dispersing kernels in multiple lateral directions. The final dose distribution is obtained by superposition of the doses from the photon and electron convolutions[39]. Comparing AAA with other algorithms as Pencil Beam Convolution (PBC), it presents a better performance, because AAA is able to model with higher precision the electrons transport in a heterogeneous medium [40]. The computation time to calculate this algorithm is reduced, and similar to PBC, when calculated in Eclipse.
2.7.3 Isodose distributions
A dose distribution in a three-dimensional volume cannot be characterized only by depth dose distribution in the central axis. To represent a planar or volumetric variation in absorbed dose, the distributions are represented by lines passing through points with the same dose values, which are called isodose curves [19].
The planning systems calculate for each field configuration the dose distribution, given by a set of isodose curves, which are quantitatively evaluated from dose volume histogram (DVH). The DVHs are statistic dose tools that allow knowing the dose reaching a certain volume of a given anatomical structure [17]. With the help of DVHs, a planning evaluation is made, based on dose distribution analysis around the PTV and OARs. For this reason, in each image slice, the isodose distributions must be inspected [41].
20 2.7.4 Dose distribution verification techniques
Before the first treatment session, the MUs generated in planning system should be checked using an independent verification system. In the case of IMRT treatments, the correlation between MUs and dose delivered to each intensity modulated field is not much evident, and problems that can occur cannot be predicted by these means [42]. Therefore, for purposes of dose administered quality control, the achievement of absolute dose and relative dose verification tests are requirements for IMRT planning.
The purpose of absolute dosimetry is measure the deviation between the dose planned and dose in a point, typically the isocenter, while relative dosimetry has as goal to determine the accuracy of dose distribution. The relative dose verification consists on the comparison between the irradiation of a field planed for the patient on a cubic phantom (always with the angle of the gantry at 0 °) and the planar image provided by the Electronic Portal Imaging Device (EPID) (or other verification system) after its irradiation according to the respective patient's treatment parameters. The dose distribution plan adapted to a geometric phantom should also be compared with the resulting dose distribution in irradiated films (or in other detector) after patient’s treatment simulation. To be considered absolute dose verification, the absorbed dose in films should be normalized to the isocenter dose value, obtained with the plan irradiation using a calibrated ionization chamber[43].
These tests are protocolled in order to ensure the reliability in the execution of each patient planning. These protocols include pre-treatment verifications and periodically verifications over the treatment.
2.8 Phantoms for IMRT verification
A phantom is an object that can represent a patient in terms of absorption and scattering properties of radiation. A phantom can be geometric or anthropomorphic and can be filled with water, homogeneous solid material or materials equivalent to human tissue. All of them allow the access to relevant dosimetry information, by the introduction of some kind of detector therein. This makes phantoms an essential tool in the evaluation of equipment operating conditions or in quality control checks.
In daily IMRT treatments verification, a geometric phantom made by solid water slabs is widely used (Figure 2.11), which simulates the radiation absorption and diffusion properties in human tissues. The solid water slabs reproduce the dosimetric properties of the
21 tissues, in a simple way, reducing anatomy complexity and presenting regular geometries. These slabs are made of water-equivalent plastic and have holes for different types of ionization chambers, in particular for Farmer type, allowing that absolute or relative dose measurements be achieved [44].
Figure 2.11 – Solid water phantom used in IMRT treatments quality control [45].
2.9 Monte Carlo dose distribution calculations
Stochastic methods are known since before the advent of computers, however only in 1947 the name of Monte Carlo Methods has been assigned [46]. This term encompasses a class of numerical methods based on random numbers usage. These methods are very used in areas as physics and mathematics, in particular at large number of independent variables problems [47].
In Monte Carlo simulations of radiation transport, a particle is seen as a random sequence of free paths, which ends with an interaction. Therefore, the particle could change its direction of movement, loses energy, and occasionally produce secondary particles. This simulation is the numerical generation of random events and a model to describe them is needed. Thus, a set of differential cross sections (DCS) are created for the relevant interaction mechanisms. The DCSs determine the probability distribution function (PDF) of the random variables that characterize an event, such as interaction between successive events of a free path particle, the type of interaction occurred, and the loss of energy and angular deflection due to an interaction [48]. As these PDF are known, it is possible to generate random events by using appropriate sampling methods.
Monte Carlo algorithm includes some components that should be highlighted: the probability distribution, since the system has to be described by one or more PDFs; the
![Figure 2.2 – Multileaf collimator [12].](https://thumb-eu.123doks.com/thumbv2/123dok_br/15139331.1011710/20.892.294.663.436.702/figure-multileaf-collimator.webp)
![Figure 2.7 – PDD curves in water for various photon beams at SSD of 100 cm [11].](https://thumb-eu.123doks.com/thumbv2/123dok_br/15139331.1011710/24.892.294.598.468.694/figure-pdd-curves-water-various-photon-beams-ssd.webp)
![Figure 2.9 – a) 3D Conformal RT technique using uniform beams; b) IMRT technique using non uniform beams [17]](https://thumb-eu.123doks.com/thumbv2/123dok_br/15139331.1011710/28.892.144.748.114.361/figure-conformal-technique-using-uniform-beams-technique-uniform.webp)
![Figure 2.11 – Solid water phantom used in IMRT treatments quality control [45].](https://thumb-eu.123doks.com/thumbv2/123dok_br/15139331.1011710/34.892.240.655.228.480/figure-solid-water-phantom-imrt-treatments-quality-control.webp)
![Figure 3.10 – PTW matrix of 27 x 27 cm 2 formed by 729 ionization chambers, spaced by 1 cm, which is used in the solid water phantom at IMRT treatments quality control [45]](https://thumb-eu.123doks.com/thumbv2/123dok_br/15139331.1011710/48.892.242.653.562.958/figure-matrix-ionization-chambers-phantom-treatments-quality-control.webp)