Supply C
hain Busines
s In
telligen
ce
‐
Marce
la Alves F
reire
Mode
l
prop
osal and
imple
mentation to sup
por
t the
onl
ine
sales
sup
ply chai
n end
to end
ope
ratio
n of a
Portuguese
ele
ctronics re
tail comp
a
ny
Pro
je
c
t W
ork presented as
partial r
equir
em
e
nt fo
r
obtaining
th
e Master’s d
egre
e in Infor
mati
on M
anagem
en
t
NOVA Information Management School
Instituto Superior de Estatística e Gestão de Informação
Universidade Nova de LisboaSUPPLY CHAIN BUSINESS INTELLIGENCE ‐ MODEL PROPOSAL AND
IMPLEMENTATION TO SUPPORT THE ONLINE SALES SUPPLY CHAIN
END TO END OPERATION OF A PORTUGUESE ELECTRONICS RETAIL
COMPANY
by
Marcela Alves Freire
Project Work presented as partial requirement for obtaining the Master’s degree in Information Management, with a specialization in Knowledge Management and Business Intelligence Co Advisor: Miguel de Castro Simões Ferreira Neto Co Advisor: Miguel Nuno da Silva Gomes Rodrigues GagoACKNOWLEDGEMENTS
I would like to thank all those who contributed to the development of this project.
To my advisors, Professor Miguel Neto and Professor Miguel Gago. Thank you for your guidance, advices and feedback throughout this process. To the company that trusted me with this project, in particular to my advisor Pedro Costa and to the entire Business Intelligence team. This would have not been a possibility without your support and guidance. To Carlos Francisco Neto, who has always been there for me. Thank you for being supportive, caring and patient throughout this entire journey.
To my family, in particular to my parents, Vera Maria Alves and Francisco Morel. You are my inspiration. Thank you for supporting me throughout my studies, for motivating me and for believing in me.
ABSTRACT
In today’s highly competitive business environment, the adoption of Supply Chain Management is seen as an advantage. It provides not only effective integration, but also cooperation within the supply chain.
However, in order to achieve further integration, other practices are needed. With growing volumes of data, businesses are required to ensure its appropriate flow, integration and analysis.
This project, named “Supply Chain Business Intelligence ‐ Model proposal and implementation to support the online sales supply chain end to end operation of a Portuguese electronics retail company” had as its main goal the development of a conceptual model of a Business Intelligence system to address the needs of an online sales supply chain end to end operation. The proposed model should not focus on a specific company. Instead, it should provide a solution for other similar problems. The project starts with the definition of the problem, objectives and methodology. It is then followed by the literature review, which consists of a thorough research to identify best practices and previous works in the literature that dealt with similar problems. The research focuses on three main topics: Supply Chain Management, Internet Retail Industry and Business Intelligence.
A conceptual model is then developed, which consists of four main steps: definition of the overall requirements, metrics, data mart model and dashboards. For the data mart model, it is important to identify the business process, the appropriate granularity and respective dimensions and fact tables. It is then followed by a case study, which consists in the implementation of the model to solve Company X’s problem. As outputs of the project, both data mart and dashboards are considered, since they are part of the artifact needed to achieve the business requirements. Finally, a discussion and evaluation of the results is conducted. Even though the implementation part of the project presented some challenges, the final solution still showed improvements for Company X and proved to be appropriate for the provided business requirements. Limitations and possible aspects of improvements are presented in the last chapter of the project.
KEYWORDS
Supply Chain; Internet Retail; Online Sales; Business Intelligence; Data Mart; Dashboard.INDEX
1.
Introduction ... 1
1.1.
Background ... 1
1.2.
Problem definition ... 2
1.3.
Main Goal and Specific Objectives ... 3
1.4.
Study Relevance and Importance ... 4
1.5.
Methodology ... 5
2.
Literature Review ... 7
2.1.
Supply Chain Management ... 7
2.2.
Internet Retail Industry Supply Chain... 9
2.3.
Business Intelligence in Supply Chain Management ... 12
2.3.1.
Data Warehouse ... 14
2.3.2.
Information Visualization and Dashboard Design ... 16
3.
Conceptual Model Proposal ... 21
3.1.
Context ... 21
3.2.
Overall Requirements ... 25
3.3.
Measures and Metrics ... 27
3.4.
Data Mart Conceptual Model... 32
3.4.1.
Select the business process ... 32
3.4.2.
Define the granularity ... 32
3.4.3.
Identify the dimensions ... 33
3.4.4.
Identify the facts ... 36
3.5.
Dashboard Conceptual Model ... 41
4.
Development ... 45
4.1.
Platform ... 45
4.2.
Data Sources ... 46
4.3.
Data Integration and Processing ... 47
4.3.1.
Data Mart Model ... 47
4.3.2.
ETL ... 49
4.4.
Dashboard ... 50
4.4.1.
Transportation Purchase Orders Information ... 55
4.4.2.
Online Sales Supply Chain E2E Process Summary... 56
4.4.3.
Online Sales Supply Chain E2E Process Summary (Campaign Season) ... 57
4.4.4.
Systems, Operation and Transportation Performance Assessment ... 57
5.
Results and Discussion ... 59
5.1.
Discussion and Evaluation of the Results ... 59
6.
Conclusion ... 61
7.
Limitations and recommendations for Future Works ... 63
8.
Bibliography ... 65
9.
Appendix ... 69
LIST OF FIGURES
Figure 1.1 – Overall Online Sales Process ... 2
Figure 1.2 – Diagram showing the existing solution and the intended solution for Company X
...
3
Figure 1.3 – Process Model for DSR. Adapted from Peffers, Tuunanen, Rothenberger &
Chatterjee (2007) ...
6
Figure 2.1 – Typical supply chain of a company. Adapted from Chen & Paulraj (2004) ... 8
Figure 2.2 – Representation of a multichannel company’s supply chain which includes
Warehousing, Distribution, Information Technology and Transportation Services.
Adapted from Barry (n. d.) ... 11
Figure 2.3 – Top 10 categories in Amazon as of April 2019. Adapted from ScrapeHero (2019)
...
12
Figure 2.4 – Modern data architecture. Adapted from Hansen (2020) ... 14
Figure 2.5 – SCI Global Model. Adapted from Stefanovic, Majstorovic & Stefanovic (2006) .. 15
Figure 2.6 – Star Schema. Adapted from Kimball & Ross (2011) ... 16
Figure 2.7 – Visualization process. Adapted from Ware (2013) ... 17
Figure 2.8 – GQM model. Adapted from Janes, Sillitti & Succi (2013) ... 18
Figure 2.9 – A guideline for choosing the proper chart. Adapted from Abela (2006) ... 20
Figure 2.10 – Reading gravity. Adapted from Reporting Impulse (2019) ... 21
Figure 3.1 – Overall Online Sales Process ... 23
Figure 3.2 – Supplier Stores online sales E2E process ... 24
Figure 3.3 – Online sales E2E process for orders that are prepared in a supplier store that
coincides with the chosen delivery store ... 25
Figure 3.4 – Proposed supply chain metrics. Adapted from Chae (2009) ... 30
Figure 3.5 – Simplified diagram of the conceptual data mart model ... 40
Figure 3.6 – Systems Purchase Orders Information dashboard conceptual model ... 42
Figure 3.7 – Operation Purchase Orders Information dashboard conceptual model ... 42
Figure 3.8 – Transportation Purchase Orders Information dashboard conceptual model ... 43
Figure 3.9 – Online Sales Supply Chain E2E Process Summary (Campaign Season) dashboard
conceptual model ...
43
Figure 3.10 – Online Sales Supply Chain E2E Process Summary dashboard conceptual model
...
44
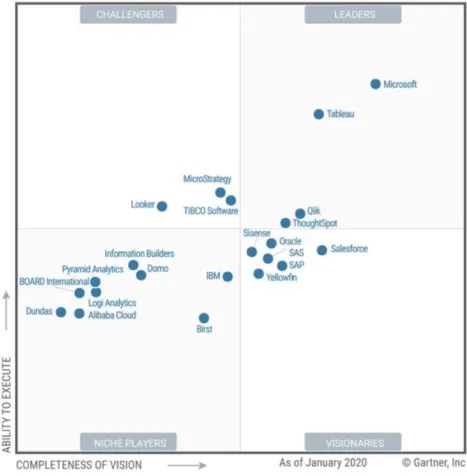
Figure 4.1 – Magic Quadrant for Analytics and Business Intelligence Platforms (Gartner,
2020) ...
45
Figure 4.2 – Simplified diagram of Company X’s data mart ... 49
Figure 4.3 – Dashboard Transportation Purchase Orders Information ... 51
Figure 4.4 – Dashboard Online Sales Supply Chain E2E Process Summary ... 52
Figure 4.5 – Dashboard Online Sales Supply Chain E2E Process Summary (Campaign Season)
...
53
Figure 4.6 – Dashboard Systems, Operation and Transportation Performance Assessmen ... 54
Figure 6.1 – Evaluation of the artifact ... 61
Figure 9.1 – Diagram of the conceptual data mart model ... 79
Figure 9.2– Zoom of the diagram of the data mart model focusing solely on FactSystems and
its dimensions ...
80
Figure 9.3 – Zoom of the diagram of the data mart model focusing solely on FactOperation
and its dimensions ...
81
Figure 9.4 – Zoom of the diagram of the data mart model focusing solely on
FactTransportation and its dimensions ...
82
Figure 9.5 – Zoom of the diagram of the data mart model focusing solely on
FactOnlineSalesE2E and its dimension ...
83
Figure 9.6 – Diagram of Company X’s data mart... 84
Figure 9.7 – Summary of ETL process ... 94
Figure 9.8 – Summary of ETL process (zoom) ... 95
Figure 9.9 – Summary of ETL process (zoom) ... 96
LIST OF TABLES
Table 2.1 – Examples of potential applications of big data in logistics. Adapted from Waller &
Fawcett (2013) ... 13
Table 3.1 – Dashboards and their target users ... 30
Table 3.2 – Supply Chain Performance Metrics Framework. Adapted from Gunasekaran,
Patel & McGaughey (2004) ... 31
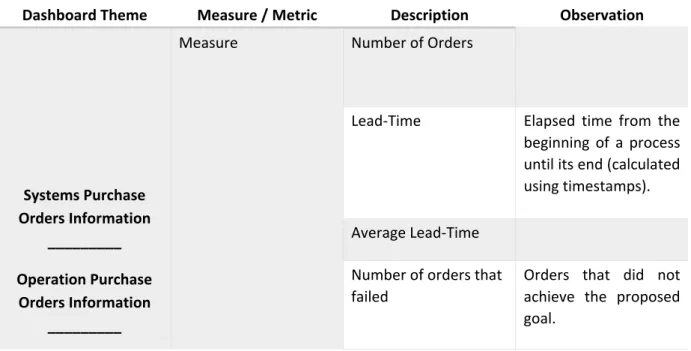
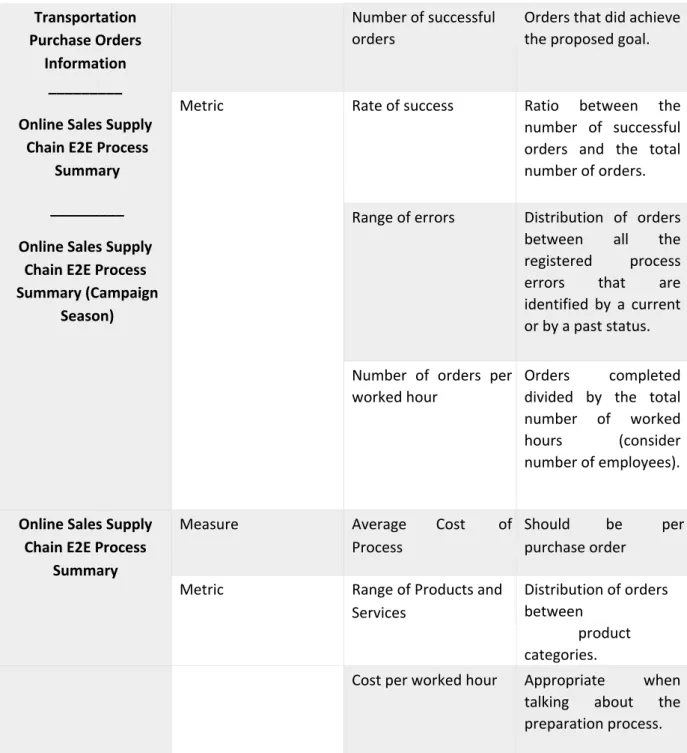
Table 3.3 – Measures and metrics defined for the project ... 33
Table 9.1 – DimDate fields and their respective descriptions ... 69
Table 9.2 – DimProduct fields and their respective descriptions ... 70
Table 9.3 – DimAddress fields and their respective descriptions ... 70
Table 9.4 – DimFlow fields and their respective descriptions ... 71
Table 9.5 – DimShipCompany fields and their respective descriptions ... 71
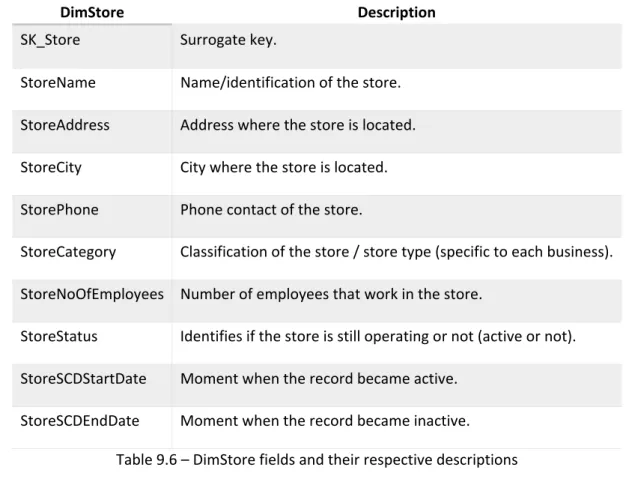
Table 9.6 – DimStore fields and their respective descriptions ... 72
Table 9.7 – DimStatus fields and their respective descriptions ... 72
Table 9.8 – FactOnlineSalesE2E fields and their respective descriptions ... 74
Table 9.9 – FactSystems fields and their respective descriptions ... 75
Table 9.10 – FactOperation fields and their respective descriptions ... 76
Table 9.11 – FactTransportation fields and their respective description ... 78
Table 9.12 – OMS used tables and respective fields ... 86
Table 9.13 – WMS used tables and respective fields ... 87
Table 9.14 – RMOS used tables and respective fields ... 87
Table 9.15 – Company X’s DimDate fields, data sources and data types ... 88
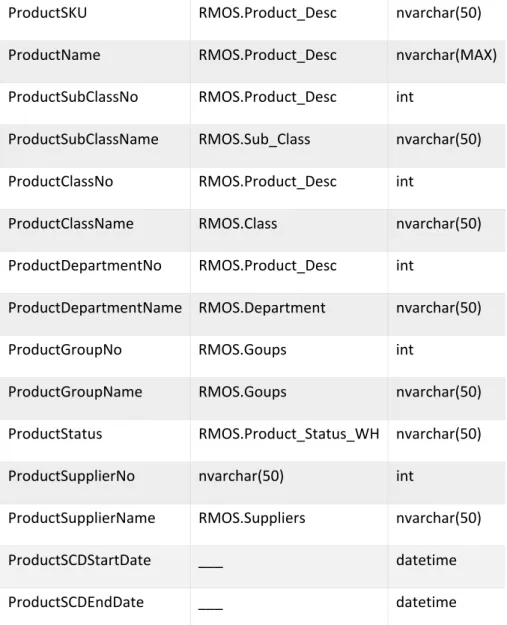
Table 9.16 – Company X’s DimProduct fields, data sources and data types ...
89
Table 9.17 – Company X’s DimAddress fields, data sources and data types ...
89
Table 9.18 – Company X’s DimFlow fields, data sources and data types ... 90
Table 9.19 – Company X’s DimStore fields, data sources and data types ...
90
Table 9.20 – Company X’s DimStatus fields, data sources and data types ... 90
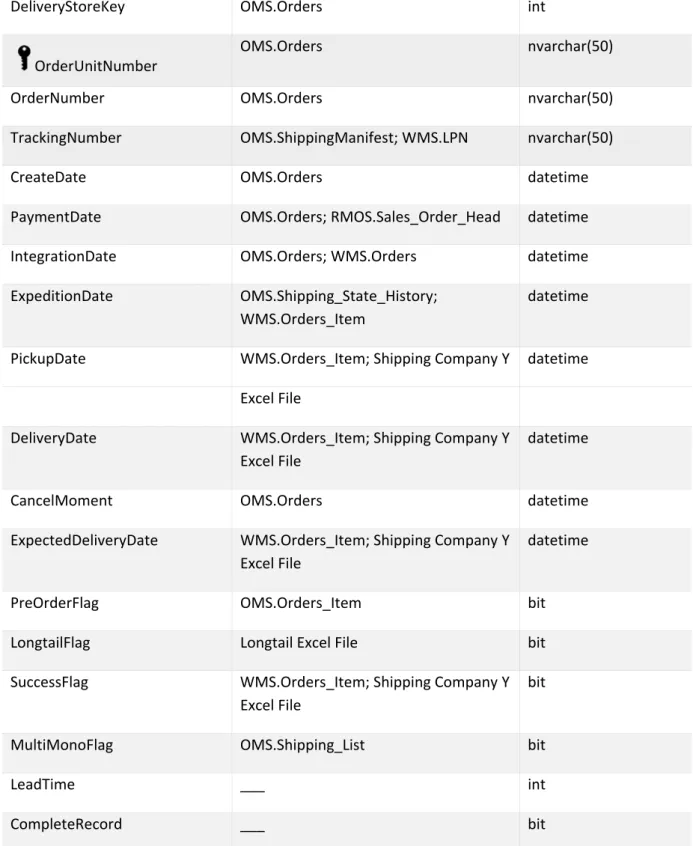
Table 9.21 – Company X’s FactOnlineSalesE2E fields, data sources and data types ...
92
Table 9.22 – Company X’s FactTransportation fields, data sources and data types
... 93
LIST OF ABBREVIATIONS AND ACRONYMS
ABI Analytics and Business Intelligence B2C Business‐to‐Consumer BI Business Intelligence CE Consumer Electronics DC Distribution Centers DD Degenerate Dimension DM Data Mining DS Design Science DSR Design Science Research DSRM Design Science Research Methodology DSS Decision Support System DW Data Warehouse ETL Extract, Transform and Load GQM Goal Question Measurement GSCF Global Supply Chain Forum IS Information Systems KPI Key Performance Indicator OLAP Online Analytical Processing OMS Online Management System RMOS Retail Merchandise Operation System SA Sales Assistant SC Supply Chain SCD Slowly Changing Dimension SCI Supply Chain IntelligenceSCM Supply Chain Management SCOR Supply Chain Operations Reference SKU Stock Keeping Unit SSIS SQL Server Integration Services SSMS SQL Server Management Studio UML Unified Modeling Language WMS Warehouse Management System YTD Year to date
1. INTRODUCTION
Given the flexibility and the comfort that online shopping brings to the shopping experience, ecommerce has shown a considerable growth in the past years. As new technologies and trends emerge, it is of great importance that the e‐commerce businesses adapt to the new reality.
Some of the biggest challenges faced by these businesses are centered in their supply chain. The purpose of the following project is to present a Business Intelligence (BI) solution to address the needs of the online sales end to end operation from a supply chain perspective. After proposing a conceptual model, its implementation will be conducted concerning a Portuguese electronics retail company. Due to confidentiality terms, the company will not be identified, as well as the specific names for data sources, tables and respective fields. So, in order to deliver the outputs proposed in this project, generic names will be presented and the company will be referred to as Company X.
1.1. B
ACKGROUNDEvery day, businesses face more and more pressure to reduce costs, reduce process times and increase profit. There is an increasing expectation for high quality products and services that need to be delivered at the right time and place. In this business environment, one of the key success factors for companies concerns the implementation of an effective integration strategy between all supply chain collaborators (Stefanovic & Stefanovic, 2009).
In order to provide competitive advantage and to respond to an ever‐changing global environment, Supply Chain Management (SCM) was introduced as a new management philosophy (Stefanovic & Stefanovic, 2009). This has been a concept of great value ever since the early 20th century with the development of the first assembly line. However, as a term, it was only introduced to the public in 1982 in an interview given to the Financial Times by Keith Oliver, a consultant at Booz Allen Hamilton. Still, it only became popular with the publication of “Introduction of Supply Chain Management” in 1999 by Robert B. Handfield and Ernest L. Nichols, Jr. The book was translated to Japanese, Korean, Chinese, and Russian and over 25,000 copies were published (Ghosh, 2016).
Instead of viewing Supply Chain (SC) as a set of individual parts, each having its own function and purpose, SCM considers it to be a single entity. After developing a study to find a consensus definition for SCM, Stock and Boyer (2009) came up with the following result: “The management of a network of relationships within a firm and between interdependent organizations and business units consisting of material suppliers, purchasing, production facilities, logistics, marketing, and related systems that facilitate the forward and reverse flow of materials, services, finances and information from the original producer to final customer with the benefits of adding value, maximizing profitability through efficiencies, and achieving customer satisfaction”.
Even with all the benefits that come from implementing SCM systems, they do not have the capability of developing the sophisticated analysis necessary to provide an integrated view of the SC. That is where BI takes place. With its tools and methodologies, such as data warehousing, “Extract, Transform and Load” (ETL), Online Analytical Processing (OLAP) and Data Mining (DM), BI provides the means for the identification, treatment and analysis of business data (Stefanovic & Stefanovic, 2009).
With focus on the past two decades, BI and related fields have grown considerably (Chen, Chiang & Storey, 2012). According to the Gartner Group (n. d.), analytics and business intelligence (ABI) may be defined as “an umbrella term that includes the applications, infrastructure and tools, and best practices that enable access to and analysis of information to improve and optimize decisions and performance”. Alongside analytics, BI proposes a set of techniques and methodologies which allow for critical business data to be integrated and analyzed, providing businesses the possibility of making better decisions. Through the combination of data mart modelling and tools, it is possible to extract, transform and load the core data into final structured data repositories. Then, with OLAP and reporting tools, explore the data and present it in an intuitive way according to the business needs (Chen, Chiang & Storey, 2012).
1.2. P
ROBLEM DEFINITIONCompany X is a Portuguese retail company that operates in the fields of consumer electronics (CE), household appliances and entertainment. It is currently present in Portugal, including Madeira e Açores, in more than 180 stores. Besides physical stores, it also has an e‐commerce channel, through which customers have access to a wide selection of products and brands, including exclusive brands. For their online sales, the overall process that a purchase order undergoes can be described by five milestones: Payment, System Integration, Expedition, Pickup of Product in the preparation site and Delivery to the final location. These steps are presented in Figure 1.1 below. Figure 1.1 – Overall Online Sales Process Depending on the size of the product, the delivery destination and the preparation site, orders may be subject to different processes. For example, in an omnichannel perspective, online sales may be delivered either in the customer’s home or in a desired pick up store location. Concerning the preparation, orders may be prepared either in the stores or in the warehouse. A store can be both a preparation and a pickup location, whereas the warehouse can only be a preparation location. The possible processes involved in an online sale will later be described in the “Conceptual Model Proposal” section.
Since the customers’ satisfaction is one of Company X’s main priorities, keeping track of every order and making sure that the delivery is made within the promised date is one of their biggest concerns. In the present moment, the solution developed to address this matter is built using Microsoft Access and Excel, which limits its performance considerably.
As it is not a properly structured solution, updates, errors corrections and other repetitive tasks represent a heavy workload for the members of the supply chain BI team. Also, due to the long time the updates require, it is not possible to deliver analysis in a timely manner, which is a big concern specially during discount events that overburden the supply chain. In addition, because of changes in the company’s supply chain management strategy, the currently used warehouse management system is being replaced. This implicates in the change of processes, data fields mapping and, consequently, in the invalidation of some parts of the current solution.
1.3. M
AING
OAL ANDS
PECIFICO
BJECTIVESThe goal of this project is to develop a conceptual model of a BI system to address the needs of an online sales supply chain end to end (E2E) operation, which comprehends the entire process since the purchase is made until the product is delivered to the final customer. It must allow the appropriate users to track the progress of each order as well as to assess the overall performance of each of the individual supply chain operations inside the E2E process. The proposed system should include a data mart model and dashboard models that may be applied outside of Company X’s reality. A case study will then be conducted in order to solve Company X’s problem by applying the proposed model. Figure 1.2 – Diagram showing the existing solution and the intended solution for Company X In order to achieve the goal presented above, the following specific objectives were defined. They were divided into two phases:
1. Conceptual model development
Identification of the business needs and the appropriate metrics to describe the online sales supply chain operation;
Development of a conceptual data mart model, with the identification of the appropriate dimensions, fact tables and granularity that should answer to the previously listed business needs; Proposal of dashboard models that should work as a control panel to monitor the online sales supply chain operation; 2. Application of the conceptual model to Company X’s scenario Definition of the software to be used; Application of the data mart model in Company X’s scenario; Identification of all data sources and development of the fields mapping in order to indicate from which fields, tables, data sources the necessary data can be extracted; Structuring of ETL processes to make them more efficient for the existing conditions; Application of the previously defined dashboard models in Company X’s scenario. 3. Discussion and evaluation of the results Analysis in order to understand if the BI solution developed achieved the proposed objectives and business requirements.
1.4. S
TUDYR
ELEVANCE ANDI
MPORTANCEBelow are listed this project’s main motivations:
At the moment, Company X’s supply chain’s BI team is overloaded with time consuming repetitive tasks, which results in a lack of time to develop improvement projects and analytical tasks; Since a lot of the work is done manually and involves data from multiple data sources, it often presents errors which implicate in the lack of information reliability; Due to the long time the updates require, it is not possible to deliver the necessary analysis in a timely manner, which is a big concern specially during discount events that overburden their supply chain.
Since there is not a central data repository, there is no consistency when comparing the information provided by different teams in the supply chain;
Due to the replacement of the warehouse’s management system, some parts of the existing BI solution are no longer valid.
Through the implementation of a well‐structured BI solution, Company X will be able to guarantee the quality of what is shared along their supply chain. It will also allow more accurate and faster reporting, it will optimize team members’ time and, consequently, improve employee satisfaction. Team members will be able to dedicate their time to more challenging and fulfilling projects, instead of manual repetitive tasks. Finally, it will give Company X competitive advantage in the market by increasing its adaptability. And also allow it to overcome the impact of a change in the warehouse management system.
Besides being relevant to Company X, the conceptual model proposed in this project may benefit other companies that are facing similar challenges. Although each case is different and brings its own needs, the model intends to propose the core fact tables and dimensions for a data mart that allows the tracking of the progress of an online sale throughout the supply chain of a company. Besides that, it should allow for the assessment of the overall performance of each of the supply chain operations involved in an online sale. As well as the data mart model, the dashboard models could be adapted for other company’s needs.
In an academic perspective, this project will also be relevant to studies which correlate BI, supply chain and e‐commerce. Although it is possible to find many studies concerning BI in supply chain or e‐ commerce’s supply chain, it is not common in the literature to find publications that correlate the three.
1.5. M
ETHODOLOGYIn order to develop this project, the chosen methodology is Design Science Research (DSR). According to Peffers, Tuunanen, Rothenberger & Chatterjee (2007), responsible for proposing a framework for Design Science Research Methodology (DSRM), it “contributes to information systems (IS) research by providing a commonly accepted framework for successfully carrying out design science (DS) research and a mental model for its presentation”. DSR has its primary focus set in the creation of new knowledge through the development and design of innovative artifacts and their performance assessment through reflection and abstraction. The outputs of DSR include algorithms, system design methodologies, languages, among others (Vaishnavi & Kuechler, 2004).
As it was already mentioned in the previous sections, the main goal of this project is to develop a conceptual model of a BI system that answers to the needs of an online sales supply chain end to end operation. Since it involves the creation of innovative artifacts and products in the field of IS which intend to answer to a specific problem in its own application environment, the DSRM was considered appropriate for the development of the project.
The DSRM proposed by Peffers, Tuunanen, Rothenberger & Chatterjee (2007) resulted from a consensus building approach which identified the key elements used in prior literature in DS research. The result consisted of a process model composed by six core activities: 1) Problem identification and motivation, 2) Definition of the objectives for a solution, 3) Design and development, 4)
Demonstration, 5) Evaluation, 6) Communication (Peffers, Tuunanen, Rothenberger & Chatterjee, 2007). A graphical representation of the model can be seen in Figure 1.3 below: Figure 1.3 – Process Model for DSR. Adapted from Peffers, Tuunanen, Rothenberger & Chatterjee (2007)
Problem identification and motivation: Definition of the specific research problem and the
identification of the solution relevance and importance (Peffers, Tuunanen, Rothenberger & Chatterjee, 2007). For this project, the motivation came from Company X’s need of a new and improved BI solution focused in its online sales supply chain end to end operation. As it was previously mentioned, the existing BI solution lacked in performance and resulted in time consuming repetitive tasks that overburden the supply chain BI team and resulted in unreliable information. Problem identification and solution value are presented in more detail in the “Problem Definition” and “Study Relevance and Importance” sections. Definition of the objectives for a solution: Identification of the objectives of a solution which should be inferred from the problem specification. These objectives should be rationally defined (possible and feasible objectives) and can either be quantitative or qualitative (Peffers, Tuunanen, Rothenberger & Chatterjee, 2007). For the current project, as it was specified in the section “Main Goal and Specific Objectives”, the main objective is centered in the development a conceptual model and application of a BI system that answers to the needs of an online sales supply chain end to end operation. Design and development: Creation of the artifact. Artifacts may be constructs, models, methods or instantiations (Peffers, Tuunanen, Rothenberger & Chatterjee, 2007). For this project, the artifact will consist of a conceptual model of a BI system which will be composed of appropriate metrics, data mart model and dashboard models to meet the previously described objective. Even though it is focused in Company X’s needs, the artifact must provide a solution that can be adapted for similar applications outside of the company. The design of the model will be defined considering the best practices identified in the “Literature Review” section.
Demonstration: Implementation/demonstration of the previously developed solution in order to solve
the identified problem. It may be done by experimentation, simulation, case study, proof or other appropriate activity (Peffers, Tuunanen, Rothenberger & Chatterjee, 2007). For this project, a case study will be conducted through the application of the proposed artifact to Company X’s problem. An analysis will be first developed in order to identify the best tools for the implementation of the solution, according to company’s available resources.
Evaluation: For this activity, it is necessary to observe and assess how the proposed artifact contributes
to the solution of the problem. It consists of comparing the obtained results of the implementation to the previously defined objectives. The evaluation may be done in many forms, such as, quantitative performance measures, satisfaction surveys, client feedback or simulations (Peffers, Tuunanen, Rothenberger & Chatterjee, 2007). For this project, the evaluation will be done through the assessment of the level of achievement of the artifact.
Communication: This activity is based in communication with the purpose of promoting awareness of
the problem and its importance, the solution through a proposed artifact, its design and effectiveness (Peffers, Tuunanen, Rothenberger & Chatterjee, 2007). In the current project, communication will be achieved through the development of the present report. Its structure is defined according to the DSRM and its process model.
2. LITERATURE REVIEW
This chapter consists of the literature review that serves as the theoretical basis for the development of the project. First, a study of SCM and its role in organizations is presented. The specifications of e‐commerce supply chain will be described in this section. Following, a topic for the application of BI solutions in the SCM area will be presented. Finally, the BI topic will be addressed. A study of the best practices in data warehousing, ETL, dashboard design and information visualization will be conducted.2.1. S
UPPLYC
HAINM
ANAGEMENTAs it was previously mentioned, the term SCM was introduced in the early 1980s by consultants. Since then, it has been used in reference to the planning, control of materials, logistics activities and information flows that exist within and between companies (Chen & Paulraj, 2004). Figure 2.1 below presents a typical supply chain.
Figure 2.1 – Typical supply chain of a company. Adapted from Chen & Paulraj (2004)
According to Lambert (2014), director of the Global Supply Chain Forum (GSCF), SCM can be defined as “the management of relationships in the network of organizations, from end customers through original suppliers, using key cross‐functional business processes to create value for customers and other stakeholders”.
Another definition, given by the Council of Supply Chain Management Professionals (CSCMP), states that the area of SCM “encompasses the planning and management of all activities involved in sourcing and procurement, conversion, and all logistics management activities. Importantly, it also includes coordination and collaboration with channel partners, which can be suppliers, intermediaries, third party service providers, and customers. In essence, supply chain management integrates supply and demand management within and across companies” (CSCMP, n.d.).
The proposed framework by Lambert & Cooper (2000) for SCM is composed by three main elements: the supply chain network structure, the supply chain business processes, and the supply chain management components.
When it comes to supply chain network structure, the authors intend to identify which are the key supply chain members with whom to link processes. These members may be defined as being the companies or organizations with whom the main company interacts with, directly or indirectly. If all types of members are included, the total network may become highly complex and difficult to manage. So, in order to make it more manageable, the authors distinguish members as being either primary or supporting. Although this distinction may not be obvious in all cases, it allows for the point of origin and the point of consumption of the supply chain to be defined (Lambert & Cooper, 2000). Supply chain business processes, on the other hand, refer to all processes that should be linked with the previously defined members. In order to manage an integrated supply chain, it is necessary to have continuous information flows, in which the customer is always the main focus of the process. This only becomes possible with accurate and timely information processing. This allows businesses to respond quickly to any changes in customer demand. Some of the key supply chain processes are: customer relationship management, customer service management, demand management, order fulfillment, manufacturing flow management, product development and commercialization and returns (Lambert & Cooper, 2000).
Last, but not least, Supply Chain Management components refer to the level of integration and management that should be applied for each process link. The level of integration and management
level of each component increase the level of integration and management. The authors identify nine main management components that are key for successful SCM: culture and attitude, power and leadership structure, management methods, product flow facility structure, organizational structure, work structure, planning and control and information flow facility structure (Lambert & Cooper, 2000).
2.2. I
NTERNETR
ETAILI
NDUSTRYS
UPPLYC
HAINDefined as being the segment of companies which sell products to customers, the retail industry is characterized by one main relationship: retailer and customer. This relationship leads to the interaction between retailers and suppliers: one retailer may have multiple suppliers, while one supplier may serve multiple retailers. This supply chain is subject to constant change and a dynamic environment in which the main driver is the retail customer. Before, customer purchasing habits could be satisfied only by managing inventory levels. However, their demands have changed and a certain level of customer service is now expected, which leads to the need of innovative solutions (Chiles & Dau, 2005). For a company’s supply chain to be successful, its chosen practices should be aligned with its business strategy. Even though focusing on operational effectiveness and cost reduction may help set a company’s position in the market, it is not enough to differentiate it in such a competitive environment. Focusing on performing the same activities better is not enough. According to Hammer (2004), the focus should be in achieving operational innovation, which involves performing different activities or adopting differentiating methodologies. By aligning operational effectiveness and a thought‐out business strategy, a company may develop unique practices that may provide continuous performance differentiation (Hammer, 2004).
An important segment of the retail industry is internet retailing. It can be defined as the group of companies that sells products or services though websites that act as online stores. These companies may operate through multiple channels. Traditional companies that only operate through physical stores are referred to as “brick‐and‐mortar”, while multichannel companies with online and physical stores are said to use a “click‐and‐mortar” strategy. Those retailers which do not operate through physical branches and rely solely on the internet are referred to as “pure‐play” (DeYoung, 2001). As stated by Meyer (2020), the global e‐commerce market has reached the mark of $3.5 trillion of sales by the end of 2019, which represents a total share of global retail sales of 14%. Predictions show a growth of two percentage points by the end of 2020 and a total of sales of $4.2 trillion (Meyer, 2020). With the Covid‐19 pandemic and consequent lockdown restrictions and business closures, ecommerce has been a convenient option for consumers to acquire all kinds of goods. In 2020’s first semester, June presented the biggest increase in global e‐commerce sales, with an increase in volume of 31% when compared to the previous year. Although customers are spending online more regularly, statistics show that the overall spending is slowing down (Toplin, 2020).
E‐commerce has changed significantly and is still changing the retailing industry. With its fast growth, internet retail has a great impact on supply chain logistics. Nowadays, companies face the need to adapt their supply chains in order to handle the growing volume of shipments that are now delivered directly to their customers. Also, system changes and better processes become necessary so as to
answer to a much higher volume of exchanges and returns (Barry, n. d.). Figure 2.2 below simulates a multichannel company’s supply chain which includes Warehousing, Distribution, Information Technology and Transportation Services.
Figure 2.2 – Representation of a multichannel company’s supply chain which includes Warehousing, Distribution, Information Technology and Transportation Services. Adapted from Barry (n. d.)
According to Klumpp & Jasper (2008), the changes caused by the e‐commerce growth on logistic processes are as follows: change in customers’ requirements, multiplicity of heterogeneous products, large number of low volume deliveries and direct delivery.
Change in customers requirements: Due to new buying experiences and to continuous innovation
provided by leading e‐commerce businsseses, customers’ expectations are increasing. Customers expect not only shorter delivery times, but also high availabitity of information in their shopping experiences. For example, in the purchase process, reliable information concerning delivery time as well as the possibility to track the order is expected. Also, with the convenience provided by the internet, customers expect smaller processing times and order fullfilment (Klumpp & Jasper, 2008).
Multiplicity of heterogeneous products: At the beginning, e‐commerce opperated specially in the
sales of products that could be easily packed or that were digitiseable. With its growth, the assortments available for sale expanded. Products available were then of multiple sizes, formats, contained multiple parts or could even be perishable. This expansion presented new challenges to the supply chain, as it was now necessary to develop new solutions for product storage and transportation (Klumpp & Jasper, 2008).
Large number of low volume deliveries: When it comes to business‐to‐consumer (B2C) sales,
businesses were used to dealing with few, large volume consignments which had to be delivered directly to the physical stores. However, with the expansion of e‐commerce, they had to adapt to deal with the ever growing online orders that were mostly small sized and of low volume that had to be delivered directly to the final customer. This presented a challenge as supply chain processes and warehouses layout had to be revised (Klumpp & Jasper, 2008).
Direct Delivery: In traditional retail, when making a purchase, the customer is expected to go directly
to a physical store. The stages of picking and delivery are performed by the customer at the place of sale. However, with e‐commerce, each purchase is then expected to be delivered at the customer’s place of preference, which could mean having to return several times in case of customer’s absence. In order not to overload the distribution system, businesses could choose to have these deliveries made by a parcel service, which would mean having additional fixed costs. Another solution would be limiting the supply area. Still, this goes against the goal of e‐commerce of expanding the market outside of the area covered by chain stores (Klumpp & Jasper, 2008). As mentioned before, in order to overcome these challenges and achieve a competitive position in the e‐commerce environment, innovation is key. It is no longer acceptable to focus only on performance by developing the same activities as every other business. When it comes to innovative solutions in e‐commerce supply chain, Amazon.com is one of the most referenced businesses. It first began selling books and music online in 1998. Its current scope of products though ranges from video games and electronics to food and cosmetics. According to ScrapeHero (2019), Amazon.com has a range of almost 120 million products as of April 2019. Figure 2.3 below shows Amazon.com’s top 10 categories. The measure presented is in millions of products per category. Figure 2.3 – Top 10 categories in Amazon as of April 2019. Adapted from ScrapeHero (2019) Amazon.com is also present in many different countries, such as United States, Brazil, Spain, the U.K. and many others. In order to grow and overcome the logistic challenges presented, the company relied
on technology and innovation. For example, as mentioned by Yu, Wang, Zhong & Huang (2016), the company employed different levels of automation depending on the size and shape of a product. For easily transported products, highly automated processes could be implemented, while irregularly shaped products required a lower level of automation (Yu, Wang, Zhong & Huang, 2016). When it comes to transportation of orders, Amazon relied on injection points which were strategically placed in districts where there was a high concentration of customers. When a purchase is made, the order first integrates in the distribution centers (DC) where it is prepared and then is shipped to one of these transportation hubs (Yu, Wang, Zhong & Huang, 2016). Another challenge faced by businesses concerns storage and inventory levels. Instead of keeping high inventory levels, Amazon integrated the inventories in their DCs with the inventories available in their partners’ warehouses (Chiles & Dau, 2005). This means that the accessibility to its partners’ inventories allowed the company to keep lower inventory levels. Instead of keeping the products in its own DCs, it may ship an order directly from the partner’s warehouse. The location for these DCs was defined taking into consideration both the level of taxes and the distance from the districts with high concentration of customers (Yu, Wang, Zhong & Huang, 2016).
2.3. B
USINESSI
NTELLIGENCE INS
UPPLYC
HAINM
ANAGEMENTAs stated by Liu (2010), in today’s highly competitive market, adopting SCM became a form of obtaining advantage. The author states that competition is no longer between enterprises, but between supply chains. Great competitive advantage can then be achieved by guaranteeing effective integration and cooperation within the supply chain. A higher level of integration requires effective information flow and analysis, which can only be obtained through the implementation of the appropriate practices and technologies (Liu, 2010).
Waller & Fawcett (2013) note that every day more and more data is recorded and it presents both opportunities and challenges in SCM. The growing volume of data resulted in data sets so big that it is no longer practical to use conventional data management tools. In Table 2.1 below, the authors present examples of potential applications of big data in logistics.
(2013) Considering the potential in big data, analytics and with the proper set of tools and techniques, it is possible to produce breakthrough insights that may lead to risk and cost reduction while providing higher service levels and operational agility (Deloitte & MHI, 2016). According to Ittmann (2015), one of the greatest trends observed among companies in the past years is the awareness of the necessity for decision‐making processes to be more data‐driven. The author also presents the events that combined contributed for the expansion of supply chain analytics: growing supply chain data, cheaper data storage, faster and ever‐increasing processing power, anywhere and anytime connectivity since mobile data is available almost anywhere, better tools that made analysis simpler and advanced tools and techniques for data visualization. As stated by Langlois & Chauvel (2017), a great volume of data is produced within the supply chain and it has to be processed. The greater the volume, the greater the competition. The expectations for faster deliveries and decision making are high. In this context, BI provides the means for businesses to achieve success and manage their supply chain more efficiently (Langlois & Chauvel, 2017).
As it was already mentioned in the “Introduction”, the Gartner Group (n. d.) defines analytics and business intelligence (ABI) as “an umbrella term that includes the applications, infrastructure and tools, and best practices that enable access to and analysis of information to improve and optimize decisions and performance”.
The framework for developing a Business Intelligence system may be represented through the following stages: identification of all the different data sources and mapping of the data according to the business needs, ETL (extraction, transformation and load) of the previously identified data into a data warehouse and data marts, development of reports, cubes, use of data mining methodologies and optimization (Vercellis, 2009). This framework, however, evolved into what can be seen in Figure 2.4. According to Hansen (2020), data marts came to be due to the fact that the “central data warehouse couldn’t scale to meet the different workloads and high concurrency demands of end‐users”. Data lakes, on the other hand, traditionally used to store raw data, became a necessity once the traditional data warehouse “wasn’t able to store and process big data (in terms of volume, variety, and velocity)” (Hansen, 2020).
Figure 2.4 – Modern data architecture. Adapted from Hansen (2020)
According to Nenad Stefanovic, Vidosav Majstorovic & Dusan Stefanovic (2006), an appropriate supply chain intelligence (SCI) model would be as follows n Figure 2.5. Figure 2.5 – SCI Global Model. Adapted from Stefanovic, Majstorovic & Stefanovic (2006) After defining the business requirements, the authors base their model in a Supply Chain Operations Reference (SCOR) model which “contains standard descriptions of management processes, a framework of relationships among the standard processes, standard metrics to measure process performance, and management practices that produce best‐in‐class performance” (Stefanovic, Majstorovic & Stefanovic, 2006). Further, they focus in a specific business subject which results in the development of diagrams using the Unified Modeling Language (UML). After the definition of specific processes, the SCI model leads to the development of a data warehouse which involves designing schemas with the definition of the appropriate fact tables, dimensions, measures, hierarchies and aggregations. The last step is analytics and it involves the development of reports, key performance indicators (KPIs), data mining analysis and scorecards (Stefanovic, Majstorovic & Stefanovic, 2006).
2.3.1. Data Warehouse
According to Inmon (2002), a data warehouse is a data repository that composes the “heart of the architected environment” and should support management’s decisions. The author notes that a data warehouse (DW) should have the following characteristics: subject oriented, integrated, nonvolatile, and time‐variant. Subject Oriented: Instead of providing information concerning a company’s ongoing operations, the data warehouse should be modeled according to the specific subjects of interest. For example, sales and marketing can be subject areas.Integrated: As stated by Inmon (2002), this is the most important aspect of a data warehouse. As the data is extracted from various data sources, transformed and loaded, it should keep its consistency. Formatting and naming conventions should be universally accepted within the company. This means that, once the data is loaded within the data warehouse, there should be a “single physical corporate image”. Nonvolatile: By this, the author means that unlike in the operational environment, data within the data warehouse is not updated or erased. When data undergoes any changes, the record is kept and a new snapshot record is written (Inmon, 2002). This helps further historical data analysis and understanding. Time‐Variant: In the data warehouse, data is always associated with a certain moment in time. Every record is accurate at some point in time. Some even contain a time stamp (Inmon, 2002). Kimball & Ross (2011) propose a four‐step process for designing a data warehouse model. The steps are the following: 1) Select the business processes, 2) Define the granularity (level of detail associated with fact table measurements), 3) Identify the dimensions (provide description for the measurements), 4) Identify the facts. In order to implement dimensional models in relational database systems, the authors present the use of star schemas. It is considered the simplest form of schema and is widely employed in the development of data marts. The name is due to their star‐like structure, as it is shown in Figure 2.6 below.
Figure 2.6 – Star Schema. Adapted from Kimball & Ross (2011)
In Figure 2.6 above, it is possible to see that the center of the star is composed by the fact table. This table stores summarized records of business process events and their respective performance measurements (Kimball & Ross, 2011). The dimensions, on the other hand, would be the ends of the star. These tables are used for descriptive purposes and provide context to the business process events in the fact table. According to Han, Pei & Kamber (2011), another form of a multidimensional model would be the fact constellation schema. It is mostly used in more sophisticated applications in which more than one fact table is needed. Dimension tables are then shared between the multiple fact tables. Authors Han, Pei & Kamber (2011) also clarify the difference between data warehouse and data mart. While a data warehouse gathers information concerning the entire organization, a data mart is focused on a single department. The authors refer to the data mart as “a department subset of a data warehouse that focuses on selected subjects”. They state that, due to its complexity, fact constellation
schemas are more commonly used in, but not restricted to, data warehouses. Then, for a data mart, a star schema would be more common (Han, Pei & Kamber, 2011).
2.3.2. Information Visualization and Dashboard Design
As stated by Ware (2013), “we acquire more information through vision than through all of the other senses combined”. Nowadays, the term “visualization” is strongly related to graphical representations of data or concepts and is an important part of the decision‐making process within companies. According to Ware (2013), visualization brings a series of advantages, being these the following: The capability of making sense of large volumes of data; The ability to identify patterns and obtain insights that otherwise were not evident; The improvement in data quality control; visualization provides a better perception when it comes to how the data was collected and if there are any problems with it; Visualization also contributes to the formation of hypothesis. The visualization process consists of four major stages: 1) data collection and storage; 2) preprocessing of data in order to make it easier to work with; 3) transformation of data into visual representation; 4) visual and cognitive processing of information. Figure 2.7 below presents a diagram with the visualization process:
Figure 2.7 – Visualization process. Adapted from Ware (2013)
According to Hubbard (2014), measurements are important because of three main reasons: 1) they support decision making processes; 2) some measurements present their own market value and can be sold to interested parties (an example would be the results of consumer surveys); 3) measurements can have an entertaining purpose, so as to satisfy user curiosity or bring clarification.
When it comes to decision making, reason 1 presented above, Hubbard (2014) states that “management needs a method to analyze options for reducing uncertainty about decisions”.
Given the need for proper measurements and data visualization, dashboards became extremely popular. Bakusevych (2018) defines a dashboard as “an at a glance preview of the most crucial information for the user at the moment he is looking at it, and an easy way to navigate directly to various areas of the application that requires users’ attention”. In order to design an ideal dashboard, Janes, Sillitti & Succi (2013) propose a technique consisting of two main steps: 1) selecting the proper data to extract and 2) choosing the proper data visualization technique. 1. Choosing the proper data: The authors propose a Goal – Question – Measurement (GQM) model. A model diagram is provided in Figure 2.8 below. Figure 2.8 – GQM model. Adapted from Janes, Sillitti & Succi (2013) a) Goal: The “goal” part (conceptual level) is consisted of defining the purpose of the study, which gives a notion of reason, environment, points of view and what aspects to consider to deliver the final result; b) Question: The “question” part (operational level) considers which aspects, processes and their properties are relevant, taking into consideration the “goal” and what is necessary to achieve it;
c) Measure: The “measure” part (quantitative level) takes into consideration the questions provided in the previous level and define which would be the proper data to collect to answer them.
2. Choosing proper visualization: According to the authors, in order for the user to obtain specific information from a dashboard, the following considerations should be taken into account:
a) Visualizing the dashboard should be effortless. For example, it can be displayed in monitors positioned in strategic places inside the company;
b) Interactions with the dashboard should be avoided, meaning the visualization should be enough for the user to understand the data. Interactions should only be used when the user wants to investigate further; c) Visualizing and understanding the dashboard should be a fast and easy process, which implies that changes in the design should be avoided (always display the same information in the same place); d) Use techniques to draw the attention of the user to the most important information, but not overdo it; e) Make the design and the visuals appealing to the users in order to draw their attention to the dashboard and capture their interest.
Bakusevych (2018) also provides guidelines for designing a dashboard. Similarly, from the first presented model, the first step would be defining the purpose of the dashboard. For example, dashboards can be categorized as: analytical, strategic, operational and tactical. In the present project, the purpose is to design operational dashboards which deal with time‐sensitive tasks. By providing information in a quick and effective way, the users are able to visualize deviations and take immediate action. Still, when it comes to an overall analysis of the E2E process, analytical, strategic and tactical level information may be present in the design of the dashboard. The author then proposes choosing the proper visualization for the data (Bakusevych, 2018). In order to achieve effective communication of information within a company, choosing the right chart type is essential. The chosen chart should correspond to the purpose of the displayed information, if it is either a comparison, a distribution, a composition or a relationship (Abela, 2006). Figure 2.9 below presents a guideline for the process of defining the right chart:
Figure 2.9 – A guideline for choosing the proper chart. Adapted from Abela (2006) In the next step, the author gives a reminder to stick to naming conventions and to provide effective formatting. Large values should be truncated and dates should be clear. Dashboards are supposed to deliver the right information, at the right time, in a clear and effortless way (Bakusevych, 2018). Finally, Bakusevych (2018) addresses the dashboard design theme. According to the author, the visualizations should provide the key information. As users tend to “read” dashboards similarly as they do with texts, their attention is primarily drawn to the top left corner. Figure 2.10 bellow presents a diagram of how people usually scan through dashboard content.
Figure 2.10 – Reading gravity. Adapted from Reporting Impulse (2019) While important information should have large representations and should appear in areas users are more likely to draw their attention to, less important information should be handled with an opposite approach (Few, 2007). Also, there should be a continuous flow in the dashboard. Related information should be displayed together in order to avoid going back and forth (Bakusevych, 2018).
3. CONCEPTUAL MODEL PROPOSAL
The present chapter consists of the “Design and Development” step proposed in the DSR methodology. As mentioned in the “Main Goal and Specific Objectives” section, this conceptual model must be designed to not only answer to Company X´s needs, but to present a solution to similar problems outside of the company. Still, one of the main motivations for this project is focused on Company X´s supply chain E2E operation. That being said, comprehending the company´s existing process flows is crucial.
So, initially, this chapter presents a “Context” section consisted of the process flows and the identification of the target users.
Following, in the “Overall Requirements” section, the needs observed for Company X are extrapolated. Only the key requirements are listed so as to make this conceptual model adaptable to other companies with similar needs. Then, in “Measures and Metrics”, as the title says, the proper measures and metrics are chosen. In the next three sections, a proposal for the system architecture, data mart conceptual model and dashboards conceptual models is made.
3.1. C
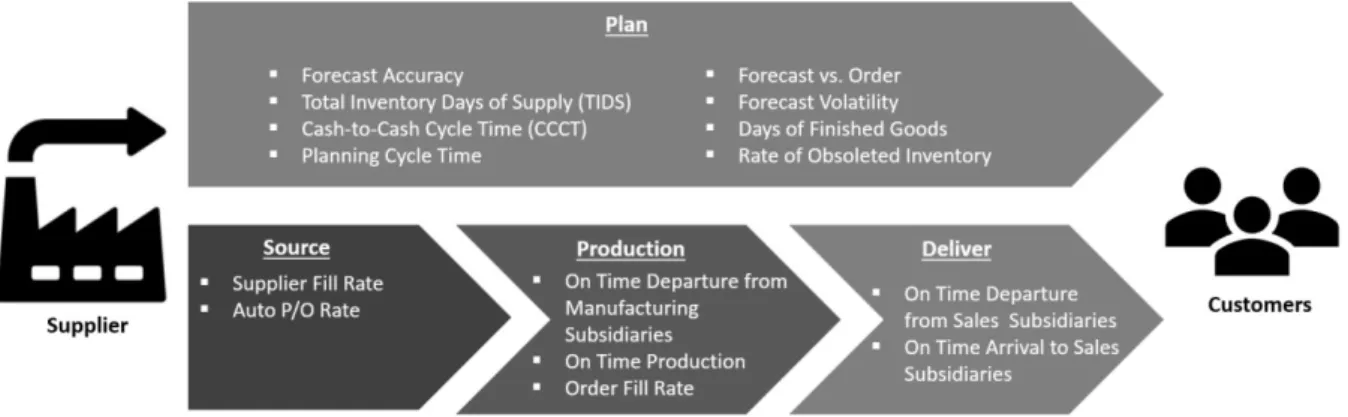
ONTEXTAs it was previously discussed in the literature review, Nenad Stefanovic, Vidosav Majstorovic & Dusan Stefanovic (2006) proposed a SCI model composed of six main steps. According to the authors, after defining the objectives and requirements, a SCOR model must be made. Since a complete SCOR model for the supply chain is not part of the scope of this project and is not viable, only the main process flows needed to provide a solution will be discussed. Then, in the following sections, proper metrics and KPIs will be defined.
For Company X, the supply chain E2E operation can be divided into three main groups: Systems, Operation and Transportation. Before explaining the responsibilities for each of these groups, an overall view of the online sales process will be given. Figure 3.1 below presents a diagram of the process.
Figure 3.1 – Overall Online Sales Process