71
Nitrogen use efficiency in cereals production under
Mediterranean conditions
Mário carvalho, Universidade de Évora, Instituto de Ciências Agrárias e Ambientais Mediterrânicas (ICAAM), Portugal. [email protected]
Key words: Nitrogen; rainfall; type of fertilizer; crop rotation; soil organic matter
Abstract
Nitrogen use efficiency (NUE) for cereal production in Mediterranean regions is generally low due to N losses over winter and difficulties in calculating the optimum N level for a particular season, given that it depends on the existing rainfall pattern. The required N level can be estimated using models that relate wheat yield, nitrogen level and the amount of rainfall. However, significant increases in NUE of the applied N are best obtained by increasing soil organic matter content.
Introduction
The efficient use of nitrogen for winter-sown cereals is particularly difficult under Mediterranean conditions, due to climatic and edaphic constraints. The cereals are usually sown in November. Tillering and spikelets differentiation take place during December and January, so nitrogen has to be available for the crop at this time, when N loss by leaching or in gaseous form is inevitably large. Almeida (1965) measured losses up to 90 kg N ha-1year-1 at Tapada da Ajuda (Lisbon) and this is certainly one of the explanations for the low NUE of cereals production in Mediterranean regions (Alves 1979). A further difficulty is the very great variability of annual rainfall in Mediterranean regions. As rainfall influences both yield potential of cereals and nitrogen loss, the optimization of nitrogen fertilizer application is a very difficult task in the region (Carvalho and Basch 1996). Therefore the development of a model relating winter rainfall, nitrogen level and expected yield could help avoid gross mistakes and contribute to increasing NUE. However, to increase NUE in the region it is also necessary to reduce N loss from applied fertilizer and to increase soil N content. The application of nitrification inhibitors together with ammonium-based fertilizers has the potential to reduce N losses by volatilization and leaching (Di and Cameron 2002; Liu
et al. 2013). Soil N can be increased by including a legume in the crop rotation,
although results can be erratic as biological N fixation can vary widely depending on ambient conditions (Nutmann, 1976). Another possibility is to increase soil organic matter (SOM). However, this is difficult under Mediterranean conditions (Alves, 1961) due to the effect of temperature on the rate of mineralization (Jenkinson and Ayanaba, 1977).
In this paper, results of studies carried out at the University of Évora to evaluate these various approaches for enhancing NUE of the applied N in wheat production in the south of Portugal are discussed.
Material and Methods
Only a summary of the experimental procedures are reported below but a more detailed account is given in Carvalho et al (2005)
Development and testing of the N application model for Mediterranean conditions
The experiments to develop the N management model according to the winter rainfall were carried out between 1995/96 and 1998/99, on a Luvisol at Revilheira
72 Experimental Farm 20 km south of Évora. Three rates of N (0, 40 and 80 kg N ha-1) were applied with 1/3rd at seeding (15th November) and 2/3rd at first top dressing (20th January). In addition another three rates of N (0, 60 and 120 kg N ha-1) were applied at second top dressing (28th of February). Treatments were in a factorial combination. The model was then developed and tests carried out in the 2001/2002 and 2003/2004 seasons on two soils, a Luvisol and a Vertic soil.
Use of NH4-based fertilizer and a nitrification inhibitor
. Two different fertilizers were compared (ammonium sulfate+ 3,4-dimethyl pyrazole phosphate - DMPP and NH4NO3) at four nitrogen rates were tested (20, 40 60 and 80 kg ha-1). At seeding (15th November), 20 kg N ha-1 as NH4NO3 was applied and the remainder was applied as a first top dressing (20th January). The combination of NH4+ DMPP was applied as a single application at seeding. The N content in the shoots of the wheat was determined at the normal time for a second top dressing (28th February). The experiment was carried out on a Luvisol in the season 2003/2004, also at Revilheira Experimental Farm (near Évora).
The effect of legumes on the N fertilizer response of wheat
A two year crop rotation was studied over the seasons 1991/92 and 1995/96. The legumes tested were three grain legumes (Faba bean; pea and chickpea), three forage legumes for hey (annual medic; red clover and Persian clover) and sunflower as a non-legume control. Four nitrogen levels were applied during the wheat phase of the crop rotation (0, 60, 120 and 180 kg N ha-1). The experiment was carried out on a Vertic clay soil in the Almocreva Experimental Farm, 10 km of Beja.
Effect of soil organic matter (SOM) on the response of wheat to N fertilizer application
A long-term field experiment comparing tillage systems and crop residue management was carried out at Revilheira Experimental Farm on a Luvisol. The crop rotation of the experiment was lupine wheat oat for hay barley. The plots under conventional tillage (plough and disc harrow) with cereal straw removed (1.04% SOM in the layer 30 cm) and the plots under no-till with cereal straw retained (2.12% SOM in the layer 0-30 cm) were used in a nitrogen response experiment. Four nitrogen levels were used (0, 60, 120 and 180 kg N ha-1) (20 kg N ha-1 at seeding and the rest equally applied as two top dressings).
Results and Discussion
Wheat yield (Y), nitrogen level for maximum yield (N) and rainfall (R1 – from first of November to 20th of January; R2 – from 21th of January to 28th of February) were related according to Equation 1.
Y = 574 + 10.25 N – 0.04 N2 – 1.76 R
1 + 0.001 R1N + 19.6 R2 + 0.09 R2N (1) F[6,74] = 106.81 p < 2.15 E-34 R2 = 0.90
The derivative of the equation with respect to N (with a return of 4 kg of wheat per kg of N – derivative equal to 4) gives the N (kg N ha-1) to be applied according to rainfall (Equation 2).
N = 78.1 + 0.01 R1 + 1.1 R2 (2).
The experiments carried out to validate the nitrogen management model indicate that the recommended N rate were always a good option. Therefore, this model can help to increase NUE by adjusting the N rate to the rainfall pattern of the year, reducing the
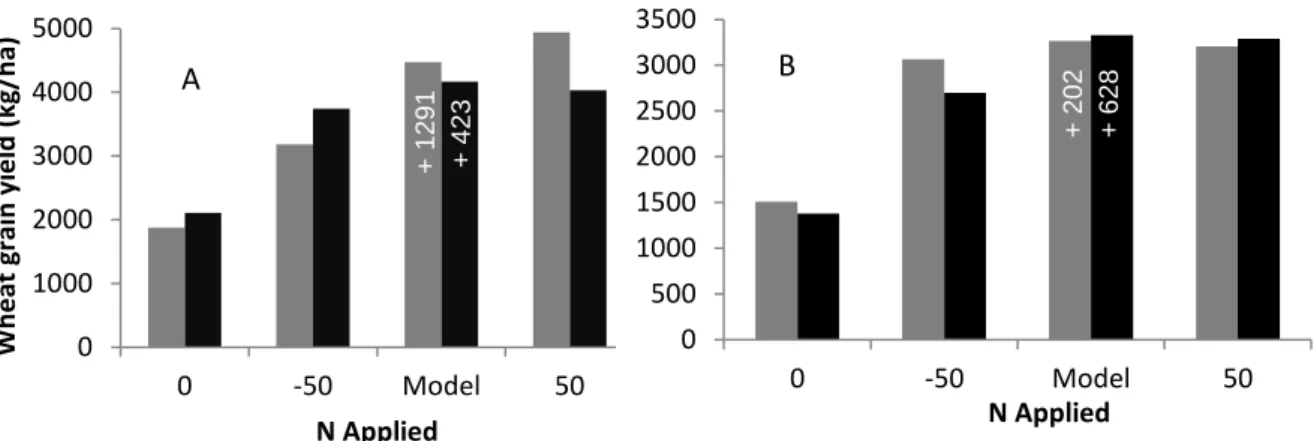
73 mistakes associated to the variability of Mediterranean climatic conditions. However, the NUE in a wet season remains very small (Figure 1).
Figure 1: Validation of the N fertilizer management model (Equation 2) in a luvisol (A) and a vertic clay soil (B). Model – N fertilizer was applied according to Equation 2; - 50 N fertilizer was reduced by 50 kg N ha-1 and 50 was increased by 50 kg N ha-1 in relation to the Model amount. Grey bars – 2001/2002 season; black bars – 2003/2004 season. The values in the bars indicate the yield increase of the N level indicated by the model in relation to the -50 treatment.
The possibility of increasing NUE by reducing N loss by leaching and volatilization through applying ammonium fertilizer together with a nitrification inhibitor was unsuccessful. A single application of ammonium sulfate + DMPP did not improve the NUE beyond using the same amount of N applied as NH4NO3 but given as a split application (Figure 2).
Figure 2: Effect of the N fertilizer applied at seeding and first top dressing on the N recovered by the wheat shoots at the time of a second top dressing. Black bars – NH4NO3; grey bars – NH4+DMPP.
Legumes increased the N content of the soil and therefore potentially could allow a reduction in the amount of N to be applied to a following cereal crop. In comparison to sunflower, the legumes increased the soil total N at the seeding of the wheat, with forage legumes being more effective than grain legumes (data not shown). However, the wheat response to N fertilizer was similar after the three groups of preceding crops. The most economic N rate was the same for all the combinations (12 g N m-2), and only
0 1000 2000 3000 4000 5000 0 -50 Model 50 Wh e at gr ain yi e ld ( kg/ h a) N Applied 0 500 1000 1500 2000 2500 3000 3500 0 -50 Model 50 N Applied A B + 1 2 9 1 + 423 + 202 + 628 0 1 2 3 4 5 20 40 60 80 Sh o o t N c o n te n t (k g N h a -1)
N Applied (seeding + first top dressing) (kg N ha-1)
c cd cd bc a cd ab ab
74 1 1.2 1.4 1.6 1.8 2 2.2 0 2 4 6 8 10 12 So il o rg an ic matte r ( % ) ( 0 -30 c m)
Year of The Experiment
CT RT NT NT+S
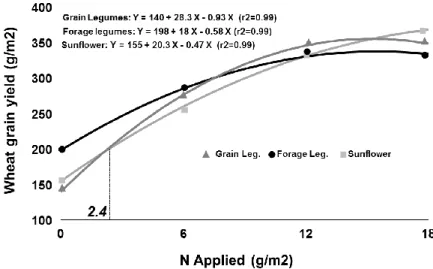
2.4 g N m-2 would have been required for the wheat after sunflower to match the yield of wheat after forage legumes without nitrogen (figure 3).
Figure 3: Effect of the preceding crop on the wheat response to N fertilizer application. The values presented are the average of four years.
This indicates that wheat recovered a small part of the N left in the soil after the legumes but this had no effect on NUE. From an environmental point of view, the advantage of the legumes as preceding crops is also questionable, once the reduction of N input to the following wheat crop is much less than the nitrogen left in the soil after the legume.
The effect of tillage system and crop residues management on the soil organic matter content is shown in Figure 4. If the straw of cereals is maintained at the soil surface and no till is adopted for all crops in the rotation, it was possible to increase SOM from a value around 1 to a value of 2.2%, in the 0-30 cm layer.
Figure 4: The effect of soil tillage system and crop residues management on the soil organic matter content of a Luvisol. CT – Plow + disc harrow with cereal straw removed; RT – Tine cultivator with cereal straw removed; NT – No till with cereal straw removed, NT+S – No till with cereal straw maintained.
75 0 60 120 180 N Applied (k g N/ha) 0 5 0 0 1 0 0 0 1 5 0 0 2 0 0 0 2 5 0 0 3 0 0 0 3 5 0 0 4 0 0 0 W h e a t yi e ld ( kg /h a ) 1 % S O M 2 % S O M 3 % S O M 3 7 3 8 6 2 9 8 3 5 8 7 1 6 0 3 0 6 3
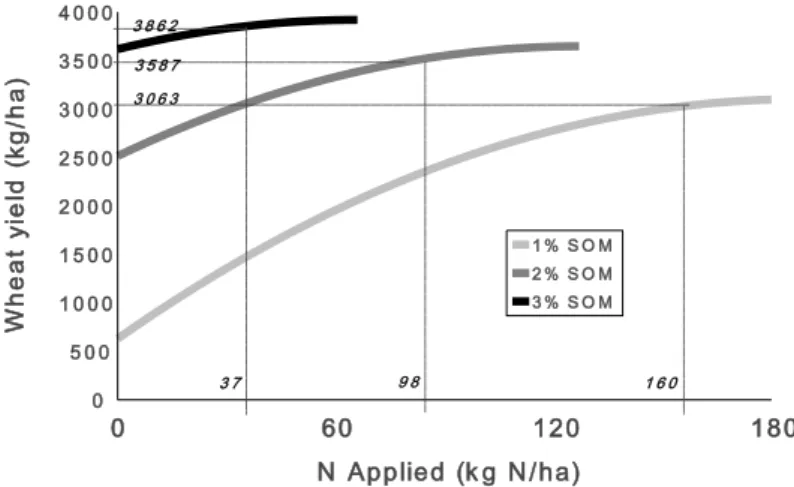
Figure 5: Effect of soil organic matter content (0-30 cm) (SOM) on the wheat response to N fertilizer. Plots under CT and NT+S (figure 4) were used in this study. Numbers in italics represents the optimum N level (x axis) and the corresponding wheat yield (y axis).
Using the areas under the curves for treatments CT and NT+S to obtain a value for SOM, it was possible to relate the wheat yield (Y kg ha-1)), the nitrogen fertilizer applied (N kg N ha-1) and the soil organic matter content (SOM %)) (Equation 3). Y = 631 + 35N – 0.07N2 + 2718 ln(SOM) – 8.6N(SOM) (R2=0.80 p<0.001) (3)
The yield potential increased with SOM and there was a negative interaction between nitrogen and SOM. This means that the amount of nitrogen to be applied declines with the increase in SOM. The graphic representation of Equation 3 for three different levels of SOM (Figure 5) shows that the optimum N level was 160 kg N ha-1 for 1% of SOM, while for 3% SOM the optimum N level was only 37 kg N ha-1 but the wheat yield increased from 3063 to 3862 kg ha-1. The NUE for the applied N increased from 19 to 104 kg of wheat per kg of applied N.
The NUE for cereals production under Mediterranean regions is generally low due to large potential N losses during the winter and due to mistakes in determining the correct amount of N to be applied, given that winter rainfall influences both the yield potential and N losses. To avoid errors in determining the N requirement it is necessary to apply fertilizer according to the amount and distribution of rainfall, instead of calculating the N required from expected yield and estimated N losses. The benefits of using ammonium fertilizers with nitrification inhibitors or to include legumes in the crop rotations seem to be questionable. However, a significant increase in NUE is possible if SOM is improved, and it is foreseen that a very large NUE can be achieved for values of SOM around 3%.
References
Almeida LAV (1965) A lavagem do azoto dos adubos elas águas das chuvas num solo granítico. Anais ISA 7: 263-288.
Alves JA (1961) O problema da manutenção da fertilidade na agricultura do sul. Melhoramento 14: 13-411.
Alves JA (1979) Efeito dos adubos azotados sobre o peso e o teor de azoto do grão, a exportação e a recuperação do azoto aplicado na cultura do trigo. Ministério da Agricultura e pescas, INIA, Oeiras. Carvalho M, Basch G (1996) Optimization of nitrogen fertilization. Fertilizer research 43: 127-130.
76
Carvalho M, Basch G, Alpendre P, Brandão M, Santos F, Figo M (2005) A adubação azotada do trigo de sequeiro: o problema da sua eficiência. Melhoramento 40: 5-37.
Di HJ, Cameron KC (2002) The use of a nitrification inhibitor, dicyandiamide (DCD), to decrease nitrate leaching and nitrous oxide emissions in a simulated grazed and irrigated grassland. Soil Use and Management 18, 395-403
Jenkinson DS, Ayanaba A (1977) Decomposition of carbon-14 labeled plant material under tropical conditions. Soil Sci Soc Am J 41:912–915
Liu C, Wang K, Zheng X (2013) Effects of nitrification inhibitors (DCD and DMPP) on nitrous oxide emission, crop yield and nitrogen uptake in a wheat–maize cropping system. Biogeosciences, 10, 2427–2437.