PHYSICOCHEMICAL AND SENSORIAL CHARACTERIZATION OF
PORTUGUESE BREAD FROM VISEU REGION
Ângela Rodrigues1, Raquel Guiné*1,2, Paula Correia1,2 1
Escola Superior Agrária de Viseu, Viseu, Portugal. 2CI&DETS, Instituto Politécnico de Viseu, Viseu, Portugal.
*Corresponding author: Phone: +351232446600 Fax: +351232426536
E-mail address: [email protected]
ABSTRACT: The aim of this study was to characterise the most typical flour mixture bread (wheat
flour and rye flour) produced in the Portuguese region of Viseu and evaluate if there are relevant differences between the samples tested. Nine samples from local producers were analysed considering the morphology, physicochemical (density, alveolus percentage, texture, colour and water activity) and sensorial properties. The form and dimensions of all breads were determined, as well as proximate composition and total salt content.
The forms of the breads were different, some round and others long. Nutritionally this type of bread turned out to be a food with high nutritional value, high percentage of ash (2.8-4.9%) and low values of fat, with a high range of salt content (0.4-1.4%). The physical properties were quite different between samples, although some of them are not perceptible by the consumer. This was the case of bread density whose results were 0.25-0.56 and the sensorial panel, constituted by a panel of 40 untrained tasters aged 7 to 63 years, did not find any difference. The traditional breads presented overall appreciation between 4.8 and 6.8, related with different colour and elasticity parameters.
Key words: bread, density, texture, colour, salt, sensorial analysis
INTRODUCTION
Bread is a food with an ancient history that assumes in diet a great cultural, social and religious importance. Bread is part of daily life for many people, starting right at breakfast, and is regarded as the basis of feed and the first source of energy (Vaz, 2004). The main ingredients of bread are flour, water, salt and yeast, of which the flour is assumed as the mass structural component, and therefore the key ingredient to obtain the bread. Water is also an essential ingredient in the formation of the mass. The salt helps in controlling fermentation, contributing to the fortification of the gluten in the flour, being decisive in the hydration of the masses, acting also as a flavour enhancer turning the bread crumb whiter (Leon and Rosell, 2007). The yeast carries out alcoholic fermentation, i.e. converts the fermentable sugars present in the mass into ethanol and carbon dioxide, which is the gas responsible for the growth of bread. Bread quality is highly dependent on the cereals most commonly used, for being considered the nobler, is wheat (Triticum, and more specifically
Triticum sativum).
The advantages of a diet rich in vegetables and fibre are known since ancient times. However, only from the twentieth century there was a real concern about the low level of fibre intake in most diets. Wheat flour is an excellent source of fibre, particularly insoluble fibre (Leon and Rosell, 2007). Also the rye flour has high fibre content, especially dietary fibre, thus having positive effects on digestion and decreasing the risk of coronary heart disease, hypercholesterolemia, obesity and diabetes (Leon and Rosell, 2007). According to Pathlrana and Shahidi (2007), wheat is also a major source of antioxidants, in many cases greater than most fruits and vegetables. Among the antioxidants found in wheat highlights some phenolic acids such as ferulic, phytic or selenium acids, flavonoids, among others. As with most of the vitamins and minerals, also antioxidants are present in wheat in the bran and germ, and thus their content is reduced during the grinding process for obtaining flour (Pathlrana and Shahidi, 2007).
Addition of small amounts of rye flour to products made with wheat flour promotes the water absorption and prolongs the shelf life of the product, since it reduces the amount of amylose and amylopectin available to suffer retrogradation. As the artisan baking process is extended to industrial scale, the use of flour enhancing agents has been applied, because of the need to improve the process characteristics and shelf life of the products obtained. For decades, the enzymes were added to flour in bread production in order to improve its volume, flavour, aroma, structure of the crust and crumb, tenderness and shelf life (Nunes, 2008).
In Portugal they are known more than 100 varieties of bread. The raw material used (corn, wheat or rye) is very much dependent on the region and the weather. Various types of bread are obtained, according to cereals used (corn, wheat, rye, mixtures, whole flours), as well as the manufacturing process and type of fermentation (Almeida et al., 2008).
MATERIAL AND METHODS
Samples
In order to obtain a significant sampling, seven types of regional bread were collected in the district of Viseu, Portugal, and for each type three samples were taken triplicate. Each type of bread was accompanied by an identification form, having all the characteristics of raw materials and manufacturing process.
Chemical analyses
Several experimental determinations of chemical properties were done: moisture content, water activity, ash content, crude fat, crude fiber content, protein content, using the official methods of AOAC (2000). Determination of Chloride was done by the Mohr Method and the determination of carbohydrates was accessed by difference.
Physical analyses
In this study we performed several experimental determinations of physical nature such as size, color, density, alveolar characterization and cellular texture. To analyze the dimensions and volume of the loaves were measured the thickness, width and length. For calculating the volume the form was approximated to an ellipsoid. To determine the density were carefully cut pieces of bread in the form of parallelepipeds. From each sample were taken 15 cubes with 1 cm edge, which later were weighed on a precision scale.
In this study, the color parameters were evaluated using a colorimeter chroma meter (Minolta, Japan) expressing the results in the CIELab system coordinates: L* which is the brightness and varies between 0 (black) to 100 (white), the a* ranges from -60 (green) to +60 (red) and b* ranging between -60 (blue) to +60 (yellow). It was also determined cylindrical color coordinates: value, shade or hue (hº) and saturation (C):
10
*
L
Value
(1)*
*
tan
º
1a
b
H
; if a*>0 and b*>0 (2) 2 2*
*
b
a
C
(3)To do the alveolar characterization image analysis was used, using the program "Image J", developed by Wayne Rasband at the National Institute of Mental Health United States of America. From each sample, 5 fresh slices were prepared with a thickness of 10 mm (pattern cutting). For the analysis of texture properties was used a texturometer TA-XT2 from "Stable Microsystems." The analyses were performed immediately after manufacture, and for that were cut out seven slices (10 mm) per sample, removing a cube per slice (crumb) 30 mm edge.
Sensorial analyses
Sensory analysis was performed in a laboratory prepared for that purpose, on the day of delivery of the samples by a panel of 40 untrained tasters, aged between 7 and 63 years, who were asked to rate the following attributes: crumb colour, crust colour, aroma (bread, firewood and fermented), taste (bread, wood or fermentation), elasticity, density, and finally the overall appreciation. In this test the taster expressed the intensity of each attribute through a scale where verbal Hedonic expressions are translated into numeric valuesin order to allow statistical analysis. The scale of values varied from 0 (less intense) to 10 (more intense).
RESULTS AND DISCUSSION
Tables 1. to 5. show the results of the different determinations made to all the bread samples analysed in terms of medium values, standard deviations and analysis of variance. Samples that have the same letter show no significant differences in the parameter analysed, for p> 0.05. Thus, the greater the number of letters of classification, the greater the ability to discriminate between samples.
Chemical properties
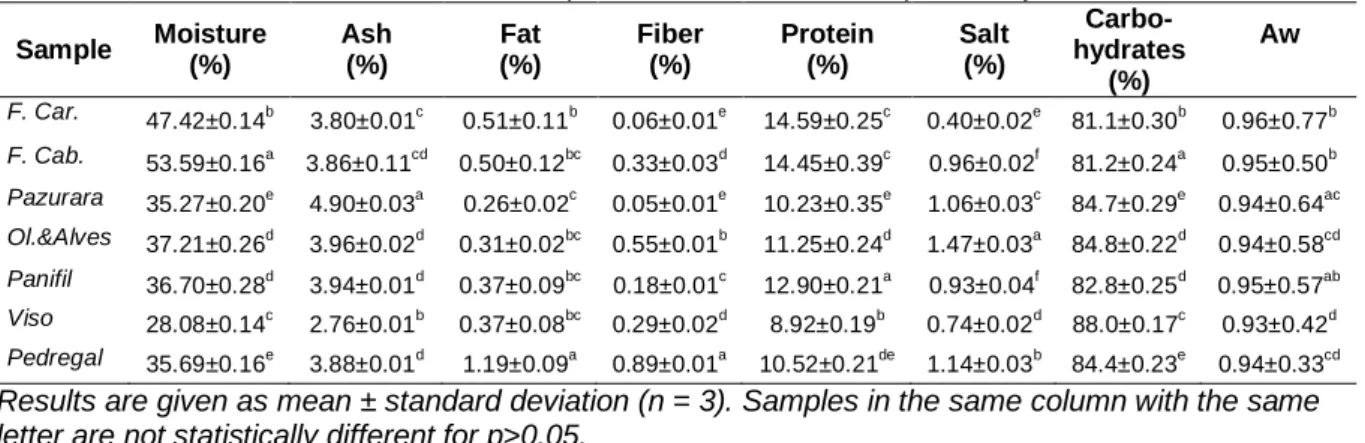
From Table 1. it is visible that the values of moisture are not much different among the samples analysed. The sample from Flor de Cabanas showed the highest value, although this result is not from the formulation itself, but perhaps because this sample has a high fiber content, and the presence of fibres contributes to a greater absorption of water (Cauvain and Young, 2006). On the other hand, the sample from Viso showed the lowest value for moisture percentage. Regarding the water activity of the bread samples, and although the values were not so different from each other, the truth is that statistically there are some differences to be noticed.
In relation to the ash content, the samples from Oliveira & Alves, Panifil, Pedregal and Flor
de Cabanas, showed very similar values (from 3.86 to 3.96), not statistically different as the
analysis of variance confirmed. The sample showing a higher percentage of ashes is the sample from Pazurara, being this value statistically different from all the others, and this could be explained by the fact that this sample has in its constitution flour 130, with high power extraction.
Table 1. Chemical composition of the bread samples analysed.
Sample Moisture (%) Ash (%) Fat (%) Fiber (%) Protein (%) Salt (%)
Carbo-hydrates (%) Aw F. Car. 47.42±0.14b 3.80±0.01c 0.51±0.11b 0.06±0.01e 14.59±0.25c 0.40±0.02e 81.1±0.30b 0.96±0.77b F. Cab. 53.59±0.16a 3.86±0.11cd 0.50±0.12bc 0.33±0.03d 14.45±0.39c 0.96±0.02f 81.2±0.24a 0.95±0.50b Pazurara 35.27±0.20e 4.90±0.03a 0.26±0.02c 0.05±0.01e 10.23±0.35e 1.06±0.03c 84.7±0.29e 0.94±0.64ac Ol.&Alves 37.21±0.26d 3.96±0.02d 0.31±0.02bc 0.55±0.01b 11.25±0.24d 1.47±0.03a 84.8±0.22d 0.94±0.58cd Panifil 36.70±0.28d 3.94±0.01d 0.37±0.09bc 0.18±0.01c 12.90±0.21a 0.93±0.04f 82.8±0.25d 0.95±0.57ab Viso 28.08±0.14c 2.76±0.01b 0.37±0.08bc 0.29±0.02d 8.92±0.19b 0.74±0.02d 88.0±0.17c 0.93±0.42d Pedregal 35.69±0.16e 3.88±0.01d 1.19±0.09a 0.89±0.01a 10.52±0.21de 1.14±0.03b 84.4±0.23e 0.94±0.33cd
Results are given as mean ± standard deviation (n = 3). Samples in the same column with the same letter are not statistically different for p>0.05.
In terms of fat content, the samples from Flor de Cabanas, Oliveira & Alves, Panifil and Viso, showed values statistically similar to each other. On the other hand, the sample from
Pedregal contrasts with the others, showing a much higher value, which might be explained
by the addition of any kind of lipidic ingredient, although this information was not provided by the manufacturer.
highest fibre content is the sample from Pedregal, perhaps because in its constitution has two types of flour with high power extraction, wheat 130 and rye 150, as stated in the ingredients form.
The amounts of protein in the different samples analysed are in general different from each other, except for samples from Flor de Cabanas and Flor de Carregal, which have higher protein contents.
The results in Table. 4 also show that the salt contents in the samples analysed are quite different, with sample from Oliveira & Alves presenting the higher chloride percentage. Considering the information on the identification form for that bread, according to which the salt content should be lower, this fact may be due to the addition of a higher quantity of salt than that established in the formulation.
Regarding the contents of carbohydrates, the results among the samples do not differ significantly. Even though, the sample from Viso stands as the one with the higher value, which can be explained by its lower values in terms of ash and protein contents.
Physical properties
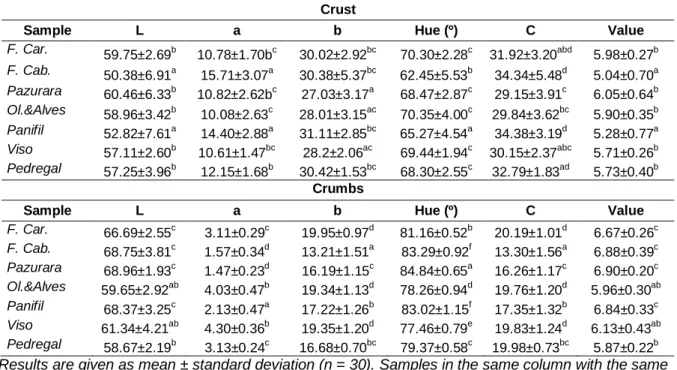
According to the values shown in Table 2. in terms of the colour coordinates for the crust, it was found that the parameters L and Value do not differ significantly. These parameters indicate that the samples were quite dark (with values standing near the middle of the scale). Regarding the parameter a in the samples Flor de Carregal, Pazurara and Viso, the values were similar to each other, as well as in the samples from Flor de Cabanas and Panifil. These values indicate the predominance of the red colour over green. With relation to the parameters b, hue (cylindrical coordinates colour) and c (saturation or chroma), no significant differences were seen between the samples. Furthermore, and since the values of b are highly positive, the colour yellow is dominant over blue, as expected. The results for the crumbs are quite similar, although showing a lighter colour and less intense brown.
Table 2. Colour properties of the bread samples analyzed.
Crust
Sample L a b Hue (º) C Value
F. Car. 59.75±2.69b 10.78±1.70bc 30.02±2.92bc 70.30±2.28c 31.92±3.20abd 5.98±0.27b F. Cab. 50.38±6.91a 15.71±3.07a 30.38±5.37bc 62.45±5.53b 34.34±5.48d 5.04±0.70a Pazurara 60.46±6.33b 10.82±2.62bc 27.03±3.17a 68.47±2.87c 29.15±3.91c 6.05±0.64b Ol.&Alves 58.96±3.42b 10.08±2.63c 28.01±3.15ac 70.35±4.00c 29.84±3.62bc 5.90±0.35b Panifil 52.82±7.61a 14.40±2.88a 31.11±2.85bc 65.27±4.54a 34.38±3.19d 5.28±0.77a Viso 57.11±2.60b 10.61±1.47bc 28.2±2.06ac 69.44±1.94c 30.15±2.37abc 5.71±0.26b Pedregal 57.25±3.96b 12.15±1.68b 30.42±1.53bc 68.30±2.55c 32.79±1.83ad 5.73±0.40b Crumbs
Sample L a b Hue (º) C Value
F. Car. 66.69±2.55c 3.11±0.29c 19.95±0.97d 81.16±0.52b 20.19±1.01d 6.67±0.26c F. Cab. 68.75±3.81c 1.57±0.34d 13.21±1.51a 83.29±0.92f 13.30±1.56a 6.88±0.39c Pazurara 68.96±1.93c 1.47±0.23d 16.19±1.15c 84.84±0.65a 16.26±1.17c 6.90±0.20c Ol.&Alves 59.65±2.92ab 4.03±0.47b 19.34±1.13d 78.26±0.94d 19.76±1.20d 5.96±0.30ab Panifil 68.37±3.25c 2.13±0.47a 17.22±1.26b 83.02±1.15f 17.35±1.32b 6.84±0.33c Viso 61.34±4.21ab 4.30±0.36b 19.35±1.20d 77.46±0.79e 19.83±1.24d 6.13±0.43ab Pedregal 58.67±2.19b 3.13±0.24c 16.68±0.70bc 79.37±0.58c 19.98±0.73bc 5.87±0.22b Results are given as mean ± standard deviation (n = 30). Samples in the same column with the same letter are not statistically different for p>0.05.
The larger sample (Table 3.) was the Panifil, which is distinguishable from the others, perhaps because it has a higher content of salt and proteins, thus inducing a good fermentation. As to the crumbs density, the sample from Flor de Cabanas is highlighted as the denser, while all others are statistically identical. As to the alveolar characterization, the
sample from Viso revealed a greater total area, a higher alveolar percentage as well as a bigger alveolus average size.
Table 3. Physical properties of the bread samples analyzed.
Sample Whole bread volume (cm3) Crumbs density (g/cm3)
Slice alveolar characterization Area
(pixel2) Nº Alveolus % Alveolar
Size (pixel2) F. Car. 697.00±7.28c 0.37±0.06bc 1930258.2±430765.3b 405.4±74.1a 23.8±4.7bc 4764.8±565.7b F. Cab. 565.42±7.37f 0.56±0.06a 1185786.8±769930.5bc 254.6±129.7c 17.4±12.7bc 4684.0±1399.1b Pazurara 737.23±5.76b 0.38±0.05b 721473.8±124114.1c 107.2±15.4b 10.4±1.8b 6839.6±1383.8b Ol.&Alves 474.89±8.99e 0.25±0.03e 1319942.8±412921.5bc 231.8±50.6bc 25.1±8.1c 5660.2±925.0b Panifil 878.16±6.87a 0.31±0.04d 1178604.8±417663.8bc 186.4±63.7bc 14.2±5.1bc 6567.0±1911.5b Viso 632.64±7.73d 0.25±0.02e 3559231.2±525330.7a 229.2±24.8bc 45.3±5.6a 15753.2±3299.5a Pedregal 548.49±8.87f 0.32±0.05cd 1500673.4±4078623.0bc 274.0±48.7ac 24.3±5.5c 5451.2±874.5b Results are given as mean ± standard deviation (n = 3 for volume, n = 15 for density, n = 5 for alveolar characterization). Samples in the same column with the same letter are not statistically different for p>0.05.
By analyzing the results of textural properties in Table 4., it was found that in general the samples are very similar. The parameters chewiness and hardness in the sample from Flor
de Cabanas are higher, which might be explained by the higher density as previously
reported. In terms of cohesiveness and elasticity, it was the sample from Panifil that showed the highest values.
Table 4. Textural properties of the bread samples analyzed.
Sample Hardness (N) Elasticity (%) Cohesiveness (dimensionless) Chewiness (N) F. Car. 5.52±1.53b 88.92±2.72c 0.60±0.05a 2.91±0.67b F. Cab. 9.06±1.94a 91.94±1.36abc 0.72±0.03c 6.02±1.27a Pazurara 4.71±0.90b 90.56±2.80bc 0.75±0.04bc 3.19±0.48b Ol.&Alves 1.94±0.63c 94.15±2.55abd 0.75±0.03bc 1.35±0.39c Panifil 1.59±0.34c 96.25±2.90d 0.79±0.02b 1.21±0.27c Viso 2.05±0.60c 95.31±3.06ad 0.73±0.04bc 1.41±0.32c Pedregal 2.42±0.82c 96.14±1.63d 0.78±0.02bc 1.79±0.50c
Results are given as mean ± standard deviation (n = 7). Samples in the same column with the same letter are not statistically different for p>0.05.
Sensorial properties
According to what is described in Table 5., it was found that the different samples were equally perceived by the tasters in relation to the following attributes: bread aroma, wood aroma and ferment aroma, as well as in terms of density, wood flavour and ferment flavour. Regarding the sensory parameters: crust colour, crumb colour, elasticity and ferment flavour, the perceptions were also very similar. As regards the overall assessment, the samples were also perceived in a similar way, highlighting however the sample from Flor de Cabanas.
Table 5. Results of the sensorial analysis.
Sample Bread aroma Wood aroma Ferment aroma Crust colour Crumbs colour Density
F. Car. 5.00±1.9a 4.05±2.3a 4.63±2.5a 5.31±1.8bc 5.69±1.7ab 5.83±1.8a F. Cab. 5.35±2.2a 3.29±2.2a 4.42±2.4b 4.38±2.4b 3.68±2.4cd 4.57±2.2a Pazurara 5.35±2.2a 3.29±2.2a 4.42±2.4a 4.38±2.4b 3.68±2.4cd 4.57±2.2a Ol.&Alves 5.14±2.0a 4.00±2.6a 3.37±2.4a 6.80±1.8a 3.37±1.8cd 4.52±2.1a Panifil 6.03±1.7a 4.53±2.5a 4.13±2.0a 6.41±2.0a 6.17±1.8b 4.9±2.0a Viso 5.91±1.6a 4.54±2.6a 4.76±2.5a 5.19±2.3bc 4.53±1.9ac 4.55±2.5a Pedregal 5.79±2.0a 3.31±2.3a 3.97±2.6a 5.70±1.6ac 6.80±1.9b 4.69±2.1a
Sample Elasticity Ferment taste Wood taste Bread taste Global appreciation
F. Car. 5.12±2.0abc 4.64±2.4b 3.94±2.5a 5.00±2.4a 5.22±2.1ab F. Cab. 5.99±1.9ab 4.43±2,7b 3.014±2.3a 5.23±2.4a 6.95±2.1a Pazurara 5.99±1.9ab 4.43±2.7b 3.01±2.3a 5.32±2.4a 6.59±2.1a Ol.&Alves 4,33±2.2c 2.75±1.9a 3.92±2.5a 4.88±2.2a 4.79±2.6b Panifil 5.53±2.0abc 4.11±2.1ab 4.12±2.6a 5.52±1.8a 6.02±1.8ab Viso 6.15±2.2a 3.68±2.5ab 4.09±2.7a 5.19±2.4a 5.74±2.1ab Pedregal 4.84±2.3abc 3.42±2.2ab 3.34±2.4a 5.02±2.2a 5.48±2.4ab
CONCLUSIONS
The results from this work showed that the breads were different in shape and size, as well as density or alveolar characterization. Nutritionally this type of bread turned out to be a good food with high percentage of minerals and low values of fat. However, the salt content varied quite a lot among samples. The physical properties were quite different between samples, although some of them were not perceptible by the panel members. This happened, for example with density, whose results varied a lot and the sensorial panel was not able to differentiate the samples. The traditional breads presented a global appreciation between 4.8 and 6.8, related with different colour and elasticity parameters.
АCKNOWLEDGEMENTS
The authors thank the financial support to the research centre CI&DETS (IPV - Viseu).
REFERENCES
1. Vaz, M. A. M. (2004). Aproximação ao Estudo da Tipicidade do Pão Alentejano. Relatório de trabalho de fim de curso de Engenharia Alimentar, ISA, Lisboa.
2. Léon, A. E., Rosell, C.M. (2007). De tales harinas, tales panes, Baéz ediciones, Argentina.
3. Pathlrana, C. M. L., Shahidi F. (2007). Antioxidant and free radical scavenging activities of whole wheat and milling fractions, Food Chemistry, 101, 1151-1157.
4. Nunes, J. C. (2008). Modificações enzimáticas em pães brancos e pães ricos em fibras: impactos na qualidade. Dissertação para obtenção do grau de Mestre em Ciência e Tecnologia de Alimentos,
Universidade do Rio Grande do Sul, Brasil.
5. Almeida, S. A. A., Heitor, A. M., Barata, M. D., Sales, M. G. F., Oliveira, M. B. P. P. (2008). O sal e os cloretos no pão, Segurança e qualidade alimentar, 4, 56-59.