Vol.48, n. 2 : pp. 203-209, March 2005
ISSN 1516-8913 Printed in Brazil
BRAZILIAN ARCHIVES OF
BIOLOGY AND TECHNOLOGY
A N I N T E R N A T I O N A L J O U R N A L
Dietary Models for Inducing Hypercholesterolemia in Rats
Sheyla Leite Matos
1, Heberth de Paula
1, Maria Lúcia Pedrosa
2, Rinaldo Cardoso dos
Santos
1, Eduardo Luiz de Oliveira
2, Deoclécio Alves Chianca Júnior
2and Marcelo
Eustáquio Silva
1*1
Departamento de Alimentos; Escola de Nutrição; Universidade Federal de Ouro Preto; 35400000; Ouro Preto -MG - Brazil. 2Departamento de Ciências Biológicas; Instituto de Ciências Exatas e Biológicas; Universidade Federal de Ouro Preto; 35.400-000; Ouro Preto - MG - Brazil
ABSTRACT
The present work aimed at finding a dietetical model capable of promoting the highest hypercholesterolemia without affecting the development of the rats. Sixty female Fisher rats were divided into five groups. The first one was fed a control diet; the remaining four were fed hypercholesterolemic diets with cholesterol and different contents of soybean oil, starch, casein, micronutrients and fiber and, consequently, different caloric values. After eight weeks animals were evaluated in relation to growth, fecal excretion, liver weight and fat, cholesterol and its fractions, serum biochemical parameters and sistolic pressure and compared with controls. The best result was obtained with the diet containing 25 % soybean oil, 1.0 % cholesterol, 13 % fiber and 4,538.4 Kcal/Kg, since it promoted an increase in LDL-cholesterol, a decrease in the HDL fraction and affected less the hepatic function of the animals.
Key words: Hypercholesterolemia, animal model, caloric value, cholesterol
*
Author for correspondence
INTRODUCTION
Hypercholesterolemia is a problem faced by many societies and is a cause of concern for health professionals, since it constitutes one of the major risk factors for the development of cardiovascular diseases, such as atherosclerosis and its complications, acute infarctation of the myocardium or hypertension (Gerhardt and Gallo 1998; Robbins 1991; Gomes et al. 1998). In addiction, there is a close correlation between these diseases and lipid abnormalities, especially high level of plasma cholesterol, and blood pressure (Mahan and Scott-Stump 1998).
The continuous ingestion of high amounts of fat seems to be directly related to hyperlipidemy in
Commercial rations supplemented with cholesterol have also been used (Beynem et al. 1986; Doucet et al. 1987). In our laboratory we have produced hypercholesterolemic rats by treating them with diets rich in triglycerides and supplemented with cholesterol (Silva et al. 2000a; Silva et al. 2000b; Silva et al. 2000c; Silva et al. 2000d). Nevertheless, the question of the caloric value of the employed diets has not yet been considered properly since their high fat content, which is the strategy used in order to induce hypercholesterolemia, leads to lower ingestion by the animals and induces malnutrition.
In the present work, we aimed at establishing dietetical models that induce hypercholesterolemia in rats, using diets rich in soybean oil and containing cholesterol altering the proportion between this and other nutrients - protein, starch and fiber - in order to define a diet capable of promoting the highest hypercholesterolemia without affecting the development of the animals. The dietetical models proposed were evaluated through parameters related to lipid metabolism, that is, triglycerides, cholesterol and its fractions, and hepatic and abdominal fat. We also verified the effect of the different diets on the nutritional status of the animals, through body and liver weights and biochemical parameters such as transaminases, urea, and glucose, which gave us
information about the hepatic function of the rats and about their general status. Possible alterations in sistolic blood presure, as a consequence of the dietetical models, were also investigated.
MATERIALS AND METHODS
Animals and experimental design
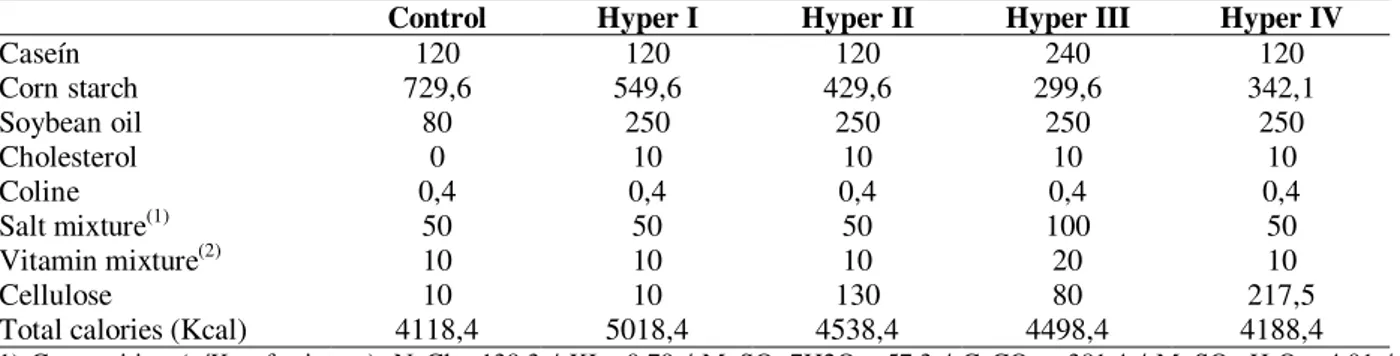
The experiment was conducted on 60 female Fischer rats weighing approximately 150g. The animals were divided into five groups: Control (C) was fed a standard diet; the remaining four received hypercholesterolemic diets (Table 1). The rats were maintained in individual cages, under controlled temperature, humidity and illumination conditions, with water and diet ad libitum for eight weeks. Diet ingestion and body weight were recorded weekly. The main characteristics of the experimental diets can be summarized as follows: Hyper I, a high caloric value due to its high oil content; Hyper II, a lower caloric value due to its fiber content; Hyper III, high contents of protein and micronutrients; Hyper IV, high oil content but caloric value similar to the control, due to its high fiber content.
Table 1 - Composition of the diets (g/1000g of diet)
Control Hyper I Hyper II Hyper III Hyper IV
Caseín 120 120 120 240 120
Corn starch 729,6 549,6 429,6 299,6 342,1
Soybean oil 80 250 250 250 250
Cholesterol 0 10 10 10 10
Coline 0,4 0,4 0,4 0,4 0,4
Salt mixture(1) 50 50 50 100 50
Vitamin mixture(2) 10 10 10 20 10
Cellulose 10 10 130 80 217,5
Total calories (Kcal) 4118,4 5018,4 4538,4 4498,4 4188,4
(1) Composition (g/Kg of mixture): NaCl - 139.3 / KI - 0.79 / MgSO4.7H2O - 57.3 / CaCO3 - 381.4 / MnSO4. H2O - 4.01 / FeSO4.7H2O - 27.0 / ZnSO4.7H2O - 0.548 / CuSO4.5H2O - 0.477 / CoCl2.6H2O - 0.023 / KH2PO4 - 389.0. (2) Composition (g/Kg of mixture): Retinol acetate - 2,000,000IU / Cholecalciferol - 200,000IU / P-aminobenzoic acid - 10.00 / I-Inositol - 10.00 / Niacin - 4.00 / Calcium pantotenate - 4.00 / Riboflavin - 0.80/ Tiamine HCL - 0.50 / Piridoxine HCL - 0.50 / Folic acid- 0.20 / Biotin - 0.04 / Vitamin B12 - 0.003 / Choline - 200.0 / α-Tocopherol - 10,000IU/ Sucrose qsp 1000
Blood collection and fat measurement
At the end of eight weeks, the animals were sacrificed and blood was collected through the brachial plexus and centrifuged. Abdominal fat was determined as follows: after opening the peritonium and removing the viscera, abdominal fat was carefully dissected and weighed.
Biochemical determinations
were calculated from the Friedewald equation: LDL-Cholesterol = Total cholesterol - (HDL-cholesterol + (HDL-cholesterol), and VLDL-cholesterol = Triglycerides/5, according to the manufacturer’s instructions). Urea, transaminases, total protein and plasma albumin were determined spectrophotometrically also using commercial kits. (Labtest, Belo Horizonte, MG, Brazil).
Fecal Lipids
Feces were collected daily during 10 days. After collection, the material was dried and stored for further analysis. Total lipids were determined following the methodology proposed by AOAC (A.O.A.C. 1990). The previously dried and pulverized feces were placed in the filter paper cartridges and the lipid fraction was extracted with petroleum ether for six hours in a Soxhlet apparatus.
Liver lipids
Livers were perfused with 0.9% saline solution, removed from the carcasses and then frozen. Total lipids were analyzed following the methodology proposed by AOAC (A.O.A.C. 1990). About 1g of liver was ground in a porcelain mortar, using 12 g of clean sterilized sand, and then dried. All of the resulting powder was placed in a cellulose cartridge and the lipids were extracted with petroleum ether for six hours in a Soxhlet apparatus.
Determination of systolic pressure
Systolic blood pressure was measured in conscious restrained rats with a photoelectric sensor and a tail-cuff sphygmomanometer, using the Kent RTBP2000 series Rat Tail System (Kent Scientific Corporation 457 Bantam Road. Litchfield, CT) as described by Narce et al. (1997). Thirty minutes before the measurements, the rats were placed into a preheated restrainer, with the tail exposed. The tail cuff was pushed up to the base of the tail and fit closely but freely on the tail and the pulse sensor was placed just behind the tail cuff. The cuff was then inflated and deflated automatically during periods of 90 seconds for 30 minutes. The pressure in the occlusion cuff and the pulse signal were monitored and recorded in a PowerLab/400 (software Chart for Windows®) system. The initiation of the pulse signals, after the inflation peaks, was correlated with the pressures in the occlusion cuff to obtain the mean systolic blood
pressure readings for each animal.
Statistical analysis
Data were expressed as mean ± standard deviation. In order to compare the groups, analysis of variance (ANOVA) was used. P < 0.05 values were considered to be statistically significant
RESULTS
Table 2 - Body weight, food efficiency, abdominal fat, liver and feces weight and fat, of rats fed control and hypercholesterolemic diets for eight weeks(1,2)
Control Hyper I Hyper II Hyper III Hyper IV
Initial weight (g) 158.75 ± 7.92a 143.79 ± 15,91a. 150.31 ± 11.97a 167.62 ± 17.73a 150.45 ± 15.64a Final weight (g) 204.03 ±9.67a 169.26 ± 10.11b 192.83 ± 11.12a 207.53 ± 12.63a 195.42 ± 9.24a Food Intake (g) 182.39 ± 64.13a 258.20±118.24a,c 385.5 ± 13.67b 304.68±48.58b,c 353.22± 88.88b,c Food Efficiency(3) 36.52 ± 7.30a 29.47 ± 1.47a,b 21.54 ± 4.38b,c 20.13 ± 5.02b,c 17.68 ± 8.48c Abdominal fat (g) 744 ± 2.01a 10.35 ± 2.25b 8.40 ± 2.24a,b 8.42 ± 3.87a,b 6.62 ± 1.27a (Fat / body weight) x 100 3.68 ± 0.91a 4.64 ± 1.01a 3.81 ± 0.81a 3.71 ± 1.65a 3.14 ± 0.61a Liver weight (g) 8.47±0.52a 10.35 ± 1.00b 12.28 ± 1.33c,d 13.72 ± 1.39d 11.79 ± 1.68b,c (Liver weight / body
weight) x 100 3.31 ± 0.15
a
5.15 ± 0.47b 5.49 ± 0.28b 6.06 ± 0.72b 5.84 ± 0.47b
Liver fat
(g/ liver) 070 ± 0.18
a
3.22 ± 2.56a,b 6.24 ± 2.62c 5.96 ± 1.28c 4.48 ± 1.07b,c
Liver fat (%) 10.88 ± 3.03a 24.61 ± 19.28a,b 51.98 ± 20.49c 43.83 ± 8.88b,c 36.46 ± 5.32b,c Feces (g in 10 days) 3.50 ± 1.38a 7.29 ± 0.70a 22.59 ± 3.49b 29.91 ± 9.66b,c 32.31 ± 7.70c Fecal fat (%) 7.25 ± 3.00a 11.89 ± 3.22b 5.83 ± 1.02a,c 4.05 ± 0.72c 5.33 ± 1.49a,c Fecal fat in 10 days (g) 0.23 ± 0.08a 0.86 ± 0.22b 1.31 ± 0.23b,c 1.25 ± 0.56b,c 1.75 ± 0.67c
(1) Values are shown as average ± standard deviation (n=12). (2) Different superscript letters in the same line indicate statistically significant difference for P < 0.05 (ANOVA). (3) Food Efficiency = weight gain (g)/food intake(g) x 100
Total cholesterol, HDL-, LDL- and VLDL-c and triglycerides (Table 3)
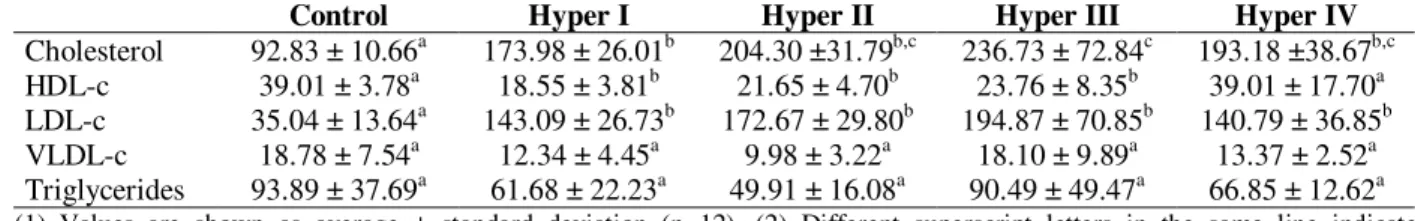
Serum levels of cholesterol increased in all the experimental groups, and Hyper III presented a significant increase in relation to group Hyper I. With the exception of group Hyper IV (high fiber), all hypercholesterolemic groups showed a significant reduction in HDL-cholesterol as
compared to control. Regarding LDL-c plasma levels, higher values were observed for all Hyper groups in relation to the control one, although no difference was found among each other. No difference was also found between all groups when VLDL-c and triglycerides were investigated.
Table 3 -Total Cholesterol, HDL-c, LDL-c and VLDL-c and triglycerides of rats fed control and hypercholesterolemic diets for eight weeks (1,2).
Control Hyper I Hyper II Hyper III Hyper IV
Cholesterol 92.83 ± 10.66a 173.98 ± 26.01b 204.30 ±31.79b,c 236.73 ± 72.84c 193.18 ±38.67b,c HDL-c 39.01 ± 3.78a 18.55 ± 3.81b 21.65 ± 4.70b 23.76 ± 8.35b 39.01 ± 17.70a LDL-c 35.04 ± 13.64a 143.09 ± 26.73b 172.67 ± 29.80b 194.87 ± 70.85b 140.79 ± 36.85b VLDL-c 18.78 ± 7.54a 12.34 ± 4.45a 9.98 ± 3.22a 18.10 ± 9.89a 13.37 ± 2.52a Triglycerides 93.89 ± 37.69a 61.68 ± 22.23a 49.91 ± 16.08a 90.49 ± 49.47a 66.85 ± 12.62a
(1) Values are shown as average ± standard deviation (n=12). (2) Different superscript letters in the same line indicate statistically significant difference for P < 0,05 (ANOVA)
Serum levels of total proteins, albumin, creatinin, glucose, urea and oxalacetic (AST) and piruvic (ALT) transaminases (Table 4)
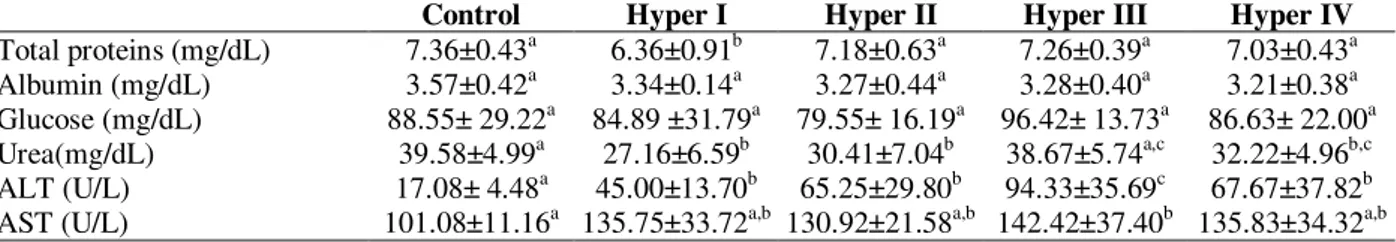
There was no difference among all the groups in relation to serum levels of albumin and glucose while total proteins were significantly (P< 005) lower in group Hyper I. Serum urea presented a significant reduction in groups Hyper I and II in relation to control animals.
When transaminases were investigated, ALT activitiy augmented in all experimental groups; for AST, only group Hyper III had higher values, as
compared to the control.
Sistolic pressure
Table 4 - Total proteins, albumin, glucose, urea, and aspartate (AST) and alanine (ALT) transaminases of rats fed control and hypercholesterolemic diets for eight weeks (1,2)..
Control Hyper I Hyper II Hyper III Hyper IV
Total proteins (mg/dL) 7.36±0.43a 6.36±0.91b 7.18±0.63a 7.26±0.39a 7.03±0.43a Albumin (mg/dL) 3.57±0.42a 3.34±0.14a 3.27±0.44a 3.28±0.40a 3.21±0.38a Glucose (mg/dL) 88.55± 29.22a 84.89 ±31.79a 79.55± 16.19a 96.42± 13.73a 86.63± 22.00a Urea(mg/dL) 39.58±4.99a 27.16±6.59b 30.41±7.04b 38.67±5.74a,c 32.22±4.96b,c ALT (U/L) 17.08± 4.48a 45.00±13.70b 65.25±29.80b 94.33±35.69c 67.67±37.82b AST (U/L) 101.08±11.16a 135.75±33.72a,b 130.92±21.58a,b 142.42±37.40b 135.83±34.32a,b
(1) Values are shown as average ± standard deviation (n=12). (2) Different superscript letters in the same line indicate statistically significant difference for P < 0,05 (ANOVA).
DISCUSSION
Various models are found in the literature for the study of hypercholesterolemia in rats, which vary from commercial rations supplemented with 1% cholesterol to diets with variations in the lipid and carbohydrate portions, such as different fat sources and contents, containing or not cholic acid, and partial substitution of sucrose for starch. Joris et al. (1983) considered the rats as hypo-responsive to dietary cholesterol, sustaining that cholic acid be used in order to induce hyperlipidemia and atherosclerosis in this species. Nevertheless, evidence has recently been presented which do not recommend the utilization of this substance in hypercholesterolemic models in rats (Lichtman et al. 1999). In addition, the question of the caloric value of the diet has not yet been considered properly. We observed that a high caloric value of the diet led to its lower ingestion by the animals; consequently there would be a lower ingestion of other nutrients too and that would induce malnutrition. Scientific evidence indicates that this occurs because the rat, to a certain extent, ingests the diet driven by its caloric content. For instance, when the diet is diluted with fiber, the rat increases its ingestion in order to compensate up to 50% dilution (Menaker and Navia 1973).
Due to the above mentioned, dietetical models of hypercholesterolemy were planned, based on the increase of triglycerides and cholesterol supplementation. The first one (Hyper I) had increased oil content in relation to the control and contained cholesterol, what determined a higher caloric value (5,018 and 4,118 Kcal, respectively). In the second (Hyper II), fat content was equal to the first one, but a partial substitution of fiber for starch made its caloric value drop to 4,358.4 Kcal. The third one (Hyper III) had a caloric value similar to Hyper II, but casein, mineral and vitamin contents were doubled and fiber was
included at 8%. The fourth model (Hyper IV) had as its major characteristic the increase in fiber content (21.75%), in order to obtain a diet with 25% fat and 1% cholesterol, but with a caloric value (4,188.4Kcal) as close as possible to that of the control group (4,118 Kcal). It should be stressed that this model, due to its high fiber content, if used in long term experiments could alter the absorption of some nutrients.
When food intake was measured (Table 2) it was found that groups Hyper II, III and IV showed higher values as compared to the controls, despite food efficiency being lower, what could be explained by their higher fecal excretion. This effect might be attributed to the higher fiber content of these diets, since groups Hyper I and Control had similar food efficiencies, possibly due to their similar cellulose contents (Gregorio et al. 2001). Abdominal fat was augmented in group Hyper I but not in groups Hyper II, III and IV, and this effect could be related to the fact that their food efficiency was similar to that of the control animals.
the increase in fecal fat was more influenced by fat content of the diet than by its fiber (cellulose) content.
Table 3 showed a significant increase in serum cholesterol in hypercholesterolemic groups and a significant reduction of its HDL fraction, what was expected. HDL-cholesterol in group Hyper IV was similar to that of the control group. This occurred due to the fiber content of this experimental diet (21.75%) (Gregorio et al. 2001).
LDL-cholesterol augmented in all Hyper groups but no difference was found in relation to triglycerides and VLDL-cholesterol, as compared to control animals. This apparently unexpected result could be explained by the activity of lipoprotein lipase. Tebib et al (1994) found the activity of this enzime to be augmented in hypercholesterolemic animals. Lipase transforms VLDL in LDL-cholesterol, what would lead to a decrease in the serum concentration of the first. On the other hand the uptake of LDL-cholesterol is dependent on receptors in plasmatic membrane and these are in a reduced number when the cell has enough cholesterol (Berg et al. 2002). This may have happened in hepatic cells of the animal fed cholesterol-supplemented diets, justifying their higher LDL-cholesterol concentration.
Besides those directly linked to lipid metabolism we have also assessed other biochemical parameters, aiming at having a picture of the hepatic function of the animals since the liver is the major responsible for maintenance of homeostasis related to lipid metabolism. Table 4 showed that serum albumin and glucose were similar in control and experimental animals but those of group Hyper I had a significant decrease in total proteins. This finding corroborated that of final body weight, which showed the same profile and indicated that the high caloric value of the diet might have impaired the absorption of protein and other nutrients. This could be also evidenced when serum urea was measused and found lower in group Hyper II as compared to controls. It is well established (Woo and Henry 1996) that a lower ingestion of protein leads to a lower urea production since aminoacids will preferably be utilized for protein synthesis and not degraded. In relation to transaminase activity, we found ALT to be augmented in all the Hyper groups, while AST was higher only in group Hyper III. It was important to note that the increase of ALT in this group was the most marked amongst experimental ones. This effect could be related to nutrient
overcharge, since in this group diet casein, minerals and vitamins contents were doubled. Nevertheless, approximately 80% of AST in hepatocytes appear to be located in mitochondria, whereas ALT is thought to be predominantly nommitochondrial and it has been postulated that in “mild” hepatocelular injury, when the hepatocytes plasmatic but not the mitochondrial membrane is damaged, cytoplasmatic AST and ALT are released into serum with more severe hepatocellular injury, mitochondrial membrane damage may result in the release of mitochondrial AST, elevanting the AST/ALT ratio (Pincus and Schaffner 1996).
In the present work no reduction of sistolic pressure in the animals receiving hypercholesterolemic diets after eight weeks was observed. This indicated that dietetic cholesterol had no influence on blood pressure.
As the increase and reduction of respectively LDL and HDL-cholesterol have been pointed out as risk factors for the development of atherosclerosis and related cardiovascular diseases, the higher the ratio LDL/HDL promoted by a dietetical model, the better it must be considered. Based on this principle, diets Hyper I, II and IIII should be more indicated than diet Hyper IV. Nevertheless, when other parameters were considered, diets Hyper I and III were not be the best options, for different reasons: the first one because it led to malnutrition and the second for having impaired hepatic function, as assessed by transaminases activity. Consequently, it was concluded that the best diet proposed in the present work was Hyper II since it promoted an increase in LDL-cholesterol, a decrease in the HDL fraction and affected less the hepatic function of the animals.
RESUMO
primeiro foi alimentado com uma dieta controle; os quatros restantes receberam dietas hipercolesterolêmicas, com colesterol e diferentes teores de óleo de soja, amido, caseína, micronutrientes e fibra e, conseqüentemente, diferentes valores calóricos. Após oito semanas os animais foram avaliados em relação ao crescimento, excreção fecal, peso e teor de gordura do fígado, colesterol e suas frações, parâmetros bioquímicos séricos e pressão sistólica. Os melhores resultados foram obtidos com a dieta contendo 25% de óleo de soja, 1% de colesterol, 13% de fibra e 4.538,4 Kcal/Kg, uma vez que promoveu aumento no LDL-colesterol, decréscimo no HDL-colesterol e afetou menos a função hepática dos animais.
REFERENCES
A. O. A. C. (1990), Association of Analytical Chemists.
Oficcial Methods of Analysis. Washington, DC. Berg, J. M.; Tymoczko, J. and Stryer, L. (2002),
Biochemistry. 5th ed. New York : Freeman and Company.
Beynem, A. C.; West, C. E.; Zutphen, L. F. M. and Van Katan, M. B. (1986), Relation between the responses of serum cholesterol to dietary cholesterol and to the type of dietary fat in random-bred rabbits. (Nutrition Reports International, 29).
Doucet, C.; Flament, C.; Sautier, C. and Lemonnier, D. (1987), Effect of an hypercholesterolemic diet on the level of several serum lipids and apolipoproteins in nine rat strains. Reprod. Nutr. Dev., 27, 897-906. Gerhardt, A. L. and Gallo, N. B. (1998), Full-fat rice bran
and oat bran similarly reduce hypercholesterolemia in humans. J. Nutr., 128, 865-869.
Gomes, M. R.; Tomaso, H.; Nazarian, G. K.; Bjarnason, H.; Dietz Jr., C. A. and Hunter, D. W. (1998), Upper-extremity deep vein thrombosis and chronic pulmonary embolism resulting in pulmonary artery hypertension.
AJR Am. J. Roentgenol., 170, 1532-1534.
Gregorio, S. R.; Areas, M. A. and Reyes, F. G. R. (2001), Dietary fibers and cardiovascular disease,
22, 109-120.
Joris, I.; Zand, T.; Nunnari, J. J.; Krolikowski, F. J. and Majno, G. (1983), Studies on the pathogenesis of atherosclerosis. I. Adhesion and emigration of mononuclear cells in the aorta of hypercholesterolemic rats. Am. J. Pathol., 113, 341-358.
Lichtman, A. H.; Clinton, S. K.; Iiyama, K.; Connelly, P. W.; Libby, P. and Cybulsky, M. I. (1999), Hyperlipidemia and atherosclerotic lesion development in LDL receptor- deficient mice fed defined semipurified diets with and without cholate. Arterioscler.Thromb.Vasc.Biol., 19, 1938-1944.
Mahan, L. K. and ScottStump (1998), Krause
-Alimentos, Nutrição e Dietoterapia. São Paulo : ROCA. Menaker, L. and Navia, J. M. (1973), Appetite regulation in the rat under various physiological conditions: the role of dietary protein and calories.
J. Nutr., 103, 347-352.
Moghadasian, M. H. (2002), Experimental atherosclerosis: a historical overview. Life Sci., 70, 855-865.
Moghadasian, M. H.; Frohlich, J. J. and McManus, B. M. (2001), Advances in experimental dyslipidemia and atherosclerosis. Lab. Invest., 81, 1173-1183. Narce, M.; Frenoux, J. M.; Dardel, V.; Foucher, C.,
Germain, S.; Delachambre, M. C. and Poisson, J. P. (1997), Fatty acid metabolism, pharmacological nutrients and hypertension. Biochimie, 79, 135-138. Pincus, M. R. and Schaffner, J. R. (1996), Assessment
of liver function in clinical diagnosis and management by laboratory methods. Philadelphia : W. B. Saunders Company.
Robbins, S. L. (1991), Patologia estrutural e funcional. Rio de Janeiro : Guanabara-Koogan.
Silva, M. E.; Paula, H.; Ansaloni, J. A.; Chaves, C. R. C. and Pedrosa, M. L. (2000a), Efeito do Chá de Urucum (Bixa orellana) sobre parâmetros do metabolismo em lipídios em ratos. In: Simpósio Sul-Brasileiro de Alimentação e Nutrição: História, Ciência e Arte. Anais ... pp. 231-235.
Silva, M. E.; Paula, H.; Ansaloni, J. A.; Chaves, C. R. C. and Pedrosa, M. L. (2000b), Será o ácido salicílico o componente do própolis responsávvel pelo seu efeito hipocolesterolêmico? In: Simpósio Sul-Brasileiro de Alimentação e Nutrição: História, Ciência e Arte. Anais ... pp. 219-223.
Silva, M. E.; Paula, H.; Ansaloni, J. A.; Chaves, C. R. C.; Pedrosa, M. L. and Haraguchi, F. K. (2000c), Efeito do Chá de Beringela (Solanum melongena) sobre os parâmetros de lipídios em ratos. In: Simpósio Sul-Brasileiro de Alimentação e Nutrição: História, Ciência e Arte. Anais.
Silva, M. E.; Paula, H.; Ansaloni, J. A.; Chaves, C. R. C.; Pedrosa, M. L. and Haraguchi, F. K. (2000d), Efeito do extrato de própolis sobre parâmetros de lipídios de ratos. In: Simpósio Sul-Brasileiro de Alimentação e Nutrição: História, Ciência e Arte.
Anais ... pp. 283-287.
Tebib, K.; Rouanet, J. M. and Besancon, P. (1994), Effect of grape seed tannins on the activity of some rat intestinal enzyme activities. Enzyme Protein,
48, 51-60.
Woo, J. and Henry, J. B. (1996), Metabolic Intermediates and Inorganic Ions in Clinical Diagnosis and Management by Laboratory Animals. Philadelphia : W. B. Saunders Company. pp. 162-193.