Introduction
The understanding of the bioavailability and the geochem-ical cycling of iron in marine systems (Miller et al. 1995) has been in the focus of environmental research in the last decades. Iron is a vital constituent of plant life, where it is essential for photosynthetic and respiratory electron trans-port, nitrate reduction, chlorophyll synthesis, and detoxifica-tion of reactive oxygen species (Sunda and Huntsman 1995). Being a limiting nutrient for phytoplankton growth has a con-sequent critical role (Coale et al. 1996) on the fixation of car-bon dioxide by photosynthesis and on the CO2 exchange between atmosphere and seawater (Watson et al. 2000). These effects have implications on global carbon, sulfur cycles, and climate change.
Iron(II) is highly soluble in seawater but thermodynami-cally unstable (Achterberg et al. 2001). It is rapidly oxidized to iron(III) in the euphotic zone by hydrogen peroxide, oxygen (Millero and Sotolongo 1989), superoxide (O2–), and hydroxyl
radical (OH) (Millero 1989). Therefore, iron(III) is the domi-nant form of dissolved iron in surface seawater (Millero and Sotolongo 1989; Achterberg et al. 2001); however, only a small fraction of iron(III) occurs in a free hydrated (Fe3+) form. The major fraction (80% to 99%) is strongly complexed by organic ligands (Gledhill and van den Berg 1994), possibly produced by phytoplankton (Rue and Bruland 1997) or bacteria (Granger and Price 1999). The fraction of iron(II) in natural waters can appear as a result of the combination of photore-ductive dissolution of particulate iron(III) (hydr)oxides (Miller et al. 1995) and of inorganic iron(III) complexes (King et al. 1993) with thermal, enzymatic, and microbial cycling path-ways (Croot et al. 2001) as well as through ocean atmospheric deposition (Zhuang et al.1992) and diffusion from reducing sediments (Hong and Kester 1986). The mechanisms linked to the biological uptake of iron remain uncertain (Achterberg et al. 2001), although recent studies have indicated that iron(III) complexed by organic ligands (siderophores and porphyrins) is available for uptake by different types of phytoplankton (Hutchins et al. 1999). With this in mind, and to better under-stand the biogeochemistry of iron in waters, the acquisition of high-quality analytical data are a prerequisite.
The determination of iron in water samples is usually car-ried out for routine quality control, as limits are imposed by legislation on their content (Clesceri et al. 1998). In drinking water, the European Union directive (CEU 1998) sets the limit of 200 µg L–1for iron. Trace element analyses in natural and sea waters are even more demanding because of the different
Sequential injection trace determination of iron in natural
waters using a long-pathlength liquid core waveguide and
different spectrophotometric chemistries
Ricardo N.M.J. Páscoa, Ildikó V. Tóth, and António O.S.S. Rangel*
CBQF/Escola Superior de Biotecnologia, Universidade Católica Portuguesa, Rua Dr. António Bernardino de Almeida, 4200-072 Porto, Portugal
Abstract
We developed a sequential injection analysis (SIA) method for the determination of iron in coastal, ground, and surface fresh waters using two different reagents (ferrozine and 1,10-phenathroline). The methodology uses a double-line SIA system to improve mixing conditions between sample and reagent solutions. A liquid wave-guide capillary cell (LWCC) with 1.0 m pathlength, 550 µm i.d., and 250 µL internal volume was used to enhance the sensitivity of the determination. The detection limits for the ferrozine and 1,10-phenanthroline reagent were 0.15 and 0.35 µg L–1, respectively. The system provides a linear response up to 20 µg L–1and has a high throughput rate (41 h–1), low reagent consumption, and also low effluent production for both reagents. The developed method was applied to natural waters (river, well, ground, potable, and sea waters) and one ref-erence water sample.
*Corresponding author: E-mail: [email protected]
Acknowledgments
The authors thank Fundação para a Ciência e a Tecnologia (FCT) for financial support through Project PTDC/AMB/64441/2006. Ricardo Páscoa and Ildikó Tóth acknowledge financial support from FCT and FSE (III Quadro Comunitário) through the grants SFRH/BD/30621/2006 and SFRH/BPD/5631/2001, respectively.
physical, chemical, and biological processes involved (Hanra-han et al. 2002). In the case of iron analysis in seawaters, matrix effects and low concentration levels are the main diffi-culties. To overcome these difficulties and to increase the sen-sitivity, separation and/or preconcentration of the analyte is often necessary (Lohan et al. 2005) in spectrophotometric methods.
Iron is present in many materials, causing a risk of con-tamination during sampling, filtration, storage, and analysis (Achterberg et al. 2001). Flow analysis techniques with increased accuracy, precision, sample throughput (Morais et al. 2005), reproducible sample injection, controlled dispersion of the sample zone (Segundo and Rangel 2002), low detection limits, low reagent and sample consumption, simplified sam-ple handing, and reduced contamination risks are suitable and attractive tools for both shipboard and in situ determinations (Lunvongsa et al. 2006). Of the flow methods, sequential injection analysis (SIA) uses a simple, reliable, and robust manifold to perform automated wet-chemical analysis, allow-ing further reduced reagent and sample consumption, mini-mized waste production (Segundo and Rangel 2002), and pre-cise automatic control of reaction conditions (Ruzicka and Scampavia 1999). In SIA systems, flow is reversed, and mutual dispersion of the stack of sample and reagent zones occurs, owing to axial and radial diffusion, although only a partial overlap of analyte and reagent zones is achieved (Segundo and Rangel 2002). To overcome this potential difficulty, various modifications in the flow configurations have been intro-duced, one of which is the double-line SIA system (Morais et al. 2005). This strategy makes use of the merging-zones approach, where good overlapping of the reagent and sample zone is achieved.
Various flow-based spectrophotometric methods have been presented for the determination of iron. A comparison of var-ious figures of merit for the different methods can be found in Table 1. The FIA methods with no preconcentration step (Pas-cual-Reguera et al. 1997) present a very high detection limit, whereas other FIA methods with a preconcentration step (Blain and Treguer 1995) present low detection limits but still have some disadvantages such as high reagent consumption and high effluent generation. Other existing flow approaches such as SIA (Morais et al. 2005), multicommutated flow (Feres and Reis 2005), and multisyringe flow injection (Gomes et al. 2005) present lower reagent consumption but still inadequate detection limits for natural water samples.
The objective of this work was to exploit the potential of the liquid waveguide capillary cells in a sequential injection manifold to provide sufficient sensitivity for trace iron deter-mination with no need to introduce off-line or in-line pre-concentration steps. This technology allows increasing of the pathlength in spectrophotometric measurements without light attenuation (Fuwa et al. 1984). In optical fibers, the light undergoes total internal reflection at the walls, and not only the light-conducting path is transparent in the wavelength of
interest, but the core region of the fiber also has a refractive index higher than that of the cladding material; therefore the light is trapped in the optically denser core. Since 1993, the use of Teflon AF-2400 (DuPont 127 Fluroproducts)—a polymer that is largely transparent throughout the UV and visible range, with refractive index (1.29) lower than water (1.33) (Li et al. 2003)—has made it possible to construct totally inter-nally reflecting detection cells that suffer from minimal light loss by scattering in the detection cell equipment with no light dispersion. Teflon is also chemically stable and inert, allowing its universal application. Liquid waveguide capillary cells (LWCCs) are obligatorily coupled with optical fibers for bringing light in and out of the cell (Dasgupta et al. 2003). This detection cell, unlike conventional flow cells, has a low dispersion factor and less schlieren effects derived from the reduced internal volume. This technology was presented by Waterbury et al. (1997), using a continuous flow method with a long (4.5-m) pathlength waveguide capillary cell for the determination of iron with low detection limit, although it had the same disadvantages mentioned for FIA methods. Nowadays, with all the concern and information about envi-ronmental problems, developing analytical methods with low effluent generation for a greener chemistry is crucial.
In this work, we developed a spectrophotometric SIA flow system for the determination of iron in different water matri-ces. For this purpose, two colorimetric reagents were tested (ferrozine and o-phenanthroline) and compared in terms of sensitivity and susceptibility to interferences when a long-pathlength liquid waveguide capillary cell was used as a detec-tion cell.
Materials and procedures
Reagents and solutions—All solutions were prepared with analytical reagent–grade chemicals and deionized water. Iron(III) stock standard solutions (100 mg L–1) were prepared by diluting commercial 1000 mg L–1 iron atomic absorption standards (Spectrosol) in 0.01 mol L–1HCl solution. Working standard solutions between 2 and 20 µg L–1in 0.01 mol L–1HCl were prepared daily from serial dilution of stock solution. For preliminary studies, iron(II) stock standard solution (100 mg L–1) was prepared by dissolving ammonium iron(II) sulfate hexahydrate (Merck) in 0.05 mol L–1HCl solution. River water certified reference material (NRC-SLRS-4) was also analyzed for the evaluation of the accuracy of the developed method as rec-ommended by the National Research Council of Canada.
All solutions used in interference studies (Zn, Cd, Mn, Cu, Al) were prepared by diluting commercial atomic absorption standards (Spectrosol).
A 2% (wt/vol) ascorbic acid solution was prepared daily by dissolution of the solid in a 2 mol L–1acetic acid–ammonium acetate solution, and final pH was adjusted with acetic acid to 4.2. A solution of 0.013 mol L–11,10-phenanthroline was also prepared in 0.05 mol L–1 HCl. Ferrozine stock solution of 0.0025 mol L–1was prepared by dissolving 0.1231 g ferrozine
(C20H14N4O6S2) in 100 mL water. Apparatus—Solutions were pro-pelled through two Gilson Minipuls 3 peristaltic pumps with PVC pumping tubes. Two electri-cally actuated selection valves (Valco VICI C25-3188D, 8-port, and Valco C25-3180D, 10 port) were set up as shown in Fig. 1. The central channels of the valves were connected to the respective peristaltic pumps through the holding coils. All tubes connect-ing the different components of the setup were made of Omnifit PTFE with 0.8 mm i.d.
The absorbance measurements were carried out at the wave-lengths of 512 and 562 nm for the detection of iron-1,10-phenathro-line and iron-ferrozine complex, respectively. The detection system consisted of an Ocean Optics PC2000-ISA spectrophotometer, a pair of 200-µm fiber-optic cables, a DH-2000 deuterium-halogen light source (Top Sensor Systems), and a LWCC (2100; World Preci-sion Instruments) (1.0 m path-length, 250 µL inner volume, 550 µm i.d.).
A 386 personal computer (Sam-sung) equipped with an Advantec PCL818L interface card, running in-house software written in QuickBasic 4.5, controlled the selection valve positions and the peristaltic pump directions and speed. Data acquisition was per-formed by SpectraWin software version 4.2 (Top Sensor Systems) through an external trigger signal made from the Advantec PCL818L interface card.
Procedure—The manifold con-figuration used for the determina-tion of iron is shown in Fig. 1.
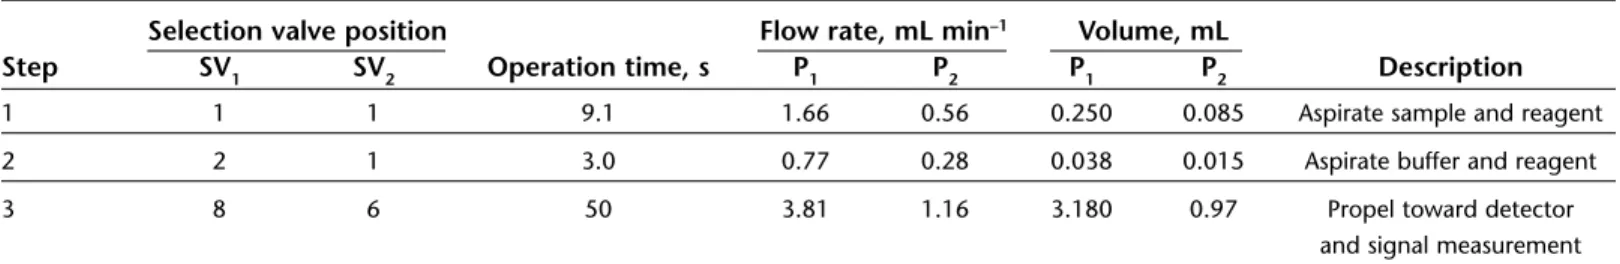
The determination of iron includes three steps and uses a single analytical sequence listed in Table 2. The first step was aspi-ration of the sample or standard to HC1. At the same time, the color reagent was aspirated into
T
a
ble 1.
Comparison of analytical characteristics of flow methods with low detection limits for the determination of iron.
Detection Range, Detection Determination Reagent consumption, System mode µg L –1 limit, µg L –1 rate, h –1 mmol/assay Matrix P reconcentration Reference Continuous flow UV -V is 0.028–0.56 0.011 NG 0.002 FZ
Aqueous (no real
— W aterbur y (L WCC) samples injected) et al.1997 Gas-segmented UV -V is ≤2.8 0 .006 40 0.0015 FZ
Aqueous (no real
— Z hang continuous flow (L WCC) samples injected) et al. 2001 FIA C L ≤2 0 .02 2 0 0 .022 DPD A queous (river — Lunvongsa
and tap water)
et al. 2006 FIA U V -V is. ≤4.2 Fe(II), a 0.006 Fe(II), 1 0 0 .001 FZ Aqueous C18 B lain and ≤0.6 Fe(II), b 0.017 Fe(III) (injection of Tr eguer 1995 ≤11 Fe(III), a certified seawater) ≤0.2 Fe(III) c FIA C L 0 .045–11 0.045 Fe(II), 9 0 .002 BSF , H 2 O2 NG Aqueous (river , rain, Amberlite Hirata 0.020 total Fe
and tap water and
XAD-4 with et al. 1999 coastal seawater) HEED groups Continuous flow CL 0.005–0.1 0 .003 5 0 .003 luminol, Aqueous MAF-8HQ Obata 2.7 H 2 O2 (seawaters (8-quinolinol-e t al. 1993 samples immobilized fluoride and certified containing metal seawaters samples) a lkoxide glass) FIA C L ≤0.5 0 .001 ~12 ~0.001 DPD A queous V inyl Measures and (seawater) polymer-8HQ Y u an 1995 SIA U V -V is 0.15–20 FZ, 0.15 FZ, 41 for 0.0013 FZ,
Aqueous (well, river
, — T his article (L WCC) 0.35–20 PHE 0.35 PHE both reagents 0.00025 PHE
ground, potable, and seawaters and certified river water sample)
UV
-V
is, spectrophotometric; NG, not given; FZ, ferrozine; CL, chemiluminometric; DPD,
N
,N
-dimethyl-p
-phenylenediamine; FL, fluorimetric; BSF
, Brilliant sulfoflavine; Amberlite XAD-4,
polystyrene-divinylbenzene macroporous resin; HEED, N-hydroxyethylethylenediamine; PHE, 1,10-phenanthroline. Loading time:
a2 min, b6 min, c10 min.
HC2. In the second step, the buffer solution was drawn up to HC1, and at the same time, the color reagent was aspirated into HC2. Finally, the flow was reversed, and the HC1and HC2 contents were mixed in a confluence (a, Fig. 1), and propelled through reaction coil (RC, Fig. 1) to the detector, where the change in absorbance was measured.
We compared SIA results with those provided by atomic absorption spectrometry (AAS) (Perkin Elmer) with graphite fur-nace atomization (Clesceri et al. 1998) and Zeeman longitudi-nal background correction. We used 20 µL sample and 5 µL magnesium nitrate 3 g L–1as matrix modifier per assay.
Assessment
System configuration—The primary objective of this work was the development of a sequential injection system for iron determination in waters using a liquid waveguide capillary cell, to achieve low detection/quantification levels.
To promote better mixing inside the SIA manifold between sample/standard and color reagent, the merging-zones tech-nique was adopted (Morais et al. 2005). In the proposed man-ifold, two selection valves were used, and they were connected by a confluence placed before the reaction coil. In one side, standard/sample and buffer were drawn up, and in the other side, the color reagent was aspirated. Then they were mixed in the confluence point (a), and the reaction product was pro-pelled to the detector. This manifold configuration is based on a published work (Morais et al. 2005).
The optimization studies included not only physical parameters such as flow rates, tube lengths, plug sizes, and sample and reagent volumes, but also chemical parameters such as reagent concentrations. The values used are
summa-rized in Fig. 1 and Tables 2 and 5. The univariate method was used, where only one parameter was changed while others were kept constant.
Study of physical and chemical parameters—Initial studies for setting up the physical parameters of the system were carried out using the ferrozine reagent. Initially, total plug size was studied in the range 150–400 µL, but the proportion between sample/standard and color reagent was maintained (2.5:1). The best sensitivity was obtained for 350 µL total plug volume, with the volume of sample and reagent of 250 and 100 µL, respec-tively. The length of the reaction coil was studied in the range of 60–160 cm; 85 cm allowed higher sensitivity and therefore was adopted for further studies. Propelling flow rate was also studied in the range of 1.66–3.81 mL min–1for pump 1 (Fig. 1) and in the range of 0.56–1.16 mL min–1for pump 2 (Fig. 1). Flow rates of 3.81 and 1.16 mL min–1for pumps 1 and 2, respec-tively, were used. Although sensitivity was similar in all cases, the flow rates chosen contributed to a shorter cycle time.
We also studied the influence of some chemical variables in the performance of the system.
In the case of pH, a good compromise between total reduc-tion of iron(III) to iron(II) and complex formareduc-tion between iron(II) and color reagent must be achieved. For the complex formation with iron(II), the best sensitivity was obtained at pH 5.1 for the acetate buffer. The range studied was between 4 and 6 pH units, and for complete reduction of iron(III) to iron(II) the pH of the acetate buffer must be below 4.2 (Fer-nandes et al. 1995). To achieve these conditions, a preliminary study was carried out off-line by mixing equivalent propor-tions of the sample and buffer solution in a beaker. The pH of the acetate buffer was set to 4.2 to maintain the pH at around 4.0 during the reduction process (sample/standards were adjusted to pH 2.0 before analysis). After the study of pH buffer, the concentration of the acetate buffer was also studied over the range of 0.01–2.5 mol L–1. Only at the concentration of 2.0 mol L–1was it possible to maintain pH 4.0 at the reduc-tion process.
The ascorbic acid concentration was studied to ensure the complete reduction of iron(III) to iron(II) in the range 1.0%–4.0% (wt/vol). The minimum concentration of ascorbic acid that ensured the complete reduction of iron was 2% (wt/vol). This was proved by the similarity between the cali-bration curves of iron(III) and iron(II) standard solutions.
Finally, the concentrations of both color reagents were studied. In the case of 1,10-phenanthroline, concentration values between 0.013 and 0.10 mol L–1were tested, and the sensitivity was similar in all cases. The concentration used was 0.013 mol L–1 with the aim of reducing reagent con-sumption. The [1,10-phenanthroline-iron] complex forms almost instantly with maximum absorption at 512 nm and produces an orange-red color. The concentration of ferrozine was studied in the range of 0.25–5 mmol L–1. The sensitivity increased up to 2.5 mmol L–1. For higher levels of ferrozine concentration, the sensitivity remained constant, so the
con-Fig. 1.Sequential injection manifold for the determination of iron in
nat-ural waters. SV1, SV2, selection valves; P1, P2, peristaltic pumps; HC1, HC2, holding coils (2 m); RC, reaction coil (85 cm); L1, L2, reactors (25, 14 cm); a, confluence; LWCC, liquid waveguide capillary cell (1.0 m of path-length) and CCD array spectrophotometer; W, waste; S, sample or stan-dard; BFe, acetate buffer solution; RFe, color reagent (ferrozine or 1,10-phenanthroline).
centration selected was 2.5 mmol L–1. The [ferrozine-iron] complex also forms instantly with maximum absorption at 562 nm and produces magenta color.
The initial practical difficulties of bubble formation were overcome by filling the unused ports of the selection valve with the water carrier. Schlieren effects were observed in the signals obtained for the standard solution of 2 µg L–1 iron; however, they did not influence the peak height reading and can be minimized by using a reference wavelength for moni-toring the refractive index changes during measurement. Best day-to-day performance of the LWCC was found when the flow cell was washed daily in counter current with a diluted HCl (0.05 M) solution.
Interference studies for both reagents—The interference of sev-eral ions on the determination of total Fe was tested. The tol-erance level of error accepted was ±5% of the absorbance value of the standard (5.0 µg L–1) used in the study. The ions tested were Cd, Cu, Mn, Zn, and Al at levels of 5, 10, 20, 50, 500, and 1000 µg L–1 (Table 3). For ferrozine reagent, the only major interference was from copper(II) at a level two times higher than iron. The copper(II) level in seawater is lower than Fe lev-els (Lide 1993–1994), so it is unlikely to interfere in the analy-sis of real samples. In the case of higher Cu levels, the addition of semicarbazide to the samples can remove this interference (Pascual-Reguera et al. 1997). For 1,10-phenanthroline reagent, the major interferences found were from Mn, Cu, and Cd ions at levels 10 (manganese) and 100 (copper and cad-mium) times higher than iron. Both Mn and Cd levels in sea-water are lower than Fe levels (Lide 1993–1994).
The interference of NaCl in the determination of iron was also studied in the range of 0–35 g L–1for both reagents. The deviations obtained for all concentrations studied and for both reagents were less than 5%, indicating that the salt pres-ent in seawater does not interfere with the determination and that the method is applicable to estuarine samples with vari-able salt concentrations.
Oxalate, cyanide, and nitrite also cause interference at high concentrations (Stookey 1970). However, these ions are usu-ally present in natural waters at trace levels and therefore their interferences are negligible (Zhang et al. 2001).
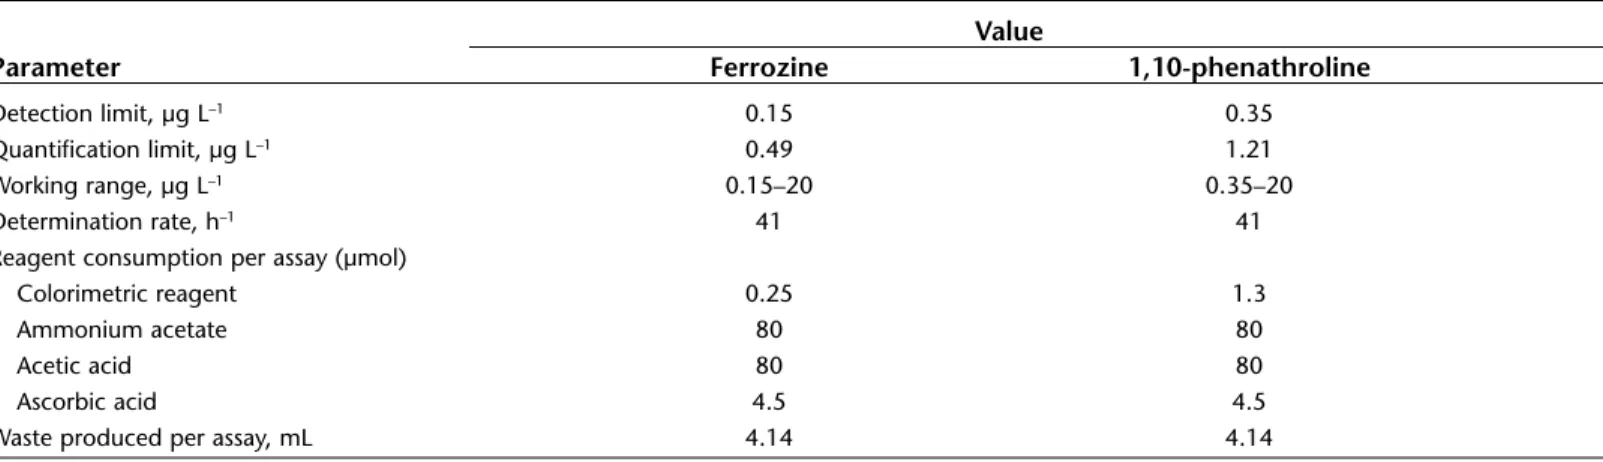
Analytical figures of merit—The overall features obtained for both color reagents are summarized in Table 4. The limit of detection (LOD) and limit of quantification (LOQ) were calculated as the concentration corresponding to three and 10
times the standard deviation of the blank, respectively, of 10 consecutive blank injections (IUPAC 1976).
The linear ranges obtained for ferrozine and for 1,10-phenanthroline reagents were 0.15–20 and 0.35–20 µg L–1, respectively. The LOD and LOQ were lower for ferrozine reagent than for 1,10-phenanthroline reagent. This was expected because of the higher sensitivity of ferrozine reagent for iron determination.
Application to water samples—The proposed method was applied to different types of water samples: seawater, well water, groundwater, and river water.
Table 5 summarizes the results obtained in iron recovery tests with both reagents in groundwater, seawater, and well water. Additions of 2, 4, 10, and 20 µg L–1Fe(III) were made. The recovery test results are good except those obtained for the addition of 2 µg L–1iron, where the standard deviations are high. In the recovery tests of seawater samples, the results obtained show that seawater matrix does not seem to interfere with the determination of iron for either of the reagents.
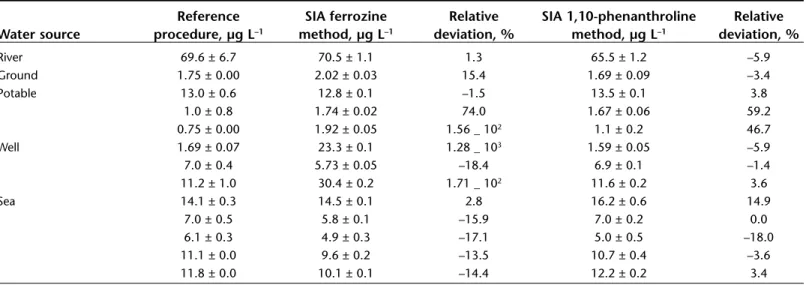
The proposed SIA method with both color reagents was applied to several water samples. To assess the quality of the results, they were compared with the reference method (AAS). Table 6 summarizes the results. At low levels of iron, small absolute differences resulted in large relative errors between methods. The SIA ferrozine method is more sensitive and pre-sented a lower standard deviation but also a lower tolerance to interference, as can also be verified in Table 3. The results obtained by the SIA 1,10-phenanthroline method were very similar to the results obtained by reference methods.
For comparison purposes, a linear relationship (CSIA = C0+ SCRF) was established for both color reagents. The regression equation found for the determination of iron by ferrozine was
CSIAferrozine = 1.01 (± 0.04) ⋅ CRF – 0.511 (± 0.910) (n = 11,
excluding the two well water samples with higher relative devi-ation). For the determination of iron by 1,10-phenanthroline the equation can be written as CSIA1,10-phenanthroline= 0.95 (± 0.03) ⋅ CRF+ 0.615 (± 0.689) (n = 13). For both equations, the val-ues in parenthesis are the limits of the 95% confidence inter-vals and R2= 0.997. From these values, it is clear that the cal-culated slope and intercept lie close to the values of 1 and 0, respectively. Therefore, it can be concluded that the two sets of results (Miller and Miller 1993) obtained by the proposed methodologies and reference procedure are in good agreement. The proposed SIA method with both color reagents was also
Table 2.
Sequential injection protocol sequence for the determination of iron in waters.Selection valve position Flow rate, mL min–1 Volume, mL
Step SV1 SV2 Operation time, s P1 P2 P1 P2 Description
1 1 1 9.1 1.66 0.56 0.250 0.085 Aspirate sample and reagent 2 2 1 3.0 0.77 0.28 0.038 0.015 Aspirate buffer and reagent 3 8 6 50 3.81 1.16 3.180 0.97 Propel toward detector
and signal measurement
Q10
applied to certified reference standard SLRS-4 with certified value of 103 ± 5 µg L–1; the results obtained were 98.9 ± 0.7 µg L–1and 104.7 ± 0.7 µg L–1for the ferrozine and 1,10-phenan-throline methods, respectively. The results correspond to the average (n = 10) and the half width of the 95% confidence interval. The certified sample was diluted 10 times to fit in the linear range of both methods. The results obtained showed a good accuracy for both reagents.
Discussion
A comparison of figures of merit with different methods for the determination of iron is shown in Table 1. The developed work offers some improvements such as low detection limits without any preconcentration step, thus providing high deter-mination throughputs, low reagent consumption, and low efflu-ent production. The LWCC flow cells presefflu-ent a reliable alterna-tive for increasing the sensitivity of the spectrophotometric
Table 3.
Study of interfering species expressed as relative deviation from the absorbance value obtained for the standard solution of5 µg L–1iron for ferrozine reagent and 1,10-phenanthroline reagent.
Ferrozine reagent 1,10-phenanthroline reagent
Species tested Concentration, µg L–1 Relative deviation, % Concentration, µg L–1 Relative deviation, %
Zinc 1000 +5.0 1000 +3.4
Aluminum 1000 +3.7 1000 +12.5
Cadmium 50 +1.8 500 +10.6
Manganese 1000 +11.7 50 +14.8
Copper 10 +7.6 500 +14.2
Table 4.
Figures of merit for the developed method.Value
Parameter Ferrozine 1,10-phenathroline
Detection limit, µg L–1 0.15 0.35
Quantification limit, µg L–1 0.49 1.21
Working range, µg L–1 0.15–20 0.35–20
Determination rate, h–1 41 41
Reagent consumption per assay (µmol)
Colorimetric reagent 0.25 1.3
Ammonium acetate 80 80
Acetic acid 80 80
Ascorbic acid 4.5 4.5
Waste produced per assay, mL 4.14 4.14
Table 5.
Results obtained for recovery tests with both color reagents in different types of water.Recovery, %a
Concentration added, µg L–1
Color reagent Sample number 2 4 10 20
Ferrozine 1 99 ± 9 99 ± 5 105 ± 2 104 ± 5 2 93 ± 2 92 ± 5 95 ± 1 93 ± 1 3 106 ± 30 79 ± 7 84 ± 1 83 ± 1 4 106 ± 14 95 ± 3 99 ± 1 99 ± 1 1,10-phenanthroline 5 92 ± 9 89 ± 3 95 ± 1 91 ± 2 2 105 ± 2 104 ± 1 103 ± 2 100 ± 1 3 94 ± 6 95 ± 2 100 ± 2 98 ± 1 4 96 ± 23 97 ± 4 97 ± 2 98 ± 1
analytical procedures. Although the achieved detection limits are higher than those required for open-ocean iron monitoring, the scope of this work was on estuarine water monitoring, where the expected iron levels are higher.
Another objective of the work was to compare 1,10-phenan-throline and ferrozine reagents in the determination of iron in different sources of water, using this automatic system. It should be emphasized that the sensitivity and extent of interferences depend on the flow systems, as it is in fact a kinetic determina-tion. In these conditions, ferrozine reagent presents a higher sensitivity for iron as well as for copper as an interferent. The consumption per assay of ferrozine reagent is less than 1,10-phenanthroline reagent, although it is significantly more expensive. The two reagents are in the same safety class (WGK 3) in the material safety data sheet. The existing alternative spectrophotometric batch method for iron (Clesceri et al. 1998) is based on the 1,10-phenanthroline reagent; this method is not directly comparable to our method, as it is applicable only to samples with at least 10 µg/L iron, where the reagent consump-tion is typically 1000 times higher than that of our method.
References
Achterberg, E. P., T. W. Holland, A. R. Bowie, R. F. C. Mantoura, and P. J. Worsfold. 2001. Review: Determination of iron in seawater. Anal. Chim. Acta 442:1-14.
Blain, S., and P. Treguer. 1995. Iron(II) and iron(III) determi-nation in seawater at the nanomolar level with selective online preconcentration and spectrophotometric determi-nation Anal. Chim. Acta 308:425-432.
Clesceri, L. S., A. E. Greenberg, and A. A. Eaton. 1998. Stan-dard methods for the examination of water and wastewater, 20th ed. American Public Health Association, American Water Works Association, and Water Environment Federa-tion. 3500 Fe Iron; p. 3-76.
Coale, K. H., and others. 1996. A massive phytoplankton bloom induced by an ecosystemscale iron fertilization experi ments in the equatorial Pacific Ocean. Nature 383:495-501. Croot, P. L., and others. 2001. Retention of dissolved iron and
FeII in an iron induced Southern Ocean phytoplankton bloom. Geophys. Res. Lett. 28:3425-3428.
Dasgupta, P. K., I. Y. Eom, K. J. Morris, and J. Li, 2003. Light emitting diode-based detectors: Absorbance, fluorescence and spectroelectrochemical measurements in a planar flow-thorough cell. Anal. Chim. Acta 500:337-364.
[CEU] Council of the European Union. 1998 Dec 12. Council Directive 98/83/EC of 3 November 1998 on the quality of water intended for human consumption. Official Journal of the European Communities L 330/30–L 330/52. <http://eur-lex.europa.eu/LexUriServ/LexUriServ.do?uri=OJ:L:1998: 330:0032:0054:EN:PDF>. Accessed November 3, 2009. Feres, M. A., and B. F. Reis. 2005. A downsized flow set up
based on multicommutation for the sequential photomet-ric determination of iron(II)/iron(III) and nitrite/nitrate in surface water. Talanta 68:422-428.
Fernandes, S. M. V., A. O. S. S. Rangel, and J. L. F. C. Lima. 1995. Colorimetric determination of iron in beer by flow injection analysis using the merging zones technique. J. Ints. Brew. 101:281-284.
Fuwa, K., W. Lei, and K. Fujiwara. 1984. Colorimetry with a total reflection long capillary cell. Anal. Chem. 56:1640-1644. Gledhill, M., and C. M. G. van den Berg. 1994. Determination of complexation of iron(III) with natural organic complex-ing ligands in seawater uscomplex-ing cathodic strippcomplex-ing voltamme-try. Mar. Chem. 47:41-54.
Gomes, D. M. C., M. A. Segundo, J. L. F. C. Lima, and A. O. S. S. Rangel. 2005. Spectrophotometric determination of iron and boron in soil extracts using a multi-syringe flow injec-tion system. Talanta 66:703-711.
Table 6.
Comparison of the result obtained in the determination of iron in several samples of water using both SIA methods and thereference procedure.
Reference SIA ferrozine Relative SIA 1,10-phenanthroline Relative
Water source procedure, µg L–1 method, µg L–1 deviation, % method, µg L–1 deviation, %
River 69.6 ± 6.7 70.5 ± 1.1 1.3 65.5 ± 1.2 –5.9 Ground 1.75 ± 0.00 2.02 ± 0.03 15.4 1.69 ± 0.09 –3.4 Potable 13.0 ± 0.6 12.8 ± 0.1 –1.5 13.5 ± 0.1 3.8 1.0 ± 0.8 1.74 ± 0.02 74.0 1.67 ± 0.06 59.2 0.75 ± 0.00 1.92 ± 0.05 1.56 _ 102 1.1 ± 0.2 46.7 Well 1.69 ± 0.07 23.3 ± 0.1 1.28 _ 103 1.59 ± 0.05 –5.9 7.0 ± 0.4 5.73 ± 0.05 –18.4 6.9 ± 0.1 –1.4 11.2 ± 1.0 30.4 ± 0.2 1.71 _ 102 11.6 ± 0.2 3.6 Sea 14.1 ± 0.3 14.5 ± 0.1 2.8 16.2 ± 0.6 14.9 7.0 ± 0.5 5.8 ± 0.1 –15.9 7.0 ± 0.2 0.0 6.1 ± 0.3 4.9 ± 0.3 –17.1 5.0 ± 0.5 –18.0 11.1 ± 0.0 9.6 ± 0.2 –13.5 10.7 ± 0.4 –3.6 11.8 ± 0.0 10.1 ± 0.1 –14.4 12.2 ± 0.2 3.4
Granger, J., and N. M. Price. 1999. The importance of sidero -phores in iron nutrition of heterotrophic marine bacteria. Limnol. Oceanogr. 44:541-555.
Hanrahan, G., S. Ussher, M. Gledhill, E. P. Achterberg, and P. J. Worsfold. 2002. High temporal and spatial resolution environmental monitoring using flow injection with spec-troscopic detection. Trends Anal. Chem. 21:233-239. Hirata, S., H. Yoshihara, and M. Aihara. 1999. Determination
of iron(II) and total iron in environmental water samples by flow injection analysis with column preconcentration of chelating resin functionalized with N-hydroxyethylethyl-enediamine ligands and chemiluminescence detection. Talanta 49:1059-1067.
Hong, H., and D. R. Kester. 1986. Redox state of iron in the off-shore waters of Peru. Limnol. Oceanogr. 31:512-524. Hutchins, D. A., A. E. Witter, A. Butler, and G. W. Luther III.
1999. Competition among marine phytoplankton for dif-ferent chelated iron species. Nature 400:858-861.
[IUPAC] International Union of Pure and Applied Chemistry, Analytical Cemistry Division, Commission on Spectro-chemical and Other Optical Procedures for Analysis. 1976. Nomenclature, symbols, units, and their usage in spectro-chemical analysis—II. data interpretation: (Rules approved 1975). Pure Appl. Chem. 45:99-103.
King, D. W., R. A. Aldrich, and S. E. Charnecki. 1993. Photo-chemical redox cycling of iron in NaCl solutions. Mar. Chem. 44:105-120.
Li, Q., K. J. Morris, P. K. Dasgupta, I. M. Raimundo, and H. Temkin. 2003. Portable flow injection analyzer with liquid-core waveguide based fluorescence, luminescence, and long path length absorbance detector. Anal. Chim. Acta 479:151-165.
Lide, D. R. [ed.]. 1993–1994. Handbook of chemistry and physics, 74th ed. CRC Press. Section 14: Geophysics, astron-omy, and acoustics, p. 14-19.
Lohan, M. C., A. M. Aguilar-Islas, and R. P. Franks. 2005. Deter-mination of iron and copper in seawater at pH 1.7 with a new commercially available chelating resin, NTA Super-flow. Anal. Chim. Acta 530:121-129.
Lunvongsa, S., M. Oshima, and S. Motomizu. 2006. Determi-nation of total dissolved amount of iron in water samples using catalytic spectrophotometric flow injection analysis. Talanta 68:969-973.
Measures, C. I., J. Yuan, and J. A. Resing. 1995. Determination of iron in seawater by flow injection analysis using in-line preconcentration and spectrophotometric detection. Mar. Chem. 50:3-12.
Miller, J. C., and J. N. Miller. 1993. Statistics for analytical chemistry, 3rd ed. Ellis Horwood. Errors in instrumental analysis, p. 120-124.
Miller, W. L., D. W. King, J. Lin, and D. R. Kester. 1995. Pho-tochemical redox cycling of iron in coastal seawater. Mar. Chem. 50:63-77.
Millero, F. J. 1989. Effect of ionic interactions on the oxidation Fe(II)) and Cu(I) in natural waters. Mar. Chem. 28:1-18. Millero, F. J., and S. Sotolongo. 1989. The oxidation of Fe(II)
with H2O2 in seawater. Geochim. Cosmochim. Acta 53:1867-1873.
Morais, I. P. A., M. R. S. Souto, and A. O. S. S. Rangel. 2005. A double-line sequential injection system for the spectropho-tometric determination of copper, iron, manganese and zinc in waters. J. AOAC Int. 88:639-644.
Obata, H., H. Karatani, and E. Nakayama. 1993. Automated determination of iron in seawater by chelating resin con-centration and chemiluminescence detection. Anal. Chem. 65:1524-1528.
Pascual-Reguera, M. I., I. Ortega-Carmona, and A. Molina-Díaz. 1997. Spectrophotometric determination of iron with ferrozine by flow-injection analysis. Talanta 44:1793-1801. Rue, E. L., and K. W. Bruland. 1997. The role of organic com-plexation on ambient iron chemistry in the equatorial Pacific Ocean and the response of a mesoscale iron addition experiment. Limnol. Oceanogr. 42:901-910.
Ruzicka, J., and L. Scampavia. 1999. From flow injection to bead injection. Anal. Chem. 4:257A-263A.
Segundo, M. A., and A. O. S. S. Rangel. 2002. Flow analysis: A critical view of its evolution and perspectives. J. Flow Inject. Anal. 19:3-8.
Stookey, L.C. 1970. Ferrozine: A new spectrophotometric reagent for iron. Anal. Chem. 42:779-781.
Sunda, W. G., and S. A. Huntsman. 1995. Iron uptake and growth limitation in oceanic and coastal phytoplankton. Mar. Chem. 50:189-206.
Waterbury, R. D., W. Yao, and R. H. Byrne. 1997. Long path-length absorbance spectroscopy: Trace analysis of Fe(II) using 4.5 m liquid core waveguide. Anal. Chim. Acta 357:99-102.
Watson, A. J., D. C. E. Bakker, A. J. Ridgwell, P. W. Boyd, and C. S. Law. 2000. Effect of iron supply on Southern Ocean CO2uptake and implications for glacial atmospheric CO2. Nature 407:730-733.
Zhang, J. Z., C. Kelbe, and F. J. Millero. 2001. Gas-segmented continuous flow analysis of iron in water with a long liquid waveguide capillary flow cell. Anal. Chim. Acta 438:49-57. Zhuang, G. S., Z. Yi, R. A. Duce, and P. R. Brown. 1992. Link
between iron and sulphur cycles suggested by detection of Fe(II) in remote marine aerosols. Nature 355:537-539.