Article
J. Braz. Chem. Soc., Vol. 22, No. 10, 1888-1893, 2011. Printed in Brazil - ©2011 Sociedade Brasileira de Química 0103 - 5053 $6.00+0.00
A
*e-mail: [email protected]
Development of a Fluorimetric Sequential Injection Analysis (SIA) Methodology for
Determination of Quinine
Carlos M. C. Infante and Jorge C. Masini*
Instituto de Química, Universidade de São Paulo, Av. Prof. Lineu Prestes 748, 05508-000 São Paulo-SP, Brazil
Desenvolveu-se uma metodologia de análise por injeção sequencial (SIA) para a determinação luorimétrica de quinino em refrigerantes. Dispersão mínima e mistura eiciente foram obtidas aspirando-se 200 µL de amostra entre duas zonas de 100 µL de reagente (0,10 mol L-1 H2SO4) a
uma vazão de 250 µL s-1, usando uma bobina de reação de 50 cm de comprimento (0,8 mm de
diâmetro interno). Resposta linear para concentrações (C) entre 0,050 e 100,0 mg L-1 foi descrita
por: I = (532 ± 40) + (2,36 ± 0,04) C, com r = 0.999, onde I é intensidade relativa de luorescência. Coeiciente de variação e limites de detecção e quantiicação foram 1,9% (0,50 mg L-1, n = 10), 2,3
e 4,5 µg L-1, respectivamente. A frequência de amostragem foi 60 amostras por hora, consumindo
2,2 µL de H2SO4 concentrado e produzindo 4 mL de resíduos por análise. Não foram observadas
diferenças signiicativas entre os resultados obtidos pela metodologia SIA proposta e aqueles obtidos pelo procedimento em batelada.
A sequential injection analysis (SIA) methodology was developed for fluorimetric determination of quinine in soft drinks. Minimum dispersion and eficient mixing were achieved by aspirating 200 µL of sample between two 100 µL reagent zones (0.10 mol L-1 H2SO4) at low
rate of 250 µL s-1 and using a reaction coil length of 50 cm (0.8 mm internal diameter). Linear
response for quinine concentrations (C) between 0.050 and 100.0 mg L-1 was described by:
I = (532 ± 40) + (2.36 ± 0.04) C, with r = 0.999, where I is the relative luorescence intensity. The coeficient of variation and limits of detection and quantiication were 1.9% (0.50 mg L-1 n = 10),
2.3 and 4.5 µg L-1, respectively. The sampling throughput was 60 analyses per hour, consuming 2.2 µL of concentrated H2SO4 and producing 4 mL of wastes per analysis. No statistically signiicant
differences were observed between the results obtained by the proposed SIA methodology and the ones obtained by the batch procedure.
Keywords: sequential injection analysis, quinine, luorimetry, dispersion, optimization
Introduction
Sequential injection analysis (SIA) is a robust single channel low technique widely used to automate analytical determinations and process control. It is based on the measurement of a transient signal resulting from sequential injection of deined sample and reagent volumes in a
carrier solution under controlled dispersion.1 The sample
processing conditions can be changed by software control as required by the analytical procedure. The possibility of exploiting feedback mechanisms to change sample processing conditions using a unique physical coniguration make these approaches attractive to design low procedures
for process monitoring.2,3 The characteristics of SIA
enable automation of diverse operations such as sampling, chemical derivatization, dilution, standard addition and others, improving the reproducibility. Low sample and
reagent consumption and small waste generation4,5 are
remarkable features of this technique, following the
principles of green chemistry6 applied to development of
clean analytical methods. A typical system is conigured in single line by a syringe pump, coupled to a two-way valve that can communicate with the carrier or with a multiport valve through a holding coil where the reaction zone is formed prior to injection toward the detector, placed in another port of the multiport valve, immediately after the
reaction coil.7 The optimization process can be laborious
and mixing eficiency using a dye solution in place of either
sample or reagent.7,8 In SIA systems this approach is useful
because the physical coniguration does not change, and all the parameters can be used for development of other methods if the tubing dimensions are not altered. As a second step the chemical parameters are optimized for the speciic determination, usually considering: concentration of reagents, low rate, stopped-low time and others.
The alkaloid quinine ((R
)-(6-methoxyquinolin-4-yl)((2S,4S,8R)-5-vinylquinuclidin-2-yl)methanol
trihydrate), originally extracted from the Peruvian quina
tree (Cinchona), was irstly used as antimalarial.9 Diverse
uses have been reported: in medicine as antiparasitic, antiprotozoal, anti-arrhythmic, antispasmodic; in cosmetics to decrease hair loss; in drinks as flavor drinks and
bitter digestive aid.10 Alkaloids are toxic if consumed in
large doses; consequently the concentration control is mandatory. The Food and Drug Administration of the
United States (FDA)11 has established a limit content for
quinine in soft drink of 83 mg L-1 and in Brazil the National
Health Surveillance Agency (ANVISA)12 established
the concentration of 30 to 50 mg L-1 of quinine. Diverse
procedures are employed for quinine determination,13 but
the intense luorescence in acidic medium is a quinine property that is widely used for its quantiication.14,15
Fluorimetry provides low detection limits and wide linear dynamic range, but its application is restricted because the analyte must be luorescent or a luorescent derivate must
be produced.16 Complex matrixes can be analyzed by high
performance liquid chromatography (HPLC)17 in normal
phase18 or based on ion-pair formation,19 considering
the ionic nature of quinine. But this makes dificult the determination because the equilibrium between mobile and stationary phases is slow and the separation is susceptible to variations of temperature, pH and concentration of organic compounds in the mobile-phase. For quality control, a quick method that saves sample and reagent, and produces low quantities of waste is highly desirable.
The aim of this work was the development of a luorimetric sequential injection analysis (SIA) methodology for quinine determination, suggesting a general protocol to start the optimization of SIA systems and applying the procedure for determination of quinine in soft drinks of several trademarks.
Experimental
Apparatus
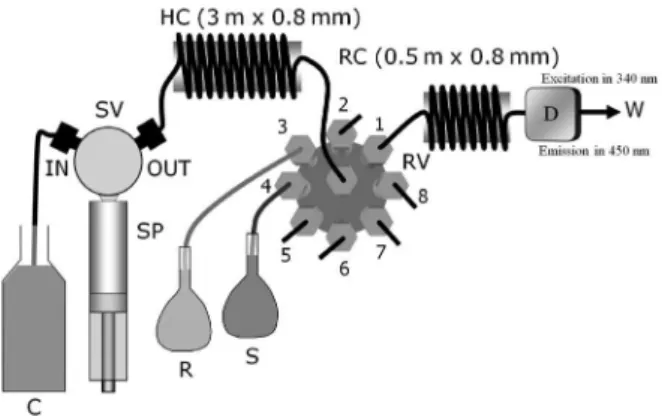
A FIAlab 3500 (FIAlab Instruments, Bellevue, WA) instrument was used in all experiments in the sequential
injection mode according to Figure 1. Solutions were driven by a 5.00 mL syringe pump and an eight port rotary valve (RV, Valco Instrument Co., Houston, TX). The holding coil, HC, was made of 3 m of 0.8 mm i.d. polytetraluoroethylene (PTFE, Telon®, DuPont) tubing. The reaction coil (RC) was 50 cm long, made of 0.8 mm i.d. PTFE tubing. All other tubing connections were made of 0.5 mm i.d. PTFE tubing and PTFE nuts and ferrules (Upchurch, Oak Harbor, WA). The control of the pump and valve was made with the FIAlab 5.0 software. Fluorescence detection was performed with a PMT-FL (FIAlab Instruments) luorimeter with excitation at 340 nm (the source of light was an inexpensive LED), measuring the emission at 450 nm (selected with an interference ilter) using a photomultiplier as detector,
coupled to a 3.1 µL illuminated low cell. Acquisition data
was performed with the FIAlab 5.0 software.
The dispersion was studied by molecular absorbance spectrophotometry at 620 nm with a dye solution composed
of 0.010 mol L-1 bromothymol blue (BTB) in 0.010 mol L-1
borate buffer (pH 9.1), using an USB 4000 spectrometer (Ocean Optics, Dunedin, FL, USA) for measurements. A Tungsten-Halogen lamp LS-1 (Ocean Optics, Dunedin, FL, USA) was used as light source with a Hellma U-low cell
with 10 mm light pathlength and 80 µL internal volume.
Two optical ibers (600 µm diameter and 20 inches long) were used to transmit radiation from the source to the low cell and to the spectrometer.
Reagents and solutions
All solutions were prepared with analytical-grade chemicals and freshly distilled-deionized water. The reagent (R) was prepared by dissolution of concentrated sulfuric acid (ca. 18 mol L-1), making the volume up to
1.0 L with water. A 1000 mg L-1 quinine stock solution
was prepared by dissolution of the sulfate mono-hydrated (Riedel-de-Haën, Seelze-Germany) in water. Working
solutions of concentrations between 0.050 and 100.0 mg L-1
were prepared by dilution of the stock solution in water. Soft drink samples were purchased from a local supermarket and directly analyzed by SIA without any preparation. For the fluorimetric batch methodology the samples were dissolved in 0.050 mol L-1 H
2SO4 and
properly diluted.
Flow diagram and procedure
The low system (Figure 1) is initially illed with carrier solution. To start the automated analyses, the syringe valve is set at position IN and the syringe pump aspirates 4500 mL of carrier solution inside the syringe at a low rate of 300 µL s-1. Next, the syringe valve switches to position
OUT and, with the rotary valve at position 4, the syringe
pump aspirates 500 µL of sample; the rotary valve switches
to port 2 and the syringe pump dispenses 1000 µL, cleaning
the sample line, preparing the system for the determination. In the next step, the syringe pump stacks sequentially
100 µL of the reagent R (port 3), 200 µL of standard or
sample S (port 4), and 100 µL of reagent R (port 3) inside
the holding coil at a low rate of 250 µL s-1. In the inal step,
the rotary valve switches to port 1 and the syringe pump dispenses 2500 µL of carrier at 250 µL s-1, injecting the
mixture zone through the mixing coil and the low cell of the detector. Simultaneously, the acquisition data system is activated and the transient luorescence analytical signal
is obtained. Next, the low rate is increased to 450 µL s-1
and the syringe is emptied, lushing the system for the next analysis. All measurements were carried out in triplicate.
Results and Discussion
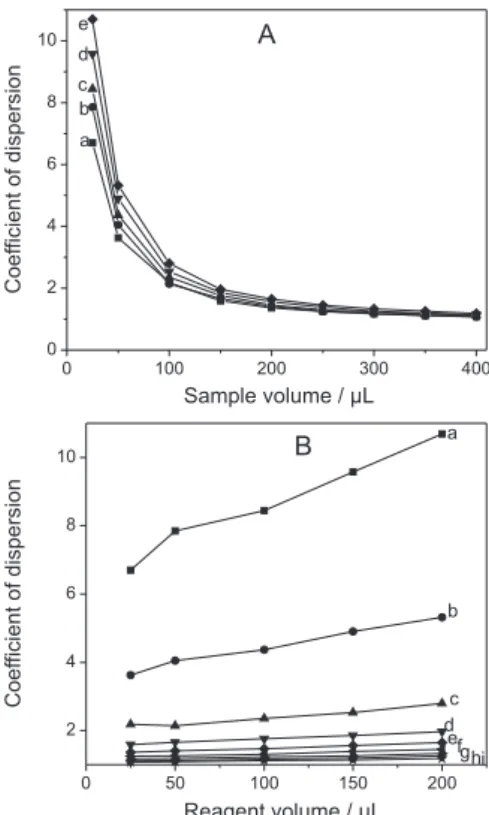
Sample to reagent volume ratios and dispersion
Initially the inluence of the sample and reagent volumes on the dispersion coeficient (D) was studied with the dye solution using a spectrophotometer. The sequence of aspiration to compose the sample zone was established in the “sandwich” format, with the sample between aliquots of reagent. Diverse volumetric proportions of sample and reagent were tested to deine the best compromise between minimal dispersion and eficient mixture. The increase of sample volume (Figure 2A) reduces dramatically the
dispersion, but over 200 µL no signiicant variations are
observed, since the dispersion coeficient approaches the unity. The increase of reagent volume (Figure 2B) has
signiicant inluence on sample dispersion only for sample volumes < 100 µL.
Reagent-based chemistries automated by sequential injection analysis require the identiication of the time interval in which sample and reagent zones are mutually interdispersed, a condition that is achieved for D > 2 if,
at the same time, suficient excess of reagent is present.7
Increase in sample volume enhances the sensitivity of the measurements only if excess of reagent is fed to the sample zone. Thus, for sample volumes as large as the ones leading to 1 < D < 2, sandwiching the sample between reagent zones is recommended. Additionally, under these conditions it is recommended to use reagents with concentration larger than that ones used in low injection systems conigured with conluence points. Figure 3 shows the gradient proile of reagent and sample zones for a method conigured by
sandwiching different sample volumes between 100 µL
reagent zones. Complete interdispersion is achieved for
sample volume of 25 µL (D > 6) as shown in Figure 3A,
but at the cost of low sensitivity of the measurement as a consequence of the large degree of sample dilution. With
a sample volume of 200 µL (Figure 3B), it is still possible
to feed reagent to the sample zone using the sandwich approach, but one must be careful preparing a suficiently
concentrated reagent to warrant its excess in the central portions of the reaction zone. Increasing the sample volume
further to 400 µL (Figure 3C) is no longer recommended
because the reaction will occur only in the edges of the sample zone, which will cause peak distortions leading to inaccuracy in the results, besides to increased sample consumption and decreased the sampling throughput.
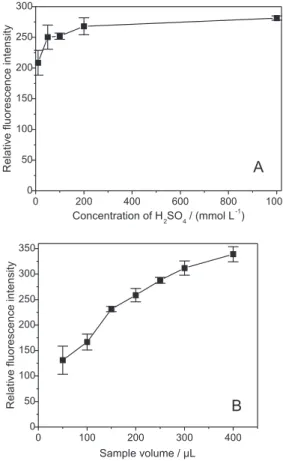
Inluence of the chemical and hydrodynamic parameters
The formation of luorescent species was carried out in acid media, a condition in which the quinine molecule
is rigid and the not radioactive deactivation is less likely. The spectrum of quinine in this condition indicates the presence of two intense maximum of excitation at 280 and 350 nm, the latter wavelength being chosen because it is easily implemented with a LED. The maximal emission is observed in 450 nm, and was monitored with the aid of an interference ilter. Formation of the luorescent species with sulfuric acid is slow, but the product is highly stable and the quenching effect of chloride ions is avoided.
The evaluation of the experimental conditions was carried out by the univariate method. As expected, increase in the concentration of sulfuric acid (Figure 4A)
enhanced the signal, without causing Schlieren effect,20
which is likely to occur in case of spectrophotometric
detection. A sulfuric acid concentration of 100 mmol L-1
was elected, considering the little increase in the signal observed for higher concentrations. The inluence of the
sample volume (sandwiched between two 100 µL zones
of 100 mmol L-1 H
2SO4) is shown in Figure 4B. The
analytical signal increased with the sample volume, but
the volume of 200 µL was selected to avoid the problems
discussed in the previous section, related to lack of sulfuric acid in the central portion of the sample volume. Besides,
Figure 3. Interpenetration of sample (S) and reagent (r) zones using two 100 µL reagent zones sandwiching (A) 25 µL, (B) 200 µL and (C) 400 µL of sample. In this case the transient signal is caused by a 0.01 mol L-1 BTB solution injected either as reagent or sample, using the 0.010 mol L-1 borate buffer as carrier.
sample volumes larger than 200 µL imply in high sample
consumption and signiicant decrease in the sampling throughput. The inluence of the residence time on the analytical signal was studied by varying the low rate in the range from 50 to 400 µL s-1 and the reaction coil length (30,
50 and 100 cm). These parameters did not have signiicant inluence on the analytical signal, indicating the reaction is fast and is completed in the time scale of the experiments.
Flow rate of 250 µL s-1 and reaction coil of 50 cm were
selected to obtain a high sampling throughput, providing quick clean-up of the system after the determination.
Figures of merit
Linear response was observed for quinine concentrations
between 0.05 and 100.0 mg L-1 as quinine sulfate, described
by the equation: I = (532 ± 40) + (2.36 ± 0.04) C with r = 0.999. The detection limit was estimated at 2.3 µg L-1 at
the 99.7% conidence level. Sampling rate and coeficient of variation (n = 10) were estimated at 60 measurements
per hour and 1.9%, respectively. The proposed procedure
consumed the equivalent to 2.2 µL of concentrated sulfuric
acid, which was 322-fold lower than the consumption
in the batch procedure.15 The effluent volume was
4.0 mL per determination, which was 64-fold lower than
the consumption in the batch procedure.15 Comparison
of the reagent consumption with other procedures is
dificult in view of the use of other reagents13 and solvents
in chromatographic separation.19 However the proposed
procedure can be considered a green analytical method in view of the consumption of low amounts of low toxicity reagents.
Selectivity
The main interference in the luorimetric determination
of quinine is related with vitamin B18 and other alkaloids
of similar structure.19 In the case of soft drinks, it is
not expected the presence of any other alkaloid and the quinine concentration is high, so the possible interference of vitamin B is negligible. Other interesting aspect in the low-based procedure in view of the low residence time (ca. 30 s) is the minimization in the extension of side
reactions, improving the selectivity.21
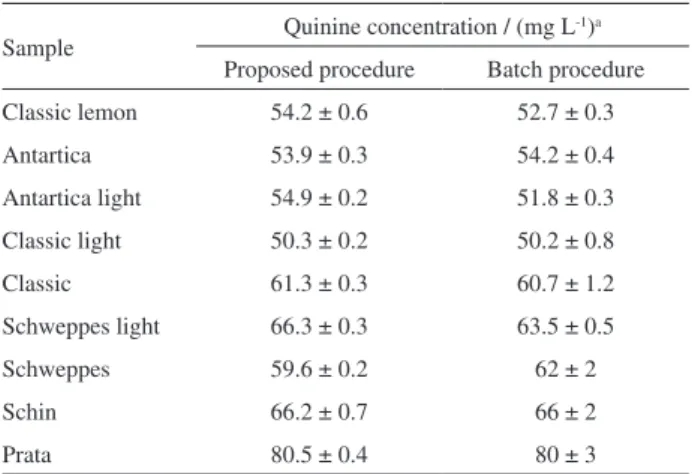
Analysis of samples
The proposed procedure was applied for quinine determination in soft drinks of all the commercially available trademarks in Brazil. Quinine concentrations found in all samples were smaller than the limit value
established by FDA11 (108 mg L-1 as quinine sulfate),
but in two cases these concentrations exceeded the limit
deined by ANVISA12 (65 mg L-1 as quinine sulfate).
Table 1 shows that there is no evidence of statistically signiicant differences between the results obtained by the SIA procedure and those ones obtained by the luorimetric
batch reference procedure15 at the 95% conidence level, by
considering a paired student’s t-test (n = 8). Other proitable characteristics are the possibility of direct determination of quinine, without prior dilution, and reduction of the
analyses time (ca. 1 min), in comparison with about 5 min
required for batch procedures.
Conclusions
The sequential injection analysis methodology shows proitable characteristics for the determination of quinine in soft drinks. Optimization is simple and is started by searching the sample to reagent volumetric ratio that provides eficient mixture and low dispersion. Sensitivity was improved by using a fluorimetric determination yielding a linear response range compatible with diverse
requirements (e.g. the established by the US-FDA11
or ANVISA).12 Sampling throughput was improved
(60 samples per hour) and reagent consumption was at
least 322-fold reduced in relation to previous works15 as a
consequence of the use of intermittent low. The proposed procedure can be considered as a clean alternative for fast quinine determination in soft drinks.
Acknowledgements
The authors acknowledge the fellowships and inancial support from the Conselho Nacional de Desenvolvimento Cientíico e Tecnológico (CNPq) and from the Fundação
Table 1. Quinine determination in soft drink water samples
Sample Quinine concentration / (mg L -1)a
Proposed procedure Batch procedure
Classic lemon 54.2 ± 0.6 52.7 ± 0.3
Antartica 53.9 ± 0.3 54.2 ± 0.4
Antartica light 54.9 ± 0.2 51.8 ± 0.3
Classic light 50.3 ± 0.2 50.2 ± 0.8
Classic 61.3 ± 0.3 60.7 ± 1.2
Schweppes light 66.3 ± 0.3 63.5 ± 0.5
Schweppes 59.6 ± 0.2 62 ± 2
Schin 66.2 ± 0.7 66 ± 2
Prata 80.5 ± 0.4 80 ± 3
.
.
de Amparo à Pesquisa do Estado de São Paulo (FAPESP, grant 2008/09284-3).
References
1. Ruzicka, J.; Marshall, G. D.; Anal. Chim. Acta1990, 237, 329. 2. Mesquita, R. B. R.; Rangel A. O. S. S.; Anal. Chim. Acta 2009,
648, 7.
3. Mervartová, K.; Polásek, M.; Martínez Calatayud, J.; J. Pharm. Biomed. Anal.2007, 45, 367.
4. Economou, A.; TrAC, Trends Anal. Chem. 2005, 24, 416. 5. Cerdà, V.; Cerdà, A.; Cladera, A.; Oms, M. T.; Mas, F.; Gómez,
E.; Bauzá, F.; Miró, M.; Forteza, R.; Estela, J. M.; TrAC, Trends Anal. Chem. 2001, 20, 407.
6. Anastas, P. T.; Kirchoff, M. M.; Acc. Chem. Res.2002, 35, 686. 7. Gubeli, T.; Christian, G. D.; Ruzicka, J.; Anal. Chem. 1991, 63,
2407.
8. Masini, J. C.; Quim. Nova2008, 31, 704.
9. Samuelsson, G.; Drugs of Natural Origin, 5th ed.; Swedish
Pharmaceutical Press: Stockholm, 1992.
10. Papariello, G. J.; Tishler, F. In Encyclopedia of Industrial Chemical Analysis;Snell, F. D.; Hilton, C. L., eds.; Interscience Publishers: New York, 1967, chapter 4.
11. http://www.fda.gov/Food/FoodIngredientsPackaging/ FoodAdditives/ucm191033.htm accessed in January 2011.
12. http://www.anvisa.gov.br/legis/decretos/2314_97.htm accessed in January 2011.
13. Ortega-Algar, S.; Ramos-Martos, N.; Molina-Díaz, A.; Microchim. Acta2004, 147, 211.
14. Guilbault, G. G.; Practical Fluorescence: Theory, Methods and Techniques, 1st ed.; Marcel Decker: New York, 1973.
15. O’Reilly, J. E.; J. Chem. Educ. 1975, 52, 610.
16. Ruzicka, J.; Hansen, E. H.; Flow Injection Analysis, 2nd ed.;
Wiley Interscience: New York, 1988.
17. Gatti, R.; Gioia, M. G.; Cavrini, V.; Anal. Chim. Acta2004, 512, 85.
18. McCalley, D. V.; J. Chromatogr., A 1983, 260, 184.
19. Chen, Q. C.; Wang, J.; J. Liq. Chromatogr. Relat. Technol. 2001, 24, 1341.
20. Zagatto, E. A. G.; Arruda, M. A. Z.; Jacintho, A. O.; Mattos, I. L.; Anal. Chim. Acta 1990, 234, 153.
21. Infante, C. M. C.; Soares, V. R. B.; Korn, M.; Rocha, F. R. P.; Microchim. Acta2008, 161, 279.
Submitted: March 1, 2011 Published online: July 26, 2011