Introduction
Paracetamol (4-acetoaminophen) has mild analgesic and antipyretic properties and is, along with acetylsalicylic acid, one of the most popular analgesic agents. The administration of this drug with caffeine yields analgesic effects significant-ly greater than that of paracetamol alone [1, 2].
Several methods have been employed for the spectrophotometric determination of this drug in combined dosage forms [3-7]. Chromatogra-phic methods have been proposed for the simul-taneous determination of paracetamol and other active principles [8-10], Fluorescence spec-troscopy methods were also described [11, 12], however those methods are time-consuming and use expensive equipments. Electroanalytical methods were proposed to paracetamol
determi-nation in pharmaceutical formulations using car-bon paste electrode [13-15].
Flow injection systems are useful tools for the automation, miniaturization and simplifica-tion of analytical processes. These procedures permit obtain results faster and accurate than batch procedures [16].
Flow injection spectrophotometric sys-tems with spectrophotometric detection were described using nitrite as reactant [17-19]. Other spectrophotometric flow injection methods based on reaction of paracetamol to produce a indophenol dye [20-24] and systems with solid phase UV spectrophotometric detection [25-28] have been described for paracetamol determina-tion in pharmaceutical formuladetermina-tions. Flow proce-dures with chemiluminescence detection were described using luminol based reaction [29, 30]
www.scielo.br/eq www.ecletica.iq.unesp.br
Volume 33, número 2, 2008
Spectrophotometric flow injection procedure to indirect
determination of paracetamol in pharmaceutical formulations
using o-tolidine as reagent
O. Fatibello-Filho*, H. J. Vieira
Departamento de Química, Centro de Ciências Exatas e de Tecnologia Universidade Federal de São Carlos, São Carlos, Brasil.
Abstract: A spectrophotometric flow injection method for the determination of paracetamol in pharma-ceutical formulations is proposed. The procedure was based on the oxidation of paracetamol by sodium hypochloride and the determination of the excess of this oxidant usingo-tolidine dichloride as chro-mogenic reagent at 430 nm. The analytical curve was linear in the paracetamol concentration range from 8.50 x 10⁻⁶to 2.51 x 10⁻⁴mol L-1with a detection limit of 5.0 x 10⁻⁶mol L-1. The relative standard
devia-tion was smaller than 1.2% for 1.20 x 10⁻⁴mol L-1paracetamol solution (n = 10). The results obtained for
paracetamol in pharmaceutical formulations using the proposed flow injection method and those obtained using a USP Pharmacopoeia method are in agreement at the 95% confidence level.
and another method employed the oxidation of tris(2,2’-bipyridyl)ruthenium(II) by potassium permanganate [31]. A Fourier transformed infra-red (FTIR) method based on the detection of products formed in the alkaline hydrolysis of paracetamol was also proposed in the literature [32]. A flow-injection method with spectrofluori-metric detection to determine paracetamol based on its oxidation with hexacyanoferrate(III) was reported [33]. Different techniques for quantifica-tion of paracetamol in pharmaceuticals were evaluated in a recent review [34].
The major substances found as products of chlorination of paracetamol were 1,4-benzo-quinone and N-acetyl-p-benzo1,4-benzo-quinoneimine (NAPQI). Other products that were identified included the chloro-4-acetamidophenol and dichloro-4-acetamidopheno [35].
In this article a fast, simple and accurate flow injection procedure with spectrophotometric detection to determine paracetamol in pharmaceu-tical products exploiting the reaction between paracetamol and hypochlorite is proposed. In this method the excess of oxidant was determined spec-trophotometrically using o-tolidine (3,3’-dimethyl-benzidine) as reagent at a wavelength of 430 nm.
Experimental
Reagents and solutions
All experiments were performed with chemicals of analytical grade: paracetamol (Sigma), o-tolidine hydrochloride (Merck), sodi-um hypochlorite (Vetec, São Paulo, Brazil) and sodium borate (Synth), were used as received. All solutions were prepared with desionized water from a Millipore (Bedford, MA) Milli-Q system (model UV Plus Ultra-Low Organics Water).
A 8.53x10⁻³ mol L-1 paracetamol stock
solution was prepared dissolving 129 mg of this drug with desionized water in a 100.0 mL cali-brated flask and reference solutions were pre-pared by appropriate stock solution dilution with desionized water.
A 4.31x10⁻³mol L-1o-tolidine dichloride
(3,3’-Dimethyl-(1,1’-biphenyl)-4,4’-diamine) stock solution was prepared dissolving 123.0 mg of the reagent with desionized water in a 100.0
mL calibrated flask. An additional dilution was performed in 250.0 mL calibrated flask with 0.19 mol L-1HCl solution to obtain a 9.8x10⁻⁵mol L -1o-tolidine work solution.
A sodium hypochlorite stock solution was prepared diluting 2.0 mL of the concentrated solu-tion in a 250.0 mL calibrated flask with a 1.00x10 -2mol L-1 borate buffer solution (pH 9.0). An
addi-tional dilution was performed transferring 2.0 mL of this solution to a 250.0 mL calibrated flask and the volume was made up with a 1.00x10⁻²mol L-1
borate buffer solution. This stock solution was standardized using a titrimetric method.
A 0.19 mol L-1HCl solution was prepared
by dilution of 8.0 mL HCl (Merck) in 500.0 mL and this solution was standardized with a 0.100 mol L-1NaOH standard solution.
Brazilian pharmaceutical products such as, Cibalena® (Novartis Indústria Farmacêutica, S.B.
dos Campos, SP); Tylenol 500®, Tylenol 750®and
Tylenol DC® (Janssen-Cilag Farmacêutica, São
José dos Campos, SP); Tyramol 750®
(Labora-tórios Farmacêuticos Caresse, São Paulo); Parace-tamol 500®(EMS Sigma Pharma, Hortolândia, São
Paulo); Resfry®(Laboratório Neo Química Com.
Ind. Ltda, Anápolis, GO); Paracetamol®
(Eurofarma Laboratórios Ltda, São Paulo) were purchased from a local drugstore and analyzed using the proposed flow method and a comparative USP Pharmacopoeial procedure [36].
Apparatus
Flow injection spectrophotometric meas-urements were carried out using a Femto 485 spec-trophotometer (São Paulo, Brazil) equipped with a Hellma®flow cell (path length 10 mm, inner
vol-ume 18 µL, NY, USA) connected to a Cole-Parmer (Chicago, Il, USA) model 1202-0000 two-channel strip-chart recorder. An Ismatec®IPC-12 peristaltic
pump (Zurich, Switzerland) supplied with Tygon®
tubing and an injector-commutator were used throughout [37]. The flow manifold was construct-ed with polyethylene tubing (0.8 mm i.d.).
Preparation of pharmaceutical samples
desionized water in 50.0 mL calibrated flask. These solutions were gently shaken by 10 min and the volume was completed with desionized water. Another dilution from theses solutions were per-formed using aliquots varying from 195-200 µL to obtain final concentrations of ca.1.10 x 10-4mol L -1in 25.0 mL calibrated flask with desionized water.
For the liquid formulation, an accurate aliquot of 200 µL was transferred to a 50.0 mL calibrated flask and the volume was completed with desionized water. The final concentration obtained was ca1.1 x 10-4mol L-1.
Flow injection procedure
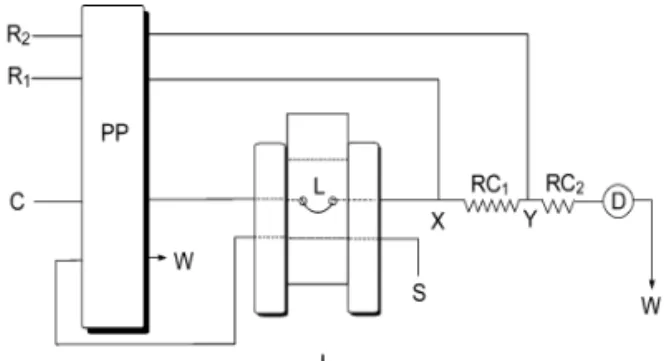
In the flow injection manifold, shown in the Figure 1, when the all solutions were propelled by peristaltic pump, a baseline was generated by reac-tion between the sodium hypochlorite and the o-tolidine streams and continuously monitored by spectrophotometer at 430 nm (equation 1, Scheme 1). The sample or standard solutions containing paracetamol (80 cm; 400 µL) were injected with the aid of injector-commutator into desionized car-rier stream (C; 2.2 mL min-1) and merges
down-stream with 9.4x10⁻⁵mol L-1hypochlorite solution
in 1.00x10⁻²mol L-1borate buffer solution (pH 9.0)
(R1; 0.9 mL min-1) in the confluence pointX
pro-moting the consumption of ClO- (equation 2,
Scheme 1). After the reaction coil RC1(75 cm), the
dispersed sample zone merges with a colorless 9.8x10⁻⁵mol L-1o-tolidine solution in 0.20 mol L -1HCl solution at confluence point Y(R
2; 1.6 mL
min-1) where the yellow reaction product was
mon-itored spectrophotometrically. In this way, the decrease of absorbance (∆A) caused by
hypochlo-Figure 1. Flow injection spectrophotometric method for paracetamol determination in pharma-ceutical products. PP: peristaltic pump; L: sample
loop (400 µL); C: carrier (H2O; 2.2 mL min-1); R
1:
9.4x10⁻⁵mol L-1hypochlorite solution (0.9 mL min
-1); R
2: 9.8x10⁻⁵mol L-1o-tolidine solution (1.6 mL
min-1); I: injector-commutator (80 cm; 400 µL);
RC1and RC2: reaction coil (75 cm, both); D:
spec-trophotometer (λ= 430 nm); X and Y: confluence
point and W: waste. The distance between the injector I and X confluence point was 5 cm.
rite consumption was proportional to concentration of paracetamol in the solution injected.
Comparative procedure
To validation of proposed flow injection method the results obtained were compared with those results obtained using a comparative USP Pharmacopoeia procedure [36]. This procedure is based in the intrinsic absorption of paracetamol in UV region (λ= 244 nm). For the determination of paracetamol, the samples and reference solu-tions were diluted in sodium hydroxide solution and the concentration of paracetamol was per-formed by interpolation in an analytical curve.
Results and discussions
Paracetamol exhibited significant reactivity with hypochlorite when exposed in large molar excess, leading to the production of multiple prod-ucts such as 1,4-benzoquinone, N-acetyl-p-benzo-quinoneimine and another products with molar mass higher than 300 g mol-1[12, 35].
The proposed flow injection system is based on the ability of oxidation of paracetamol by hypochlorite in excess at pH 9.0 and the hypochlo-rite excess was monitored witho-tolidine produc-ing a yellow diiminequinone at pH 9.0 [12, 38].
The chemical and flow injection parame-ters were optimized by univariated method in order to achieve a good compromise between the peak height, reproducibility, accuracy, precision, baseline stability and analytical frequency.
Chemical parameters
Preliminary studies to optimize chemical parameters were carried out using a manifold shown in Figure 1. In this flow system the hypochlorite and o-tolidine flow rates was 1.2 mL min-1and that of
carrier was 2.2 mL min-1, the sample loop of 100 µL,
reaction coil length RC1of 150 cm and reaction coil
length RC2of 60 cm were also used. Initially, the
effect of hypochlorite concentration over the range from 2.4x10⁻⁵to 1.2x10⁻⁴mol L-1on the analytical
signal (∆A) for a 9.4 x 10⁻⁵ mol L-1 paracetamol
solution, using a 9.8 x 10⁻⁵mol L-1o-tolidine in 0.22
mol L-1 HCl solution was investigated. The
analytical signal increased with increase of hypochlorite concentration up to 9.4x10⁻⁵ mol L-1
and, remaining constant for higher concentrations. Thus, a 9.4 x 10⁻⁵mol L-1hypochlorite solution was
selected in further work.
The effect of HCl concentration in the o-tolidine solution on the peak high was studied from 4.4 x 10⁻²to 0.22 mol L-1using a 9.4 x 10⁻⁵
mol L-1hypochlorite solution and 9.8 x 10⁻⁵mol L -1 o-tolidine solution. The analytical signal
increased with increase of the HCl concentration up to 0.20 mol L-1 and remaining constant for
higher concentrations. Thus, the 0.20 mol L-1HCl
was selected for further work.
To study the effect of pH of hypochlorite solution, a 1.00x10⁻²mol L-1 borate buffer solution
was employed. The study was performed over the
pH range from 7.0 to 11.4. The analytical signal showed a slight increased with increase of pH up to pH 9.0. Higher pH promotes a severe interfere in the reaction between ClO-and o-tolidine
decreas-ing the analytical signal due the consumption of HCl of the stream before the confluence point.
The effect of o-tolidine concentration on the analytical signal was investigated in the con-centration range from 1.6 x 10⁻⁵to 1.2 x 10⁻⁴mol
L-1. It was observed that the analytical signal
increased with the increases ofo-tolidine concen-tration up to 9.8 x 10⁻⁵mol L-1remaining constant
for higher o-tolidine concentrations. Furthermore, a 9.8 x 10⁻⁵o-tolidine solution was selected for
fur-ther studies.
Flow injection parameters
The effect of the coiled reactor (RC1 and
RC2) length on the analytical signal was studied
from 30 to 150 cm. In this study, it was observed that increasing the length of coiled reactor RC1up
to 75 cm promote a slight increase of analytical signal. For higher coiled reactor length the analyt-ical signal decreased. Therefore, a 75 cm reactor length (RC1) was selected. The effect of reactor
coil RC2length was studied over the same range,
the signal showed best peak height using a 75 cm length. A reactor coil RC2 of 75 cm length was
selected to further experiments.
The effect of sample volume from 100 to 600 µL on peak height (∆A) was studied for a 5.8 x 10⁻⁴mol L-1paracetamol reference solution. The
analytical signal increased with increase of sample loop volume. Considering the repeatability and height of analytical signal, a 400 µL sample loop length was selected.
The effect of flow rate for o-tolidine, hypochlorite and carrier (desionized water) on ana-lytical signal was studied in the flow rates of 0.9, 1.6 and 2.2 mL min-1, respectively. It was found
that the analytical signal decreased deeply with the increasing of hypochlorite flow rate (R1).
Therefore, a flow rate of 0.9 mL min-1was
select-ed for further experiments. In the o-tolidine flow rate (R2) study it was observed that the highest
ana-lytical signals were obtained for the 1.6 mL min-1
min-1promotes the best analytical signal in terms
of sensitivity and analytical frequency. Thus, a flow rate of 2.2 mL min-1was selected in this work.
Interferences and recovery studies
The selectivity of the proposed flow injec-tion procedure was studied comparing the analyti-cal signal of a 1.5 x 10⁻⁴mol L-1paracetamol
stan-dard solution with 1.5 x 10⁻⁴mol L-1paracetamol
reference solutions containing the commonly excipients found in commercial pharmaceutical formulations in the concentrations that cause a error of ±5%. The studied excipients were
Table 1. Recoveries of paracetamol standard solu-tions.
Samples Added / Founded / Recovery /
10-4mol L-110-4mol L-1 %
Cibalena® 0.50 0.50 100
0.95 0.96 101
1.12 1.13 101
Tylenol 500® 0.50 0.50 100
0.95 0.93 97.8
1.12 1.09 97.3
Tyramol 750® 0.50 0.51 102
0.95 0.97 102
1.12 1.10 98.2
Tylenol 750® 0.50 0.52 104
0.95 0.97 102
1.12 1.11 99.1
Paracetamol 500® 0.50 0.50 100
0.95 0.97 102
1.12 1.15 103
Tylenol DC® 0.50 0.50 100
0.95 0.94 98.9
1.12 1.10 98.2
Resfry® 0.50 0.50 100
0.95 0.94 98.9
1.12 1.10 98.2
Paracetamol® 0.50 0.49 98.0
0.95 0.94 98.9
1.12 1.11 99.1
n=3.
polivinylpirrolidine, citric acid, saccharine, tar-trazine, caffeine, EDTA and sodium car-boxymethylcellulose. Only the citric acid and caf-feine showed high interference above an analyte:interference ratio of 1:10. Probably, these substances are oxidized by ClO-. But, the amounts
of theses substances in the commercial pharma-ceuticals are lower than that of paracetamol. The other excipients do not shown any interference at the same concentration of paracetamol.
The study of addition and recovery of paracetamol in pharmaceutical products was per-formed to verify the interference in potential of sample matrix. Tablets and syrups were employed. This study was performed spiking three aliquots of paracetamol standard solution in the concentra-tions of 5.00 x 10⁻⁵; 9.50 x 10⁻⁵and 1.10 x 10⁻⁴mol
L-1 in a sample solution containing 1.12 x 10⁻⁴mol
L-1 paracetamol. Recoveries of paracetamol
ranged from 97.3 to 103% as shown in Table 1. These results obtained suggested an absence of matrix effect on those determinations.
Analytical features and application
The flow injection procedure developed present an analytical curve linear in the paraceta-mol concentration range form 8.50 x 10⁻⁶to 2.51 x
10-4mol L-1 described by equation: ∆A= 0.058 +
1.571,41 x C; r = 0.9990, where ∆Ais (A1– A2),
the difference between the baseline absorbance (A1) and the transient signal of solution injected
containing paracetamol, and Cis the paracetamol concentration in mol L-1.
The relative standard deviation (RSD) was lower than 1.2% (n = 10) for 1.20 x 10⁻⁴mol L-1
paracetamol solution and the detection limit obtained was 5.0 x 10⁻⁶mol L-1(three times blank
signal/inclination of analytical curve). The analyt-ical frequency of 60 determinations per hour was obtained.
Analytical features attained by the pro-posed flow procedure and those reported by described flow procedures with spectrophoto-metric detection are presented in Table 3. The lin-ear response was comparable with flow system were paracetamol was hydrolyzed before the detection [39] and higher than system described were paracetamol is monitored at an optode [18, 27]. The procedure proposed by Knochen et al. [17] uses a second degree polynomial analytical curve. The sampling rate was higher than proce-dures that have used alkaline hydrolysis and optode as sensor. The detection limit was better than previously reported by Burakham et al. [18],
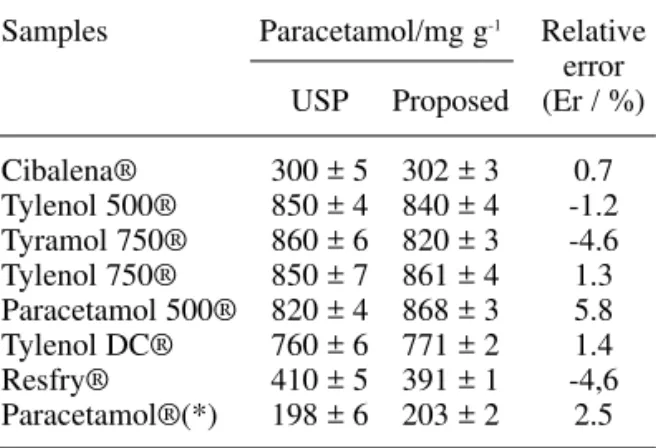
Table 2. Determination of paracetamol in pharma-ceutical products using the flow injection and the USP procedure [36].
Samples Paracetamol/mg g-1 Relative
error
USP Proposed (Er / %)
Cibalena® 300 ± 5 302 ± 3 0.7
Tylenol 500® 850 ± 4 840 ± 4 -1.2
Tyramol 750® 860 ± 6 820 ± 3 -4.6
Tylenol 750® 850 ± 7 861 ± 4 1.3
Paracetamol 500® 820 ± 4 868 ± 3 5.8
Tylenol DC® 760 ± 6 771 ± 2 1.4
Resfry® 410 ± 5 391 ± 1 -4,6
Paracetamol®(*) 198 ± 6 203 ± 2 2.5
n=3;
(*)mg L-1;
Er: FIA vs. USP procedure.
Table 3. Analytical features of spectrophotometric flow procedures for paraceta-mol determination in pharmaceuticals.
anot reported.
but compare unfavorably with those obtained by Criado et al. [39] and by Cañada et al. [27]. However, these flow procedures have showed lower sampling rate.
The proposed flow system compare favor-ably with a chemiluminescence flow procedures described by Alapont et al. [29] and by Pulgarin and Bermejo [33], showing better precision and largest linear range.
Conclusions
The proposed flow procedure was suitable for the determination of paracetamol in pharma-ceutical formulations, presenting accuracy and precision necessary to quality control laboratories. The paracetamol determination not requires exten-sive preliminary sample treatment. The procedure does not require expensive reagents and can be implemented easily in pharmaceutical laborato-ries. This procedure is simpler than spectrofluori-metric procedure described by Vilchez et al. [12] due the use of a suitable spectrophotometer.
Acknowledgements
The scholarship granted to H.J.V. from CAPES is gratefully acknowledged.
References
[1] L.S. Goodman, A. Gilman, Bases Farmacológicas de la Terapêutica, 4 edition, New York, Interamericana, 1974. [2] F.D. Fuchs, L. Wannmacher, Farmacologia Clínica -Fundamentos da Terapêutica Racional, 2 ed., Rio de Janeiro, Guanabara Koogan, 1999.
[3] E. Dinc, C. Yucesoy, F. Onur, J. Pharm. Biomed. Anal.28 (2002) 1091.
[4] S.D. Cekic, H. Filik, R. Apak, J. Anal. Chem. 60 (2005) 1019. [5] A. Afkhami, N. Sarlak, Acta Chim. Slov.52 (2005) 98. [6] P. Nagaraja, K.C.S. Murthy, K.S. Rangappa, J. Pharm. Biomed. Anal.17 (1998) 501.
[7] J.S.E. Romero, L.A. Rodriguez, M.C.G. Alvarezcoque, G. Ramisramos, Analyst 119 (1994) 1381.
[8] R.N. Rao, A. Narasaraju, Anal. Sci.22 (2006) 287. [9] L. Monser, F. Darghouth, J. Pharm. Biomed. Anal. 27 (2002) 851.
[10] M. Gil-Agusti, L. Monferrer-Pons, M.C. Garcia-Alvarez-Coque, J. Esteve-Romero, Talanta 54 (2001) 621.
[11] A.B. Moreira, H.P.M. Oliveira, T.D.Z. Atvars, I.L.T. Dias, G.O. Neto, E.A.G. Zagatto, L.T. Kubota, Anal. Chim. Acta 539 (2005) 257.
[12] J.L. Vilchez, R. Blanc, R. Avidad, A. Navalon, J. Pharm. Biomed. Anal. 13 (1995) 1119.
[13] I.C. Vieira, K.O. Lupetti, O. Fatibello-Filho, Quim. Nova 26 (2003) 39.
[14] C.Y. Wang, X.Y. Hu, Z.Z. Leng, G.J. Yang, G.D. Jin, Anal. Lett.34 (2001) 2747.
[15] O. Fatibello-Filho, K.O. Lupetti, I.C. Vieira, Talanta 55 (2001) 685.
[16] J. Martínez-Calatayud, Flow Injection Analysis of Pharmaceuticals - Automation in Laboratory, 1 ed., Taylor & Francis Inc., 1996.
[17] M. Knochen, J. Giglio, B.F. Reis, J. Pharm. Biomed. Anal.33 (2003) 191.
[18] R. Burakham, S. Duangthong, L. Patimapornlert, N. Lenghor, S. Kasiwad, L. Srivichai, S. Lapanantnoppakhun, J. Jakmunee, K. Grudpan, Anal. Sci.20 (2004) 837.
[19] W.T. Suarez, H.J. Vieira, O. Fatibello-Filho, Ecl. Quim.
30 (2005) 21.
[20] Z. Bouhsain, S. Garrigues, A. Morales-Rubio, M. de la Guardia, Anal. Chim. Acta 330 (1996) 59.
[21] A. Criado, S. Cardenas, M. Gallego, M. Valcarcel, Analyst 125 (2000) 1179.
[22] C. Aniceto, O. Fatibello-FIlho, Quim. Nova 25 (2002) 387.
[23] F. Priego-Capote, M.D.L. de Castro, Anal. Chim. Acta 489 (2003) 223.
[24] A.F. Lavorante, C.K. Pires, B.F. Reis, J. Pharm. Biomed. Anal. 42 (2006) 423.
[25] A.R. Medina, M.L.F. de Cordova, A.M. Diaz, Anal. Chim. Acta 394 (1999) 149.
[26] A. Ruiz-Medina, M.L. Fernandez-de Cordova, M.J. Ayora-Canada, M.I. Pascual-Reguera, A. Molina-Diaz, Anal. Chim. Acta404 (2000) 131.
[27] M.J.A. Cañada, M.I.P. Reguera, A.R. Medina, M.L.F. de Cordova, A.M. Diaz, J. Pharm. Biomed. Anal.22 (2000) 59. [28] P. Ortega-Barrales, R. Padilla-Weigand, A. Molina-Diaz, Anal. Sci. 18 (2002) 1241.
[29] A.G. Alapont, L.L. Zamora, J.M. Calatayud, J. Pharm. Biomed. Anal.21 (1999) 311.
[30] D. Easwaramoorthy, Y.C. Yu, H.J. Huang, Anal. Chim. Acta 439 (2001) 95.
[31] W. Ruengsitagoon, S. Liawruangrath, A. Townshend, Talanta 69 (2006) 976.
[32] M.L. Ramos, J.F. Tyson, D.J. Curran, Anal. Chim. Acta 364 (1998) 107.
[33] J.A.M. Pulgarin, L.F.G. Bermejo, Anal. Chim. Acta 333 (1996) 59.
[34] M.E. Bosch, A.J.R. Sánchez, F.S. Rojas, C.B. Ojeda, J. Pharm. Bomed. Anal.42 (2006) 291.
[35] M. Bedner, W.A. Maccrehan, Environ. Sci. Tech. 40 (2006) 516.
[36] USP, United States Pharmacopeial XXII, Rockville, MD, U.S Pharmacopeial Convention, 1990.
[37] B.F. Reis, H. Bergamin-Filho, Quim. Nova 16 (1993) 570.
[38] J.D. Johnson, R. Overby, Anal. Chem.41 (1969) 1744. [39] A. Criado, S. Cardenas, M. Gallego, M. Valcarcel, Talanta 53 (2000) 417.
O. F. Filho, H. J. Vieira. Método de análise por injeção em fluxo para determinação indireta de paracetamol em formulações farmacêuticas empregando o-tolidina como reagente.
Resumo: Um procedimento de injeção em fluxo com detecção espectrofotométrica para a determinação de paracetamol foi descrito. O procedimento foi baseado na reação de oxidação do paracetamol pelo hipoclorito de sódio e a determinação de seu excesso empregando o dicloreto de o-tolidina como reagente cromogênico. A curva analítica apresentou um comportamento linear entre as concentrações de paraceta-mol de 8,5 x 10⁻⁶a 2,51 x 10⁻⁴mol L-1com um limite de detecção de 5,0 x 10⁻⁶mol L-1. O desvio padrão
relativo foi menor que 1,2% para uma solução de paracetamol de 1,20 x 10⁻⁴mol L-1(n=10). Os
resulta-dos obtiresulta-dos nas análises de produtos farmacêuticos comerciais obtiresulta-dos empregando o procedimento desen-volvido foram comparados com aqueles obtidos empregando o procedimento descrito na Farmacopéia Americana (USP XXII) estando em concordância ao nível de confiança de 95%.