Caitlin Lara Thorn
PREDEFINING REGIONALISED ENVIRONMENTS
FOR ASSISTED NAVIGATION
Does incorporating regions into navigation instructions assist a
user’s spatial understanding of the environment they are
PREDEFINING REGIONALISED ENVIRONMENTS
FOR ASSISTED NAVIGATION
Does incorporating regions into navigation instructions assist a user’s spatial understanding of the environment they are travelling through?
Dissertation presented by
CAITLIN LARA THORN
Dissertation supervised by
Dr. Jakub Krukar Prof. Dr. Angela Schwering
Dr. Francisco Ramos
Submitted to
Westfälische Wilhelms-Universität Münster, Institute for Geoinformatics (ifgi) Münster, Germany
Universidade Nova de Lisboa, NOVA – Information Managemant School Lisbon, Portugal
Universitat Jaume I, Dept. Lenguajes y Sistemas Informaticos Castellón, Spain
I, Caitlin Lara Thorn,
hereby confirm that the following Master Thesis titled
“Predefining Regionalised Environments for Assisted
Navigation: Does incorporating regions into navigation
instructions assist a user’s spatial understanding of the
environment they are travelling through?”
was completed independently as a requirement for the Master
of Science in Geospatial Technologies. All other work,
figures and tables used in this work have been truthfully
referenced.
ACKNOWLEDGEMENTS
First and foremost, I’d like to thank my parents (Melissa and Darryn) for enabling me to have this opportunity. I certainly could not have done it otherwise. Thank you to my little brother Elliot. I’d like to thank my grandparents (Fay and Paul) for almost burning churches down to get me through this.
Thank you to Niklas for being a constant source of support to me throughout my thesis writing, I couldn’t have done it without your encouragement. Thank you to Lisa for the late-night study sessions and keeping me motivated, and to the rest of my wonderful classmates for sharing in the ups and downs of this journey together. Thank you to all of the participants in my experiment, your time was sincerely appreciated.
Finally, I’d like to thank my supervisors: Jakub, Angela, and Francisco, for putting their time into assisting me and providing valuable feedback and resources throughout this process.
Predefining Regionalised Environments for Assisted
Navigation
ABSTRACT
This thesis proposes introducing pre-defined regionalised areas into navigation instructions to allow drivers to learn more about the environment they’re travelling through. Following detailed navigation instructions, drivers are no longer required to learn about and understand their environment, which leaves drivers reliant on these navigation devices. An experiment using a virtual environment was conducted to evaluate if a group with additional regional instructions would complete tasks more effectively than a group with traditional instructions. While the regional group performed better on all accounts, statistically significant results were only found in three of ten variables. There were however, large differences in task completion rates, suggesting that incorporating pre-defined regions to navigation instructions does make a difference in drivers’ understanding of their environment.
KEYWORDS
Google Earth Google Street View In-car navigation Navigation systems
Regionalised environments / Regionalized environments Spatial cognition
Spatial knowledge Way-finding
ACRONYMS
EU-GNSS European Global Navigation Satellite Systems Agency GLONASS Globalnaya navigatsionnaya sputnikovaya Sistema
(Global Navigation Satellite System of the Russian Federal Space Agency)
GNSS Global Navigation Satellite Systems
GPS Global Positioning System
HCI Human-Computer Interaction
LBS Location Based Services
USA United States of America
INDEX OF TEXT
ACKNOWLEDGEMENTS III
ABSTRACT IV
KEYWORDS V
ACRONYMS VI
INDEX OF TEXT VII
INDEX OF TABLES IX
INDEX OF FIGURES X
CHAPTER 1: INTRODUCTION 1
1.1INTRODUCING THE PROBLEM &MOTIVATION 1
1.2HYPOTHESES &OBJECTIVES 2
CHAPTER 2: LITERATURE REVIEW 3
2.1HISTORY OF NAVIGATION SERVICES 3
2.2RELATIONSHIP BETWEEN CURRENT NAVIGATION SYSTEM
INSTRUCTIONS & COGNITIVE LOAD 5
2.3SPATIAL KNOWLEDGE 6
2.4PREVIOUS RESEARCH ON IMPROVING NAVIGATION SYSTEMS 7
2.4.1 Landmark Research 8
2.4.2 Route Personalisation 9
2.4.3 Previous Regional Research 10
2.5VIRTUAL ENVIRONMENTS 10
3.1RESEARCH STRATEGY AND DESIGN 13
3.1.1 Using Google Earth 14
3.1.2 Selection of the Study Area 14
3.1.2 Ethical Considerations 15
3.2RESEARCH PROCEDURE 16
3.2.1 Study conditions and Materials 23
3.2.2 Minimising errors and bias 24
3.2.3 Dependent Variables 25 3.3PARTICIPANTS 26 3.4PILOT STUDY 26 CHAPTER 4: RESULTS 28 4.1PARTICIPANT PROFILES 28 4.2DATA ANALYSIS 28 CHAPTER 5: DISCUSSION 34 5.1THE TASKS 35 5.2LIMITATIONS 37 5.2.1 Data collection 37 5.2.3 Experiment Design 38 5.2.3 Analysis 39 CHAPTER 6: CONCLUSIONS 40 6.1FUTURE WORK 40 REFERENCE LIST 41 APPENDIX 45
INDEX OF TABLES
Table 1: Navigation instructions for route task 21
Table 2: Biases and error as explained by Lazar et al. (2017) and measures to
minimise them within the study 24
Table 3: Participant demographic information 45
Table 4: Raw results 46
Table 5: Descriptive statistics 47
INDEX OF FIGURES
Figure 1: Revenue in different segments of GNSS for 2015-2025 4
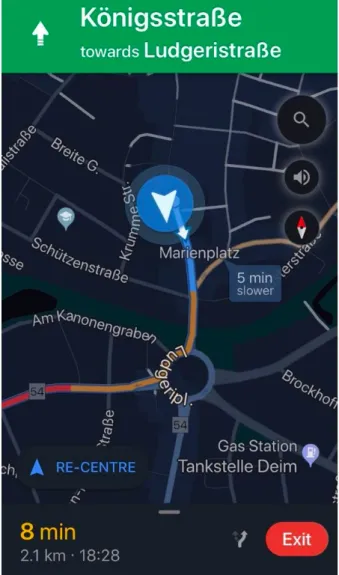
Figure 2: Google Maps navigation interface 6
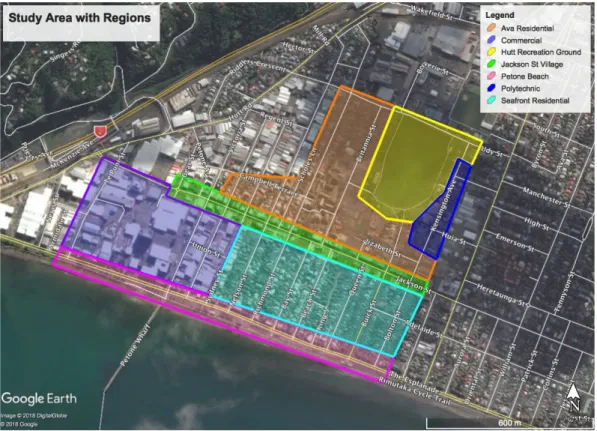
Figure 3: Study area and region map 15
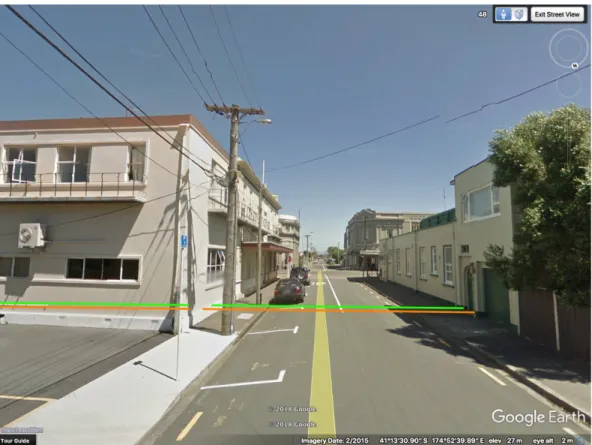
Figure 4: Region boundary lines 17
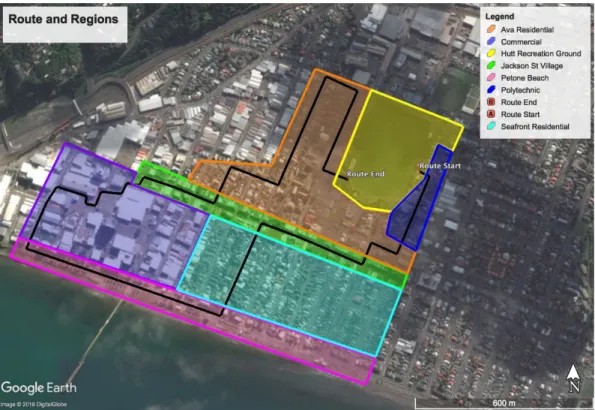
Figure 5: Route map, with regions 18
Figure 6: Regional and control instructions, as visible to participants 19 Figure 7: Task map (Base map from Google Earth, 2018 imagery) 21
Figure 8: Process of experimental procedure 21
Figure 9: Average time of completed tasks 29
Figure 10: Average distance of completed tasks 29
Figure 11: Task 1 data distribution 30
Figure 12: Task 2 data distribution 30
Figure 13: Task 3 data distribution 31
Figure 14: Task 4 data distribution 31
Figure 15: Task 5 data distribution 32
Figure 16: Task completion rates 33
Figure 17: Task 1 destination 49
Figure 18: Task 2 destination 49
Figure 19: Task 3 destination 50
Figure 20: Task 4 destination 50
CHAPTER 1: INTRODUCTION
1.1 INTRODUCING THE PROBLEM & MOTIVATION
Whether travelling between cities or within a city, instructions are often required when a driver is either unfamiliar or unconfident with the environment they are navigating. The use of in-car navigation devices solves this problem. Drivers can confidently navigate to their destination following step-by-step instructions (EU-GNSS, 2017). However, this comes at a cost. Following detailed navigation instructions, drivers are no longer required to learn about and understand the environment they are travelling through. This leaves drivers reliant on these navigation devices (Brown & Laurier, 2012). Reducing this reliance is beneficial in cases of technological failure, or when there is limited access to navigation devices. It would allow a higher independence and confidence among drivers. This thesis proposes introducing predefined regionalised areas into navigation instructions, to allow drivers to learn more about the environment they’re travelling through. Humans naturally acknowledge a hierarchy in cognitive spatial knowledge, including forming regions by clustering similar landmarks and landscapes (Hirtle & Jonides, 1985), thus this incorporation would allow visualisation of this phenomenon by the user.
The motivation behind this thesis is to allow users to more effectively gain spatial knowledge when using navigation devices. A further motivation is to contribute to the vast information in the field of spatial cognition, improving understanding on human interaction with their environment. Choosing regions as the basis for extra information in this study advances previous research which incorporates features or landmarks into navigation systems.
Within this study, regions are defined as polygons of the virtual city. Each location in a city will fall within a polygon, each polygon will have a unique name which
city areas, and will also highlight city features. For example, “Lake District” would be the region directly on the lake front. These regions are predefined, as they would be if incorporated into a navigation system.
1.2 HYPOTHESES & OBJECTIVES
The following study aims to discover if incorporating regions into navigational instructions assists a user’s spatial understanding of the area travelled through.
This will be studied under the following hypotheses:
H0: Introducing regions to traditional navigation instructions will not allow the user to gain an increased understanding of their environment.
H1: Introducing regions to traditional navigation instructions will allow the user to gain an increased understanding of their environment.
The objectives of this thesis are as follows:
• Investigate the current state of navigation systems and their relation to spatial knowledge in users.
• Simulate a real world driving environment which allows for accurate analysis, comparable to that of a real-world driving test.
• Test spatial knowledge when incorporating regions in navigation systems, compared to that without regions.
• Draw conclusions on the above hypotheses.
The following sections provide insight to the literature which motivates the problem and solutions, followed be the experiment methodology which explores and tests the viability of region inclusion in navigation systems. Results will be analysed and discussed, and conclusions will be drawn.
CHAPTER 2: LITERATURE REVIEW
2.1 HISTORY OF NAVIGATION SERVICES
In-car navigation services (also referred to throughout this paper as GPS) aim to aid wayfinding and navigation for drivers by displaying step-by-step instructions (EU-GNSS, 2017) and displaying images of the environment on a vector map, or satellite imagery based raster map, enabling the user to follow instructions more efficiently (Leshed et al., 2008). A user can input geographic coordinates, a street address, or more recently landmarks, such as a business name, and be presented with directions. Current in-car navigation systems evolved from traditional 2D paper maps. These systems generally use the Global Positioning System (GPS) to provide real-time location information, using satellites to calculate and constantly update a user’s current position (Parush, et al., 2007). This is also why in-car navigation systems are colloquially referred to as a “GPS”. This location information is over-laid with a map indicating environmental features which should assist with navigation (EU-GNSS, 2017). GPS requires only the driver to use the device, unlike traditional maps where a secondary party may be involved to communicate instructions, thus enabling more freedom in travel and navigation (Leshed, et al., 2008). GPS services were initially developed for military use in the United States in the 1970s (Gomarasca, 2009). By the 1980s, the first commercial systems were developed, however they did not become prevalent until the mid-2000s (Gomarasca, 2009).
Nowadays, these devices can incorporate additional information such as real-time traffic and up to date travel time information (EU-GNSS, 2017). These devices are also not limited to use amongst drivers, but are also very common amongst all forms of transport including for pedestrians and cyclists. The GPS network consists of between 24 and 32 satellites put into orbit by the United States, four of which are required to be visible at one time for accurate positioning data (Gomarasca, 2009). While other satellite navigation systems exist, such as Russia’s GLONASS, the
Commission, 2018) in order to reduce reliance on the USA’s GPS system (Gomarasca, 2009). More regional and country based systems also exist (EU-GNSS, 2017). Currently, the sales of personal navigation devices are decreasing, as most mobile phones come equipped with GPS capabilities, allowing people to access this technology without purchasing an additional device. The European Global Navigation Satellite Systems Agency (EU-GNSS, 2017) estimates that 5.8 billion devices with satellite navigation capabilities were operational in 2017, around 80% of which were smartphones. Figure 1 displays the cumulative revenue within the GNSS industry, which breaks down the market value of different uses. Road usage, including in-car navigation, traffic management, and automated driving accounts for 50% of revenue in the GNSS field, while location-based services (LBS) which includes smartphone navigation and personal movement tracking, makes up 43% (EU-GNSS, 2017). This shows major value in developing these areas and making them as suitable and technologically advanced as possible both for existing users and future users.
Figure 1: Revenue in different segments of GNSS for 2015-2025 (Originally from: EU-GNSS, 2017)
2.2 RELATIONSHIP BETWEEN CURRENT NAVIGATION SYSTEM INSTRUCTIONS & COGNITIVE LOAD
A major advantage of using navigation services, is that they require a low cognitive load to use, in the sense that the driver needn’t focus much attention on the device. The turn-by-turn instructions allow the user to only remember the next turn they need to make, rather than a series of turns. Cognitive load is the sum of mental effort in working memory required for problem solving (Sweller, 1998). A high cognitive load can create stress for a user, as it requires a larger effort to process information (Schreiber, 2009). Therefore, only following one instruction at a time requires a low cognitive load and is beneficial for cognitive load reduction. Cognitive load theory is a significant factor in creating instructional systems (Plass, et al., 2010), such as those in navigation systems.
Current use of navigational devices, such as GPS in cars, aims to decrease cognitive load on the driver, to allow the driver to focus on other things such as their driving, without having to be concerned with remembering a detailed route. By presenting step-by-step instructions based on the driver’s current position, the driver must only follow one step at a time, and can refer to the GPS device for orientation. This, however limits personal connections with the environment being travelled through, and limits the formation of a complete cognitive map, due to following detailed instructions (Burnett & Lee, 2005; Gramann, et al. 2016). Figure 2 presents an example of a navigation interface from Google Maps, a commonly used smartphone application for in-car navigation. This system combines visual, text, and audio instructions. Using a multimedia interface is another way cognitive load is reduced in navigation systems. (Münzer, et al., 2006).
While developed to assist navigation in unknown environments, an increase in usability of navigational devices over time has become so extreme it can now detrimentally affect the problem it is trying to solve by not allowing individuals to understand and improve their spatial knowledge, thus creating a reliance on the
devices. Leshed, et al. (2008) acknowledges that interactions with the environment are not highly considered or favoured in the design of GPS navigation products.
Figure 2: Google Maps navigation interface
2.3 SPATIAL KNOWLEDGE
Spatial knowledge and spatial cognition abilities vary vastly amongst people, and is studied within the field of cognitive science (Richter & Winter, 2014). Spatial knowledge can be divided into three main parts – landmark knowledge, route knowledge, and survey knowledge (Aginsky, et al., 1997). This idea was first proposed by Lynch (1960), who noted features in spatial knowledge, including
landmarks, routes and districts. There is a hierarchic structure to spatial knowledge – landmarks are learned first as a person is familiarising themselves with a new environent, followed by routes, and lastly survey knowledge, which provides an overview of the environment, such as understanding areas and regions of the environment, and connections between them (Aginsky, et al., 1997).
A comprehensive cognitive map is advantageous for an individual as it allows a deeper understanding of nodes and paths, allowing an increase in knowledge of alternative routes, therefore providing an individual with a more advanced means of navigation (Burnett & Lee, 2005). Benefits to a person in gaining spatial knowledge include being more confident in exploring the environment and deviating from suggested routes, and being prepared for when the technology breaks down. (Münzer, et al., 2006). An advanced spatial understanding allows people to be more resilient to unexpected difficulties in navigation, such as road closures, or receiving the incorrect instructions from a GPS navigation device (Leshed et al., 2008).
2.4 PREVIOUS RESEARCH ON IMPROVING NAVIGATION SYSTEMS
It is beneficial to understand the environment being travelled through as it allows less reliance on technology. By remaining vigilant, and understanding the instructions of the navigation device, a driver is no longer required to rely completely on the instructions of the technology, rather enabling a driver to relate instructions to what they experience in the real world (Leshed et al., 2008). Many studies have been carried out, researching how to improve spatial knowledge in GPS users, often referred to as route learning tasks, where a driver is enabled to become familiar with a route and demonstrate knowledge of it repeatedly (Aginsky, et al., 1997). Leshed, et al. (2008) suggest increasing a user’s connection with their environment when using GPS for navigation. Anacta, et al. (2017) states an important factor in navigation instructions is for the individual to remain spatially oriented, allowing assistance if technology fails.
If a person had absolutely no spatial knowledge, a technology failure would be devastating, and leave the person lost. (Münzer, et al., 2006). Measurement errors are also a factor within navigation systems (Gomarasca, 2009), and would leave a user with incorrect information, thus again leaving them lost. This outlines why it is essential to mitigate the issue and discover how environmental knowledge and knowledge of spatial relations can be improved within the GPS system. GPS devices are however not an inherently negative technology as they allow for people to interact with their environment in a different manner and make cognitive connections within the environment they previously would not have. Thus, being able to preserve the current advantages such minimising a cognitive load and allowing a driver to navigate independently is important to consider when finding a solution to improving spatial knowledge.
2.4.1 LANDMARK RESEARCH
Landmarks are recognisable and significant visual objects, such as buildings or land formations, therefore are useful in assisting navigation (Siegel & White, 1975). Landmarks fall under a hierarchy, where more prominent landmarks unique to a city would first be used to identify a location or give instructions, followed by a route which relies on being related to the first entity. For example, while a city may have many supermarkets, only one will be relevant in relation to a specific park. In this way, landmark hierarchies are used in navigation instructions (Winter, Tomko, Elias, & Sester, 2008). Landmarks tend to be recognised within a route, rather than as independently significant (Aginsky, et al., 1997). Landmarks can also be categorised as local or global landmarks (Steck & Mallot, 2000). Local landmarks can only be seen close to their location, while global landmarks are larger features and can be used for orientation from a distance. Landmarks can interchangeably be local or global, depending on their use at the time (Steck & Mallot, 2000).
There are a vast amount of studies incorporating landmarks into navigation instructions. These have overwhelmingly proven landmarks as a major source of wayfinding and navigation information amongst humans (Anacta, et al., 2017; Han,
et al., 2012; Steck & Mallot, 2000). Steck & Mallot (2000) tested the use of local and global landmarks for wayfinding within a virtual environment, and found that both types of landmarks are used in navigational decisions. Large et al. (2016) incorporated landmarks into navigation systems to improve spatial knowledge and reduce driver reliance on navigation systems. They presented a model for crowdsourcing landmark information which could be applied to crowdsourcing other spatial information for in-car navigation systems.
Gramann et al. (2017) introduced landmarks to navigation instructions in a virtual environment, and this was shown to improve spatial understanding in driver. Using GPS navigation however may also hinder an individual’s ability to interact with landmarks on the road, by focussing only on the GPS and not on the road (Leshed et al., 2008). As landmarks are generally single objects they can be easily missed, requiring a driver to backtrack and less efficiently navigate to their destination.
2.4.2 ROUTE PERSONALISATION
Patel, et al. (2006), looks at incorporating features in the environment relevant to an individual into navigation instructions through an application called “MyRoute”. This application allows a user to input familiar places such as their work or school. Instructions for navigation will then be provided as succinctly as possible, using these known landmarks. For example, instructing a user to drive to their work before continuing with detailed instructions in unfamiliar areas. The final route will not always be the most efficient, as the programme aims to maximise familiarity, thus minimising instructions, rather than travel time (Patel, et al., 2006). Another study, by Ziegler, et al. (2011), uses simplified route instructions based on a participant’s evaluation of their prior spatial knowledge. Gramann et al. (2017) also explores incorporating personal information to navigation systems. This was shown to improve spatial knowledge; however, it was not significantly different to incorporating other landmarks in the instructions.
However, an issue with these previous studies which define spatial knowledge of a person is the limited ability to incorporate these instructions at a large scale. The system requires inputs from an individual, which is a timely process (Patel, et al., 2006). Ziegler et al. (2011), for example, were unable to produce individual-specific driving instructions routes without taking the time to input knowledge of each area by hand. Dehumanising this aspect of the process would create a more efficient system.
2.4.3 PREVIOUS REGIONAL RESEARCH
Regions, or districts, are areas with similar appearances, such as a cluster of buildings with similar exteriors (Lynch, 1960). A region would have distinct features that separate it from a neighbouring region, while some features could overlap. Features could include building types, land formations, or cultural uniformities (Lynch, 1960). Regions are a hierarchical aspect in human route formation and navigation (Wiener, et al., 2004), therefore, several studies have previously looked into using regions as a basis for navigation instructions. As regions are at a larger scale than landmarks, having an idea of their spatial layout could fill gaps in environmental understanding (Wiener, et al., 2004). Wiener, et al. (2004) used regions in a navigation and routing test. They predicted and showed that, as regional information is a structural aspect in spatial cognition, knowledge of regions would assist with route planning and navigation to landmarks. It was found that route planning occurs following a “fine-to-coarse” model, where people relate nearby locations to each other in a fine cognitive view - with more detail, and they relate regions to each other in a coarse cognitive view, or a less detailed overview of the environment (Weiner & Mallot, 2003).
2.5 VIRTUAL ENVIRONMENTS
This project will use virtual reality (VR) to simulate a realistic city environment, which participants will “drive” through, following a set of navigational instructions, based on that of a typical hand-held navigation device. This project seeks to develop
navigational instructions which assists formation of a cognitive map of the travel area, in the participant, allowing improved navigation in the future. The use of a VR city is valid as previous studies have shown virtual realities accurately represent that of the real world (Witmer, et al., 1996).
While there are some disadvantages to using VR in driving scenarios and navigation studies, such as an incomplete visual perspective, and a less realistic view, overall the use of VR is strongly supported by the literature (Witmer, et al., 1996). The use of a virtual environment allows complete focus on the task at hand, without distraction from other senses. In this case, the task used mostly visual cues with added auditory instructions to reinforce the visual. VR has previously been used in region-based studies by Weiner, et al. (2004) to investigate the use of various strategies in the route-planning, as well as in Gramann, et al. (2017) to incorporate new instructions into a navigation system, amongst many others.
2.6 SUMMARY OF LITERATURE FINDINGS
Current in-car and other GPS-based navigation systems minimise cognitive load by providing detailed navigation instructions, however this limits connections a user can make with their environment (Gramann, et al., 2017). There is a huge range of factors to be considered when designing navigation systems to improve users’ spatial cognition and knowledge of the environment. While landmark integration to navigation systems has largely been addressed by the literature, landmarks are of course only one aspect of spatial knowledge, thus further research into possible additions to current navigation systems should be done. Having knowledge of a region is beneficial to having a broader understanding of the environment (Wiener, et al., 2004), particularly when landmarks are not present. As regions are universal, using these would allow for simpler integration within an existing navigation system, than, for example, personalised routes if effective, as it is not specific to an individual’s needs. Studies showing that a regional structure is used in humans’ cognitive maps introduces a theoretical context for introducing regions into
factor in spatial knowledge formation, using this may allow users to learn from the top-down. Incorporating regions should increase incidental spatial cognition in users, allowing them to have a greater understanding of their location and orientation in the environment.
CHAPTER 3: METHODOLOGY
3.1 RESEARCH STRATEGY AND DESIGN
Naming regions should allow the individual to create a more direct connection with a place, and contribute to a more advanced route knowledge and survey knowledge (Burnett & Lee, 2005) of the environment. While still maintaining low cognitive load as instructions will remain detailed. In order to investigate if including regions in navigation instructions will allow a user to gain an increased understanding of their environment, participants will undergo a driving test through a simulated environment. This experiment involves human-computer interaction (HCI), therefore principles of HCI experiment design were followed in order to create a true experiment, as outlined in Lazar, et al. (2017).
The research hypothesis that introducing regions to traditional navigation instructions will allow the user to gain an increased understanding of their environment, while maintaining a minimal cognitive load, will be tested by assigning the participants to two groups, the test group will receive additional information on the regions they are travelling through. The control group will have traditional navigation instructions, with no extra information on the area, and complete the same tests. Both test groups will follow the same route, in the same test area. Participants will be assigned to either the test group or control group using a random number generator. Generating either 1 or 2, a 1 will assign a participant to the test group and 2 to the control group. They will not be told of their group or given information on the other group.
The dependent variables in the study are the time and distance taken to complete tasks. Time will be measured and recorded using a stop watch, by the tester as the participant completes the task, and distance will be recorded after the task as the tester reviews the paths the participant took to complete the task. These measures will be evaluated with statistical significance tests and compared between groups.
participants will only be exposed to one condition to minimise learning effects. This study draws on evidence found in previous landmark studies by incorporating landmarks as a basis for evaluating the effectiveness of incorporating regions, without explicitly mentioning the incorporation of these landmarks.
3.1.1 USING GOOGLE EARTH
The virtual test environment will use Google Earth’s Street View. This was chosen as it provides an extremely realistic view, in its use of a real city. This programme uses imagery taken by Google Street View cars, driving with cameras mounted to their roofs. These cameras capture images at different angles as the car drives along, which are then stitched together to form a 360-degree image. Rundle, et al., (2011) validated Google Street View as a means to audit neighbourhoods, without physically visiting them, only limited by the varying data collection time.
In November 2017, Google Street View introduced an algorithm to provide a more seamless image quality. This algorithm, related to optical flow, allows previously disconnected image alignment to be stitched together, thus improving the overall image quality and virtual display of the environment but removing gaps and discontinuity in images (Kranin, 2017).
By using a virtual environment, conditions can be highly controlled, thereby creating an equal environment for all participants.
3.1.2 SELECTION OF THE STUDY AREA
The suburb of Petone, in Lower Hutt, New Zealand was chosen for the study area due to the range of distinct regions within a small area. This includes Petone Beach, a commercial area, a shopping village, a recreation ground, a polytechnic institution, and two residential areas. The study area and its regions are introduced in Figure 3.
Figure 3: Study area and region map (Base map from Google Earth, 2018 imagery)
Alongside distinctive regions, this area was ideal due to the author’s personal familiarity enabling more efficient region and test development, and its distance from the experiment location in Germany, minimising the chance potential participants would be familiar with the area. Prior to being accepted as a study participant, individuals had to confirm they had no knowledge of Lower Hutt, New Zealand. Prior knowledge of the city would be advantageous for participants in their driving tasks, as it would contribute to their survey knowledge and layout of the city. To make this test scientifically accurate, confirming participants had no prior knowledge of the area allowed participants to have an equal baseline from which results could be measured, which was essential.
3.1.2 ETHICAL CONSIDERATIONS
participants had to be willing volunteers, and sign a consent form showing their awareness of the study. A main consideration in ensuring the ethical collection of data was to ensure all data was anonymised and could not be linked to an individual. Another concern was the potential for nausea/motion sickness when using the driving simulator, and this was explained to all participants before they agreed to the study. No participants noted any such effects.
3.2 RESEARCH PROCEDURE
In this experiment, participants familiarised themselves with a region, then complete tasks which show their spatial understanding of the region. Prior to their arrival in the test room, the participant was assigned to one of two conditions; either the regional condition or the control condition. They did not have knowledge of the other condition until the conclusion of their session, when it was required they were informed in the ethical debriefing information.
Following a short introduction, including ethics information and demographic data collection, participants had 7 minutes to familiarise themselves with the study area. The area had a red boundary line which the participant was instructed not to cross. Should they cross this line anyway they would be immediately directed back into the study area by the tester. Participants in the region condition were also be able to see the polygon outline of each region. Each region was outlined a different colour and there was be a key shown on the iPad for reference. Figure 4 shows the boundary lines between two regions, where the participant would be travelling from Ava Residential Area to Jackson Street Village. This was explained to the participant.
Figure 4: Region boundary lines
(Base map from Google Earth, 2018 imagery)
The participant was instructed to navigate using the arrow keys on the keyboard, and told that moving with the trackpad is also an option should they want to speed up, however they should take the time to pay attention to buildings and landmarks. Arrow keys should also be used for more precise turns. Within the virtual environment, participants were actively learning as they were driving, and controlling the simulator independently, while following the instructions.
Following the familiarisation phase, participants were reset to the starting position to follow a pre-defined route. The purpose of this was to ensure they have encountered the landmarks used in the test phase. In this part of the experiment, participants would follow simultaneous written and audio recorded instructions to simulate a realistic navigation system. The test route for the driving task was 4.1 km long (excluding any errors made). It contained 18 navigation instructions at decision points for the control group, with an additional 10 instructions containing
which were passed through at least once. In total, a different region was entered ten times. The regional condition had modified instructions which informed them when they are entering or exiting a region. Once again, the region boundaries were visible to them. The route, overlaid with the regions is shown in Figure 5. A comparison of regional and control instructions is shown in Figure 6. These instructions were presented very minimally so as not to distract participants from their task. Table 1 outlines the complete instructions for the prepared route, with both regional and control variations. Instructions were based on those taken from Google Maps directions, to remain as realistic as possible.
Figure 5: Route map, with regions (Base map from Google Earth, 2018 imagery)
Figure 6: Regional (left) and control (right) instructions, as visible to participants
Finally, the test phase was conducted. The test was made up of five parts. In each part, the participant was dropped at a predefined location and shown an image which they had to navigate to in the fastest way possible. The predefined starting location was the same for each participant within each task, for comparative purposes, however the order in which the participant completed the tasks was randomised through a generator, prior to the participants arrival. This was to minimise learning effects of the group, as participants gained knowledge on the study area as they completed each task. By changing the order, the learning effects varied for each person, thus minimising the group’s bias towards any one task before which there had been more learning opportunities.
These tasks, with shortest routes are shown in Figure 7. The start and end location for Task 1 was within the same region, however participants had not travelled this route before. The next shortest options for completing this task involved going into a second region, then back to the original region. The shortest option for completing Task 2 required passing through three regions, and three regions was the minimum that needed to be travelled through for any route to complete the task. Task 3 required passing through four regions, and Tasks 4 and 5 required passing through two regions. The destination images the participants were shown are in Figures 17-21 of the appendix.
The minimum distances the tasks could be completed in were as follows: Task 1: 0.37 km Task 2: 0.75 km Task 3: 0.62 km Task 4: 0.58 km Task 5: 0.88 km
Figure 7: Task map (Base map from Google Earth, 2018 imagery)
The minimum time to complete each task was not calculated, as this measure was more dependent on the individual completing the task.
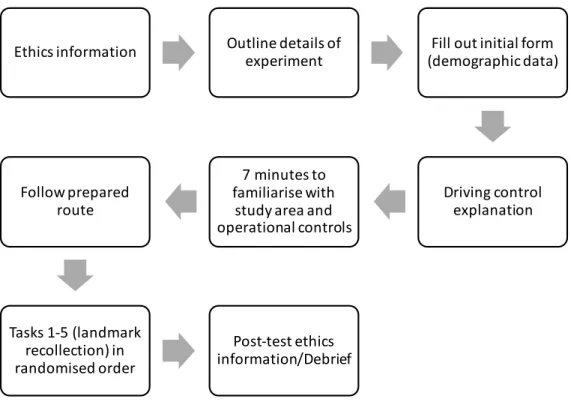
Figure 8 demonstrates the process which the tester went through with the participants.
Figure 8: Process of experimental procedure
Table 1: Navigation instructions for route task
Regional Instructions Control Instructions Distance
You are in the Hutt Recreation Ground area
Head southeast toward Kensington Ave
Head southeast toward Kensington Ave
37m
You are in the Polytechnic District
Turn right onto Kensington Ave Turn right onto Kensington Ave 290m You are in Ava Residential Area
Turn right onto Elizabeth St Turn right onto Elizabeth St 98m Turn left onto Buick St Turn left onto Buick St 81m You are in Jackson St Village
Ethics information Outline details of experiment (demographic data)Fill out initial form
Driving control explanation 7 minutes to familiarise with study area and operational controls Follow prepared route Tasks 1-5 (landmark recollection) in randomised order Post-test ethics information/Debrief
Turn right onto Jackson St Turn right onto Jackson St 400m Turn left onto Richmond St Turn left onto Richmond St 350m You are in Seafront Residential
Area
You are at Petone Beach
Turn right onto The Esplanade Turn right onto The Esplanade 700m Turn right onto Te Puni St Turn right onto Te Puni St 230m You are in the Commercial Area
Turn right onto Annie Huggan Grove
Turn right onto Annie Huggan Grove
130m
Turn left onto Union St Turn left onto Union St 38m Turn left toward Jackson St and
continue through the carpark
Turn left toward Jackson St and continue through the carpark
230m
You are in Jackson St Village At the roundabout, take the 1st exit onto Jackson St
At the roundabout, take the 1st exit onto Jackson St
270m
Turn left onto Sydney St Turn left onto Sydney St 140m You are in Ava Residential Area
Turn right onto Campbell Terrace Turn right onto Campbell Terrace 180m Turn left onto Richmond St Turn left onto Richmond St 400m Turn right onto Udy St Turn right onto Udy St 140m Turn right onto Britannia St Turn right onto Britannia St 300m
Turn left onto Kirks Ave Turn left onto Kirks Ave 85m You are in the Hutt Recreation
Ground area
You have reached your destination You have reached your destination
3.2.1 STUDY CONDITIONS AND MATERIALS
The study was conducted with each participant in the same place. This was a small office room with a single desk, where the participant sat. The tester sat to the right of the participant.
The following hardware was used in the experiment: • MacBook Pro, 13-inch, macOS 10.13.3
o Participant operates following instructions of experimenter
o Screen recording software used to analyse tasks after the participant completes them, however no audio or identifying information recorded.
• iPad Air 2, iOS 11.2.2
o Experimenter operates for route instructions, region key, and task destinations (shown to participant) and data recording (not shown to participant).
The following software was used in the experiment: • Google Earth Pro 7.3
• Microsoft PowerPoint 15.41 • Icecream Screen Recorder
were controlled by the tester who would click through the PowerPoint for the participant to follow. This uses the “Wizard-of-Oz approach” as discussed by Lazar et al. (2017), where the tester is in control of the participant’s interaction with the computer (or in this case, iPad), unbeknown to the participant.
3.2.2 MINIMISING ERRORS AND BIAS
All possible measures were taken to minimise errors and bias in the study. Lazar et al. (2017) explained the potential sources of bias. Table 2 acknowledges and outlines these biases, and presents reduction techniques within the experiment design. Conducting a pilot study also allows any potential errors and risks to be exposed, thus allowing an opportunity to correct these before testing with participants.
Table 2: Biases and error as explained by Lazar et al. (2017) and measures to minimise them within the study
Bias/error sources Minimisation measures
Random errors Random errors are inevitable, thus minimising
systematic errors and bias in other areas is essential. Measurement instrument bias
All equipment including computer software will be checked before each participant arrives. The same equipment will be used each time.
Experimental procedure bias
The experiment will remain consistent for every participant, including participants will receive the same information, and the same script will be followed by the experimenter.
Participant bias
Participants will be representative of the vast user group of navigation devices, and be randomly assigned to the control or test group. They will be in a calm environment with careful explanations. Participants will be required to be unfamiliar with the
study area to allow an equal starting point, and to be proficient in English, to ensure they understand the task.
Experimenter behaviour bias
The experiment will be conducted in a professional manner. No personal relation to the experiment will be expressed by the experimented. A natural script will be followed so participants receive the same information and participant behaviour in tasks will not be commented on. As there is only one experimenter bias as multiple experimenters could behave differently.
Environmental bias
The experiment will take place in the same room for each participant, where there will be no outside distractions, or distractions in the room. Participants will have their phones/other electronics off. The room will be set up the same way for every participant.
3.2.3 DEPENDENT VARIABLES
Multiple measures were taken to analyse the hypothesis. In order to do this, a screen recording was taken of the participant doing the tasks and data was recorded from this after the experiment. This provided accuracy, as measurements could be double checked, and during the experiment full focus would remain on the participant. Task completion rate was calculated to compare between groups for each task. This done by comparing attempted tasks to completed tasks, as not all participants were able to complete each task they attempted. Time and distance data was also taken to compare between groups. Both of these measures were important, as there was no correlation between the two. Some participants navigated slowly but accurately distance-wise, while others navigated quickly around the course but with less thought as to what direction they were going in, thus analysing both of these measures separately was important and relevant.
3.3 PARTICIPANTS
The only requirement for volunteers to be a participant in the study, is that they could not be familiar with Petone, New Zealand, the study area. Volunteers were recruited through personal connections, however none of them had prior knowledge of the project. Overall, 40 participants were tested, 20 in the control group and 20 in the test group. This number was chosen based on an appropriate value for accurate statistical analysis of the results, and because a large difference in conditions was expected, which could be proven with this number of participants. Participants’ demographic information is presented in section 4.1
3.4 PILOT STUDY
A pilot study was conducted with a participant prior to beginning the experimentation. The pilot study test was not recorded and not included in the results. This was done to show any flaws with the experimental design and see how the test would run overall. The pilot study used the region condition, as this contained more instructions and information – the control test was set up identically following the design of the region experiment, so it would contain the same errors, if found.
Several errors arose during the pilot study, highlighting modifications which needed to be made. Two errors were found on the slides for the navigation instructions. These included a slide duplicate, and a slide where no sound was played. It was noted that the participant should be instructed to look away from the screen when their location was being changed by the experimenter at the start of new tasks, else they would see an overview of the study area, which would change their spatial knowledge of the environment. There was one area where the route had to be modified. This involved driving through a side street, where imagery would be lacking depending on the way the participant was oriented. To avoid confusion the route was modified. Finally, the experiment took longer than expected to conduct. It was about 45 minutes for the pilot study. As participants had already
been scheduled and not all could commit to this time, participants will only complete as many tasks they are able to in time they have available. Tasks they did not attempt will not be included and will have no effect on results.
CHAPTER 4: RESULTS
4.1 PARTICIPANT PROFILES
In total, 40 participants took part in the experiment, 20 for each condition. There was an even split of males and females. 13 males were in the test group, and 7 in the control group, as a result of random group assignment. The age of the participants ranged from 19 to 54. The average age of the test group was 28.1, and the control group, 29.5. Only four participants did not regularly use navigation systems for wayfinding, three of whom were in the control group. Raw demographic information can be found in Table 3 of the appendix.
4.2 DATA ANALYSIS
The raw data collected is shown in Table 4 (see appendix). First, an exploratory data analysis was performed on this data in SPSS. This is shown in Table 5 of the appendix. The column names can be interpreted as follows:
First digit: C = Control Group R = Regional Group Second digit: 1-5 = Task number Third digit: T = Time D = Distance
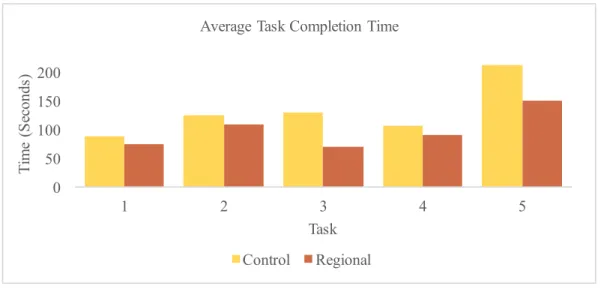
These descriptive statistics provide information on the data range, averages, skewness, and kurtosis. These are explored further through Figures 9-16. Figure 9 shows the average time it took for users in each group to complete tasks (only completed tasks are recorded here). On average, every task the regional group completed was done with a faster average time than that of the control group. The largest difference was in Task 5, where the regional group completed the task an average of 61.84 seconds faster than the control group. Task 3, however showed the greatest difference percentage-wise, with the regional group completing the task an average of 87% faster than the control group.
Figure 9: Average time of completed tasks for each group
Distance measures were taken for each completed task and presented in Figure 10. Again, the regional group performed better, completing each task by travelling a shorter distance, on average, than the control group. These distances were, however, very close together. The greatest difference was in Task 3, where the regional group travelled an average of 0.3 km less to reach the destination.
Figure 10: Average distance of completed tasks for each group
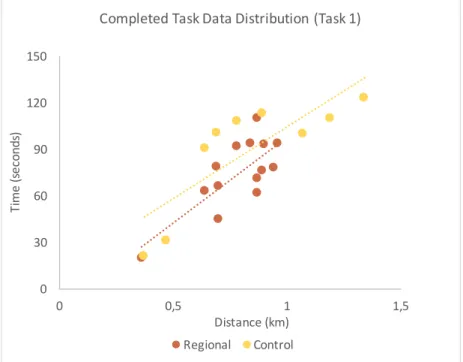
Figures 11-14 provide comparative distance and time measurements of each
0,00 0,50 1,00 1,50 1 2 3 4 5 Di st an ce (k m ) Task
Average Task Completion Distance
Control Regional 0 50 100 150 200 1 2 3 4 5 T im e (S ec onds ) Task
Average Task Completion Time
is consistent with an increase in time, except for within the regional group for Task 3, which shows a slight decrease, however this is likely due to very clustered values. All trends further show patterns first presented in Figures 9 and 10, where the regional group has performed faster and with shorter distances than the control group.
Figure 11: Task 1 data distribution 0 30 60 90 120 150 0 0,5 1 1,5 Ti m e (s ec on ds ) Distance (km) Completed Task Data Distribution (Task 1) Regional Control 0 50 100 150 200 250 0 1 2 3 4 Ti m e (s ec on ds ) Distance (km) Completed Task Data Distribution (Task 2) Regional Control
Figure 13: Task 3 data distribution
Figure 14: Task 4 data distribution 0 50 100 150 200 250 300 350 400 0 0,5 1 1,5 2 2,5 Ti m e (s ec on ds ) Distance (km) Completed Task Data Distribution (Task 3) Regional Control 0 50 100 150 200 250 300 0 1 2 3 4 Ti m e (s ec on ds ) Distance (km) Completed Task Data Distribution (Task 4) Regional Control
Figure 15: Task 5 data distribution
Using SPSS, a Kolmogorov-Smirnov (Lilliefors Significance Correction) test was performed, and showed all tasks, both time and distance for each group, to be normally distributed. All Kolmogorov-Smirnov values were above 0.05, validating the null hypothesis of normality. This allowed independent t-tests to be performed on the data. Almost all of the t-test results presented a value of > 0.05, indicating that at the 95% confidence level, the differences between groups were not statistically significant. Statistical significance was only shown for Task 3, and for the time in Task 5. The p-value for Task 3 distance was 0.031 (assuming unequal variances as presented in the Levene’s Test for Equality of Variances), and for time it was 0.012. For Task 5 (time) it was 0.009, assuming equal variances. This allows the null hypothesis that the groups are equal, to be rejected. At the 95% confidence level, there are statistically significant differences in the average time and distance of completed tasks, for Task 3, and for Task 5 time. Raw data for each t-test is shown in Table 6 of the appendix.
Finally, task completion rates were measured. If participants were unable to find a location to complete a task they could choose to stop. If this happened, the task was
0 100 200 300 400 0 1 2 3 4 Ti m e (s ec on ds ) Distance (km) Completed Task Data Distribution (Task 5) Regional Control
marked as “did not complete” (DNC). Figure 16 shows the differences in completion rates between the control group and the regional group.
Figure 16: Task completion rates for each group
Again, the regional group performed better than the control group, with a higher task completion rate in every task. The largest difference was in Task 4, with a 31% higher completion rate by the regional group. While the smallest difference was in Task 3, where only one person from the control group did not complete the task.
0% 20% 40% 60% 80% 100% 1 2 3 4 5 Completion Rate Ta sk Task Completion Rate Regional Control
CHAPTER 5: DISCUSSION
It appears incorporating regions has made a large difference in being able to complete the task. Overall, the regional group completed 87% of tasks they attempted, while the control group only completed 67% of tasks they attempted. Task completion rate proved to be an interesting measure which could support the incorporation of regions in navigation systems. If an individual were to get lost, or a navigation system were to fail, having prior knowledge of the region they were in and the surrounding regions would allow the individual to have a higher success rate in navigating to their destination.
Overall, however, the results and trends appear to be quite different between groups. Though for seven out of ten task variables, they are not statistically significantly different. A reason for this could be the small sample size combined with the data distribution range. The tasks which showed a significant difference (3 and 5) had higher completion rates, and thus more data points than the other tasks. The completion times showed a larger difference than completion distances. This may be a result of the regional group having more information and therefore being more confident with navigating to their destination, thus travelling at a faster speed to reach it, while the control group were more cautious and explored their options prior to deciding on which path to take. This could indicate that regions were beneficial for participants’ spatial understanding. As this analysis does not include incomplete tasks, the results may change if this was able to be quantified, particularly as there was a large difference in task completion rates.
Results may also be heavily influenced by natural spatial ability. Participants with a more advanced natural ability may be able to complete the task more effectively. Measures to account for this were not taken, but would have been mitigated by the random assignment of participants to each group. All participants recognised the target landmarks for each task, thus landmark recognition issues would not have been a factor in the results.
Incorporating predefined regions into navigation systems could certainly play a useful role, both for users of navigation devices personally, and in industries such as taxi services or delivery drivers. Incorporating regions could help train drivers, who must perform navigation tasks for their jobs every day.
At this point, the null hypothesis,
“Introducing regions to traditional navigation instructions will not allow the user to gain an increased understanding of their environment.”
should not be rejected until further research is done to prove statistical significance, however this research provides a basis for continuing research on the topic.
5.1 THE TASKS
Task 1: This task started at a location that was not in the route taken by participants. It was in the commercial district, as was the target location, however most participants followed a route through Jackson Street Village, with which they were more familiar. Participants in the regional group completed this task an average of 14.17 seconds faster than in the control group, though there was only a 0.04 km difference in the average distance travelled. There was however a large difference in task completion rate. Only 47% of the control group completed the task, which was the lowest completion rate of all tasks, while 78% of the regional group did. This may be due to the region information allowing participants to notice they are in the same region as the target location, and find the location faster. The destination for this task can be seen in Figure 17 of the appendix.
Task 2: This task also started at an unfamiliar location. The shortest way to find the destination was to travel from Ava Residential Area, to the Hutt Recreation Ground, to the Polytechnic District. Three participants in the regional group did this successfully, while none from the control group did, however overall there was only a 0.03 km difference in the groups’ distance averages for this task, the smallest for any task. The route which more participants took went from Ava Residential Area,
District. As discussed in section 5.2, a limitation to the study and within the task may have been the naming of the Polytechnic District, resulting in low completion rates for this task. The destination for this task can be seen in Figure 18 of the appendix.
Task 3: This task had the highest completion rate of all the tasks. Only one person from the control group was unable to complete it. The destination for this task was the boat club, which was along the waterfront. As participants could see it was along the waterfront they were able to locate it once they had navigated to the water. This was the only task with a statistically significant difference between groups for both time and distance. This may be a result of the high number of tasks which could be analysed. This task had the largest difference in average distance travelled between groups, with the regional group travelling 0.3 km less than the control group. The regional group also completed the task an average of 61 seconds faster than the control group. This task started in the Ava Residential Area and required passing through two more regions to reach the destination at Petone Beach. This difference in performance may be due to the regional group’s awareness of the regions in relation to each other. Most participants were able to navigate successfully to the beach, but many turned in the wrong direction once they reached the beach, causing confusion and a longer time and distance to reach the destination. The destination for this task can be seen in Figure 19 of the appendix.
Task 4: This task started in Jackson Street Village, at a location participants had previously been, and ended at the adjacent Commercial Area. This task had the largest difference in completion rates, with 84% of the regional group completing the task, while only 53% of the control group completed the task. Many participants, especially in the control group navigated through several regions before ending in the correct place. The regional group appeared to be more aware of the connections between regions in this task, completing it more efficiently, by travelling through less regions than the control group. This is not reflected in the differences in travel distances as it can still be completed in a similar distance by
travelling through more regions. The destination for this task can be seen in Figure 20 of the appendix.
Task 5: This task had a high completion rate amongst both groups, though the regional group’s rate was still higher with only one person not completing the task (95% completion rate). The control group’s completion rate was 79%. This task began in Seafront Residential Area and ended in the adjacent Jackson Street Village. This task also has the highest difference in average time to complete the task, with the regional group completing it an average of 62 seconds faster than the control group, which was shown to be statistically significant. Most participants in both groups were able to navigate between these successfully, however upon entering Jackson Street Village participants, particularly in the control group, would often turn the wrong way, and spend a lot of time pondering which way to go. Participants had to travel 650 metres down Jackson Street to reach the destination, and it was common for participants to pause and reconsider if they were travelling in the correct direction. The regional group, due to their faster average completion time, showed more confidence in where they were travelling, perhaps due to spatial knowledge of the relations of each region to the others, so they knew which direction to travel in. The destination for this task can be seen in Figure 21 of the appendix.
5.2 LIMITATIONS
While all possible measures were taken to ensure a comprehensive study, some limitations were discovered both in conducting the experiment and in the analysis of the experiment, and are discussed below.
5.2.1 DATA COLLECTION
1. Some participants had time constraints and were only able to provide 30 minutes of their time as testing was done in workplace environment, so people were unable
to partake in all tasks, thus limiting the data collection. As many tasks as possible were completed in the time available to the participant.
2. Google Earth Street View imagery was unable to be downloaded and relied on a strong internet connection, so occasional internet lag issues were faced, however there were no major issues in regard to this for any participant, and time measures were adjusted for this.
3. The number of participants able to be tested was limited based on time constraints to complete the project, and personal access to people. This resulted in a smaller sample size than was anticipated, however valid results were still able to be drawn.
5.2.3 EXPERIMENT DESIGN
1. Using the Wizard-of-Oz approach within HCI can result in human error. The tester had to very accurately change the navigation slides. On a few occasions, a slide was turned too soon or later than preferable, however this would not have had implications on the results.
2. Regions were named based on their features, and the Polytechnic District was named as such because it contained a polytechnic campus. This is a type of tertiary education in New Zealand, however it seemed as if not all participants were familiar with the term, so they were unable to associate the polytechnic (which was the destination for Task 2) as being in this region. Unfortunately, this limitation was not discovered until after testing began, so it was unable to be changed to a more identifiable term.
3. There was no measure to account for natural spatial ability. It became apparent while conducting the experiment that some individuals were naturally more proficient with navigation. This could have been mitigated by incorporating a test for spatial ability at the start of the experiment for each participant, and using these results to normalise the collected data.
5.2.3 ANALYSIS
1. An outlier analysis could have been conducted before analysing the results, and any outliers excluded from the data. However, as these outliers were not random measurement errors or due to experiment design it was decided to keep them in so as to effectively measure all participants results.
2. Completed task times and distances could have been normalised to account for each individual’s spatial ability. This would have provided a more thorough analysis, however including the raw results in this study still provided a sufficient and accurate analysis.
CHAPTER 6: CONCLUSIONS
Following the conduction of a literature review to investigate the current state of navigation systems and their relation to spatial knowledge in users, this study successfully tested spatial knowledge when incorporating regions in navigation systems, compared to that without regions, by simulating a real-world driving environment which allowed for accurate analysis, comparable to that of a real-world driving test. The results only showed a statistically significant difference between groups for three of ten task variables, however this may be due to limitations of the study. There were large differences in task completion rate which should be considered an important finding out of the study, as it may support the inclusion of regions in navigation systems due to the improved ability for individuals to successfully navigate to their destination. While we should not currently reject the null hypothesis, the project provides a lot of potential for further research on the topic.
6.1 FUTURE WORK
There is room for future work within this topic. Further research could collect qualitative data within a similar study to analyse the impact the modified regional instructions had on people, rather than just collecting quantitative data. While conducting the study it appeared as it there would be a lot of valuable information in this type of analysis. A further study in this field could conduct the test in a real-world environment, to see how users interact with the modified instructions of the navigation system.
To develop this idea in a way that incorporates it with previous work, instructions could be minimised by only mentioning regions which the driver is unfamiliar with – the driver could choose their level of familiarity with each region they will drive through, using Ziegler et al.’s (2011) level of instructions to tailor instructions to them. It would teach them about the regions they are unfamiliar with, while
REFERENCE LIST
Aginsky, V., Harris, C., Rensink, R., & Beusmans, J. (1997). Two strategies for learning a route in a driving simulator. Journal of Environmental Psychology, 17(4), 317-331.
Anacta, V. J. A., Schwering, A., Li, R., & Muenzer, S. (2017). Orientation information in wayfinding instructions: evidences from human verbal and visual instructions. GeoJournal, 82(3), 567-583.
Brown, B., & Laurier, E. (2012, May). The normal natural troubles of driving with GPS. In Proceedings of the SIGCHI conference on human factors in computing systems (pp. 1621-1630). ACM.
Burnett, G. E., & Lee, K. (2005). The effect of vehicle navigation systems on the formation of cognitive maps. In International Conference of Traffic and Transport Psychology.
European Commission. (2018). Galileo’s contribution to the MEOSAR system. European Commission. Retrieved 17 January 2018, from http://ec.europa.eu/growth/sectors/space/galileo/sar/meosar-contribution/
European GNSS Agency [EU-GNSS]. (2017). GNSS Market Report. Luxembourg: European Global Navigation Satellite Systems Agency.
Gomarasca, M. A. (2009). Satellite Positioning Systems. In Basics of Geomatics (pp. 341-368). Springer Netherlands.
Gramann, K., Hoepner, P., & Karrer-Gauss, K. (2017). Modified navigation instructions for spatial navigation assistance systems lead to incidental spatial
Han, X., Byrne, P., Kahana, M., & Becker, S. (2012). When do objects become landmarks? A VR study of the effect of task relevance on spatial memory. PloS one, 7(5), e35940.
Hirtle, S. C., & Jonides, J. (1985). Evidence of hierarchies in cognitive maps. Memory & cognition, 13(3), 208-217.
Krainin, M. (2017). Seamless Google Street View Panoramas. Google Research
Blog. Retrieved 25 January 2018, from
https://research.googleblog.com/2017/11/seamless-google-street-view-panoramas.html?m=1
Large, D. R., Burnett, G., Benford, S., & Oliver, K. (2016). Crowdsourcing good landmarks for in-vehicle navigation systems. Behaviour & Information Technology, 35(10), 807-816.
Lazar, J., Feng, J. H., & Hochheiser, H. (2017). Research methods in human-computer interaction. Morgan Kaufmann.
Leshed, G., Velden, T., Rieger, O., Kot, B., & Sengers, P. (2008, April). In-car gps navigation: engagement with and disengagement from the environment. In Proceedings of the SIGCHI Conference on Human Factors in Computing Systems (pp. 1675-1684). ACM.
Lynch, K. (1960). The image of the city (Vol. 11). MIT press.
Münzer, S., Zimmer, H. D., Schwalm, M., Baus, J., & Aslan, I. (2006). Computer-assisted navigation and the acquisition of route and survey knowledge. Journal of environmental psychology, 26(4), 300-308.
Parush, A., Ahuvia, S., & Erev, I. (2007, September). Degradation in spatial knowledge acquisition when using automatic navigation systems. In International