CUSTOMER PROFITABILITY ANALYSIS:
SPECIFICATION OF INDICATORS AND
IMPROVEMENT OF PROCEDURES FOR DATA
COLLECTION
TOMÉ JORGE QUADROS FLORES GONÇALVES
MASTER THESIS PRESENTED
TO THE FACULTY OF ENGINEERING OF THE UNIVERSITY OF PORTO IN INDUSTRIAL ENGINEERING AND MANAGEMENT
Customer Profitability Analysis
Specification of indicators and improvement of procedures for data collection
Tomé Jorge Quadros Flores Gonçalves
Master Thesis
Supervisor at FEUP: Prof. Ana Maria Cunha Ribeiro dos Santos Ponces Camanho
Faculty of Engine ering of the Unive rsit y of Porto Integrated Master in Industrial Engineering and Management
This thesis aims to improve the Customer Profitability Analysis performed at Amorim Deutschland. Firstly, the indicators used to measure such profitability were specified and given a critical assessment. Afterwards, some problems and opportunities for improvement were identified. Namely, the methodology by which data is collected to serve as input for the Customer Profitability Analysis was identified as being too manual and time consuming. The focus was thus set upon improving the accurateness and accessibility of this data. At a more detailed level, this involved redesigning the financial dimensions of the Chart of Accounts and defining procedures related to the input of data in the ERP system.
The results achieved include a new structure of the dimensions of the Chart of Accounts and a clear definition of procedures for the input of data in the ERP system. These measures were able to improve the level of discipline of data collection to perform the Customer Profitability Analysis and also achieve a more logical organization of data in the ERP system. Finally, some theoretical values were used in calculations for the Customer Profitability Analysis whereas now the real values can be retrieved from the system, thus increasing the accurateness of the affected indicators.
To my supervisor at Amorim Deutschland, Dr. André Lino Barbosa, for sharing his valuable experience and helping me beyond his responsibilities.
To my supervisor at the Faculty of Engineering of the University of Porto, Professor Ana Camanho, for the advice and assistance provided throughout the project.
To my family and friends, for the constant support and motivation.
To the Erasmus Internship program, for granting me a scholarship and giving me the opportunity to enjoy this enriching experience abroad.
Contents
1 Introduction ... 6
1.1 Presentation of Amorim Deutschland ... 6
1.1.1 Mission, Vision and Values of Amorim Revestimentos ... 7
1.2 Presentation of the Company ... 7
1.3 Brief Description of the Project ... 8
1.4 Methodology Used ... 9
1.5 Structure of the Thesis ... 9
2 Theoretical background ... 10
2.1 Management Control ... 10
2.2 Customer Profitability Analysis ... 10
3 Current situation and main problems ... 13
3.1 Business overview ... 13 3.1.1 Departments ... 13 3.1.2 Products ... 13 3.1.3 Customers ... 13 3.1.4 Brands ... 14 3.1.5 Suppliers ... 15 3.1.6 ERP system ... 15
3.2 Customer Profitability Analysis ... 16
3.2.1 Definition of customer ... 16
3.2.2 Business agreement ... 16
3.2.3 Indicators ... 16
3.2.3.1 Gross and net profit margin ... 17
3.2.3.2 Sales volume ... 17 3.2.3.3 Cost of sales ... 18 3.2.3.4 Discounts ... 18 3.2.3.5 Bonuses ... 18 3.2.3.6 Transport costs ... 18 3.2.3.7 Advertising costs ... 19 3.2.3.8 Handling costs ... 19 3.2.3.9 Credit insurance ... 19 3.2.3.10 Cost of capital ... 19
3.2.3.11 Number of stores ... 19
3.2.3.12 Number of orders and average order size ... 20
3.2.3.13 Customer satisfaction ... 20
3.3 Conclusion of the chapter ... 21
4 Suggestions of improvement and developed prototypes ... 22
4.1 Chart of Accounts ... 22
4.2 Levels of the Chart of Accounts ... 22
4.3 List of Dimensions ... 22
4.3.1 Dimensions with status “blocked for all purposes” ... 23
4.3.2 Dimensions with no recent transactions ... 23
4.3.3 Dimensions named “N/A” ... 24
4.4 Problems of the List of Dimensions ... 24
4.4.1 Level 1: Functional Area ... 24
4.4.1.1 Dimensions N/A ... 25
4.4.1.2 Dimensions B: Sales Back Office ... 25
4.4.1.3 Dimensions C: Marketing & Sales... 25
4.4.1.4 Dimensions G: General Administrative Support ... 26
4.4.1.5 Dimensions I: Information Flow ... 26
4.4.1.6 Dimensions L: Logistics and Stock Management ... 27
4.4.1.7 Dimensions S: Sales Force ... 28
4.4.1.8 Dimensions T: Technical Assistance ... 29
4.4.2 Level 2: Country ... 30
4.4.3 Level 3: Item Group ... 30
4.4.4 Level 4: Line of Business ... 30
4.4.5 Level 5: Miscellaneous ... 34
4.5 Conclusion of the chapter ... 35
5 Conclusions and future work ... 36
References ... 37
Annex A: Customer Satisfaction Survey ... 38
Annex B: Changes to List of Dimensions of Level 1 ... 41
Annex C: Changes to List of Dimensions of Level 4 ... 48
Annex D: Changes to the List of LoB ... 51
Annex E: Procedure to classify transport costs in the ERP system ... 56
s
List of Acronyms
ACC – Amorim Cork Composites ADE – Amorim Deutschland AFA – Amorim Flooring Austria AR – Amorim Revestimentos
ARDEL – Amorim Revestimentos Delmenhorst AWS – Amorim Wood Supplies
B2B – Business-to-business
CAP – Customer Account Profitability CPA – Customer Profitability Analysis DIY – Do-It-Yourself
ERP – Enterprise Resource Planning IT – Information Technology
List of Figures
Figure 1 – Global structure of Amorim Revestimentos ... 6 Figure 2 – Organogram of Amorim Deutschland ... 8 Figure 3 – Volume of transaction per parent dimension of level 4 ... 33
List of Tables
Table 1 – The 5 levels of the Chart of Accounts ... 22
Table 2 – Sample of the List of Dimensions ... 23
Table 3 – Parent dimensions of level 1 ... 24
Table 4 – Dimensions of level 1 under parent dimension B ... 25
Table 5 – Dimensions of level 1 under parent dimension C ... 25
Table 6 – Dimensions of level 1 under parent dimension G ... 26
Table 7 – Dimensions of level 1 under parent dimension I ... 27
Table 8 – Dimensions of level 1 under parent dimension I: old and new version ... 27
Table 9 – Dimensions of level 1 under parent dimension L ... 28
Table 10 – Dimensions of level 1 under parent dimension L: old and new version ... 28
Table 11 – Dimensions of level 1 under parent dimension S ... 28
Table 12 – Dimensions of level 1 under parent dimension T ... 29
Table 13 – Dimensions of level 1 under parent dimension T: old and new version ... 29
Table 14 – Percentage of the volume of transactions per country... 30
Table 15 – Parent dimensions of level 4... 31
Table 16 – Dimensions of level 4 under parent dimension M... 32
1 Introduction
As part of the study plan of the Integrated Master in Industrial Engineering and Management (MIEIG, in Portuguese) at the Faculty of Engineering of the University of Porto, the author developed a curricular project with the duration of 5 months, at the facilities of Amorim Deutschland, in Delmenhorst, Germany. The main goal of the project was to improve the way the company performs the Customer Profitability Analysis, focusing on the optimization of the financial dimensions of the Chart of Accounts, including the update and redesign of the dimensions and the improvement of procedures related to the input of data in the ERP system.
1.1 Presentation of Amorim Deutschland
Amorim Deutschland (ADE) is a distribution unit of Amorim Revestimentos (AR), whose purpose is to serve the markets of Germany and Austria. Its headquarters are located in Delmenhorst, Germany. ADE has no production facilities, focusing only on the warehousing of finished goods that are produced in Portugal. All articles exported to those markets are registered in the books of ADE, but not every article goes through the step of being stored at its warehouses. Some skip warehousing altogether and are shipped from Portugal directly to the customer. This happens mostly with big orders, when local stock is insufficient to meet demand and/or additional production is required.
The parent company Amorim Revestimentos is a manufacturing company that produces floor and wall coverings with the use of cork as the unifying theme. The production is carried out at two plants in the northern region of Portugal: S. Paio de Oleiros and Lourosa. The company has a global reach and sells across many markets, either supported by a local distribution unit or shipping directly from Portugal, with a total sales volume of 122 million euros in 2013. The global structure of AR is presented in Figure 1.
1.1.1 Mission, Vision and Values of Amorim Revestimentos
The mission of Amorim Revestimentos is to be a global flooring-player, using CORKTECH as the key differentiation factor.
The vision of Amorim Revestimentos is to be a profitable and innovative flooring company, with a positive and winning attitude.
The core values of Amorim Revestimentos are:
Integrity/Transparency – The relationship between us are characterized by values of honesty. This honesty is reflected on the assertiveness, frontality and truth that we use to communicate and present out ideas and opinions.
Diversity – At Amorim Revestimenros coexist different cultures. Maintaining corporative values, we integrate the very best of each of these cultures to augment our potential.
Loyalty – We do everything that we say we will do, even if we have to renounce to individual interests on the behalf of the global goal.
Example – Our behavior reveals who we are. Everything that we ask to be done is always something that we do ourselves and that goes in compliance with the company’s rules.
Solidarity – We support each other mutually and together we exceed the adversities. We respect Nature and take an active role on society supporting humanitarian causes.
Cooperation – Our door is opened to collaborators, the clients and suppliers. We want our partners’ help so that we can be better on the solutions that we give them.
1.2 Presentation of the Company
Amorim Deutschland employs around fifty people. The company has three main areas: Sales & Marketing, Logistics and Finance. The most important department for this project was Finance. This department is headed by the Finance Manager, responsible for Finance and Management Control. Bookkeeping and “EDP/BaaN” are also part of the Finance department. EDP stands for Electronic Data Processing and BaaN is the name of the ERP system. This department is responsible for the maintenance of the information system as well as the making of reports and statistics. The organogram of Amorim Deutschland is presented in Figure 2.
Figure 2 – Organogram of Amorim Deutschland
The production of a Customer Profitability Analysis requires a strong involvement of the “EDP/BaaN” department. They extract most of the needed input from the ERP system and manually compile extra data from other sources.
1.3 Brief Description of the Project
With the increased customer focus required to be competitive in today’s marketplace, the company feels the need to improve the quality of its Customer Profitability Analysis, so that better decisions can be made regarding its customer base. The company realized that the indicators were not as accurate as they could be and the methodology for data collection was too manual and time consuming. An outdated ERP system was part of the problem, but despite this limitation, room for improvement still existed.
As a result, the management of Amorim Deutschland decided that the whole structure that supports the production of the Customer Profitability Analysis needed to be updated and revised. The author, together with the Finance department, conducted an analysis of what could be changed and defined an action plan towards the achievement of this goal. Ultimately, the purpose of this project was to implement a consistent structure that would yield an easy-to-produce and better-quality Customer Profitability Analysis.
1.4 Methodology Used
The project started with an introductory phase that meant spending a designated time with each department in order to acquire a better understanding of how the firm operates internally and conducts business with customers. At this point, the project was not yet fully defined, though guided by a concern to seek improvement potential in the area of Management Control. Once at the Finance department, it was noticed that the Customer Profitability Analysis took a lot of manual effort to be calculated and that a few not necessarily reasonable assumptions were made. Following this observation, a careful look into everything involving the Customer Profitability Analysis took place. The indicators used to understand the profitability of a client were reviewed, the process of calculation of those indicators was analyzed and the factors that justified the current situation were understood. The problem was identified as being partly rooted in the outdated and suboptimal system of classification of transactions through the financial dimensions of the Chart of Accounts and the associated flawed procedures for the input of data in the ERP system. To solve this, it was necessary to look deeper into what and how transactions were classified with each financial dimension. After having a general overview of the conceptual logic underlying the classification system, the model was refined towards greater consistency and structural logic. The inner workings of the ERP system and the procedures that represent the input of data in the system were studied when exploring a potential change, acknowledging the existing links and the fact that a solution has to address the business realities of the firm. Finally, the solution was implemented with the involvement of the affected departments.
1.5 Structure of the Thesis
This thesis is organized in 5 chapters, supported by 6 annexes.
In this chapter are presented the company, the section of the company where the project took place, a brief description of the project and the methodology used in the project.
In chapter 2 is given a theoretical background about Management Control and the Customer Profitability Analysis.
In chapter 3 is presented the current situation regarding the performance of the Customer Profitability Analysis and the main problems. A business overview is given explaining the departments of company, the products that are sold, the customers of the company, the brands used on the products, the suppliers of the company and the ERP system. The indicators used to assess the profitability of the customers are specified, as well as how they are calculated. Finally, the problem of focus is selected.
In chapter 4 are presented some suggestions of improvement and the developed prototypes, regarding the selected problem.
In chapter 5 are presented the global conclusions of the project as well as some proposals of future work.
2 Theoretical background 2.1 Management Control
The concept of Management Control has been defined in many different ways. Mockler (1970) defined Management Control as a systematic effort by business management to compare performance to predetermined standards, plans, or objectives in order to determine whether performance is in line with these standards and presumably in order to take any remedial action required to see that human and other corporate resources are being used in the most effective and efficient way possible in achieving corporate objectives.
In order to make this comparison between desired performance and actual performance, the latter must be somehow measured, even if the quality of that measurement is not the highest possible. According to Spitzer (2007), everything that should be measured can be measured in a way that is superior to not measuring them at all. In fact, if we demand that measures be immediately objective, quantifiable, and statistically reliable, then we are ruling out most emergent and potentially transformational measures.
“What you can’t measure, you can’t manage”. This widely accepted aphorism states the importance of measurement and seems to imply that a good measurement system is necessary for successful management and thus the achievement of high performance.
2.2 Customer Profitability Analysis
During the 1980’s, as companies were trying to look for ways to fight competition and stay ahead of the curve, customer satisfaction assumed greater importance. With the help of computers, the tracking of costs became easier to apply and new possibilities of analysis emerged. Costing methods such as activity based costing were shedding new light upon this subject and helping management take better decisions. As the 1990’s arrived, customer profitability was already considered just as important as product profitability. Management should not decide to discontinue production of a certain product based solely upon its profitability, since it may be the case that it attracts customers that are profitable on other products. This fact calls for the need to analyze profitability of the customer, acknowledging that resources are used by customers as well as products (Howell and Soucy 1990). Examples that support this are:
Volume discounts
Commissions
Sales support
Inventory and distribution support
Inventory holding requirements
Freight policies
Credit and collection support
Accounts receivable
Order entry and customer support
Field service
These costs vary from customer to customer and may be responsible for significant differences in profitability between them. They generally fall into the category of selling, general and administrative expenses. It is important to assign them correctly to the customers that are
over cost. Resource Costing does exactly that by assigning the revenues, expenses, assets and liabilities of the company to the customers that are ultimately their cause. Costs can be separated according to their relation to the company’s value chain: product development, manufacturing, distribution and sales/marketing. Howell and Soucy (1990) suggest six steps to accomplish this: 1. The costs associated with product development and manufacturing are assigned to the
products and the customer is then charged according to the purchased product mix. 2. Those costs associated with distribution and sales/marketing that can be directly
identified with the customer are also assigned.
3. Resources used by activities that support the customer are identified.
4. Those resources are then assigned to customers, markets or channels of distribution depending on which degree of detail is possible.
5. Activities that drive the costs are used as the basis to assign costs to customers. When it’s not possible to directly assign costs to either customers, markets or channels of distribution, they are still assigned using the best possible cost driver.
6. Finally, the costs that are still assigned to markets or channels of distribution are reassigned to customers using suitable cost drivers.
Assigning costs following these steps provides information to the company that can be used to better allocate resources by investing more in profitable customers, giving away structurally unprofitable customers to competitors and cutting costs on customers that can become profitable. The companies that correctly understand the relationship between customers and costs are better positioned to differentiate themselves from competition on the service that they provide to customers.
As a greater focus on the customer gained wider acceptance, the concept of Customer Account Profitability (CAP) started to emerge. Recognizing that each unit of revenue does not contribute equally to net income, CAP provides a way of analyzing customer sales to determine if doing business with a particular customer represents a profitable endeavor. Foster, Gupta et al. (1996) point out three features as key to this approach:
1. Costs are assigned to individual customers (not products, services or departments); 2. The level of analysis can be set on a particular customer or a large group of customers; 3. The lens is shifted from a single product sold to multiple customers to multiple products
sold to a single customer.
This approach provides management with a better understanding of costs that are specific to customers, therefore setting the foundation for decisions regarding which customers to target. These customer specific costs are mostly downstream costs related to customer service, marketing and distribution. However, differences of profitability between different customers can also be due to differences in revenue, through differences in the price that is effectively charged. This happens when discounts are awarded to certain customers, often without a good economic reason, disregarding profitability in favor of short-term revenue goals. A rationale that makes more economic sense is to offer lower prices to customers that require less usage of downstream functions (Foster, Gupta et al. 1996).
The degree of focus that is used with CAP is a function of the characteristics of the firm’s customer base. Ideally, the company would be able to capture data and look directly at the profitability of individual customers, but this is only feasible in practice if the total sales volume
is concentrated around a few big clients. If that is not the case, then the cost of capturing data for individual customers would outweigh the advantages provided by the extra detail. The solution in this case is to group clients that share certain characteristics deemed relevant to define different policies based on the result of the analysis (Foster, Gupta et al. 1996).
Foster, Gupta et al. (1996) suggest that other issues have to be addressed and that those are key to a successful analysis of customer profitability. These may represent obstacles or possible causes of inferior results that can lead to wrong conclusions and mistaken decision making. Firstly, the company must have a system of measurement that gathers the needed data for the analysis. If the input is inadequate, one cannot expect to achieve a satisfactory output. An information system that comprises the correct tools to accumulate the data that is necessary to create reliable customer revenue and cost figures is absolutely fundamental. Secondly, possible future downstream costs of customers must not be overlooked, namely the potential for environmental and litigation costs that could severely affect profitability. An effort should be made towards a reasonable estimation of these costs, avoiding the simplistic approach of assuming that they will not exist. Thirdly, the analysis on customer profitability is not complete without an assessment of how the figures will evolve over time. A static interpretation would be deficient, since a currently unprofitable customer may be worth pursuing if management can anticipate that he will be profitable in the long run. Finally, enough thought and research must be devoted towards selecting the most plausible drivers of customer costs.
Porter (1996) explains that a company can outperform rivals only if it can establish a difference that it can preserve. It must deliver greater value to customers or create comparable value at a lower cost, or do both.
This justifies an increased corporate focus on customers and their profitability with respect to:
Understanding and analyzing customer profitability;
Maintaining and increasing customer profitability;
Turning unprofitable customers into profitable ones.
Expanding global competition is one reason behind the increased concern for customer profitability. Companies worldwide are being pressured to become more customer focused and to increase shareholder value. Customer profitability analysis is a useful tool in both areas (Epstein 2002).
3 Current situation and main problems
In this third chapter, the Customer Profitability Analysis (CPA) is presented and its main problems are identified. To properly address the issues surrounding the CPA, it is important to have a general understanding of the business. For that purpose, this chapter starts with an introduction to the company’s departments, products, brands, customers and suppliers, as well as the ERP system.
3.1 Business overview
In this section, an overview of the business is presented. A brief summary is given about the different departments of the firm, the products that the company sells, the customers to which they are sold, the brands used to target different customers and the suppliers of products and services. The ERP system used at the company is also presented.
3.1.1 Departments
For a visual representation of the structure of Amorim Deutschland, the organogram of the company presented in Figure 2 must be recalled. At the top, the company is directed by the Board of Directors. The Board of Directors has three members, but only two work at ADE on a daily basis. Those two are called Managing Directors. As stated before, the company has three main areas: Sales & Marketing, Logistics and Finance. Sales & Marketing holds Marketing, Product Management and Technical Customer Service, as well as the Sales Force, organized around different geographical areas and types of customers. Logistics holds the Back Office, the Purchase department and the Warehouse and Forwarding department. Finance holds Bookkeeping and the IT/Statistics department.
3.1.2 Products
Amorim Deutschland is a distribution unit of Amorim Revestimentos. As such, the company does not produce any of the products that it sells. Most of the production comes from the parent company, with only a few exceptions. The main groups of products are cork floor coverings, cork wall coverings and wood flooring. The cork floor coverings can be further divided into cork visuals, real wood visuals, vinyl visuals and digital printing visuals. Regarding the wood flooring, it is worth mentioning that this is a trade product i.e. the finished goods are bought from an external supplier and resold without any modification. The reason for its inclusion in the product mix has to do with the need to serve the market with a wider product offering. The products will be further described in the section about brands, since it is easier to present them after the customers have been introduced.
3.1.3 Customers
In general, Amorim Deutschland does not sell to the end user. ADE sells to companies that, in turn, sell to the end user.
The customers are grouped into so-called lines of business that represent different distribution channels. The main lines of business are retail, wholesale, wood distribution, do-it-yourself (DIY), business-to-business (B2B) and contracting.
The retail and wholesale clients are mostly dedicated to decoration, although some deal exclusively with flooring. The retailers sell to the end user and the wholesalers sell to other
businesses, but the distinction is not always a clear one. They generally strive for a premium shopping experience, with good customer support and complementary services.
The wood distribution describes a group of clients whose focus is on wood products. There are many stores with this concept and they tend to sell not only flooring but also doors, windows, fences, benches and the like.
DIY stands for do-it-yourself and the name gives a good idea of the underlying concept of this group of clients. This line of business is characterized by stores that look like warehouses. The end user is expected to shop for himself with minimal help. The priority is placed upon low cost and product availability. The store aims to have every product on stock so that the customer can immediately take everything he needs without having to place orders for additional material. B2B stands for business-to-business and the clients that belong to this distribution channel tend to be manufacturing companies that are interested in a component of a product or in a product that is not complete i.e. they buy mostly unfinished goods from ADE. Examples include a company that only wants a component from ADE to build into their own product or a company that wants an unfinished product of ADE to which he adds his own customization. It is also possible that a company wants to buy finished goods from ADE to have a wider product offering.
The contracting clients are considered those that buy products from ADE for a particular project, namely in the context of the construction of a new building or the opening of a new store. In this case, the client can either be the actual end user (hotel chains, supermarkets, etc.) or the firm that installs the products for the end user.
3.1.4 Brands
Some of the main brands used to sell products to the German and Austrian markets are Wicanders, CorkLife (and DecoLife), Ipocork and Go4Cork. There are also some business agreements that allow the customer to use his own brand on the product. Such is the case with some big customers like Holzland. Their private label is HQ.
Wicanders is the premium brand and is directed towards the retail market. There is a brochure for the “Comfort Flooring Collection” and a separate one for “Parquet”. The former has all the products that use cork and the latter has only wood flooring (that includes no cork at all). The technical details of the products is out of the scope of the present work, but it is nevertheless adequate to have a general idea of the product offering and the main distinctions between types of products.
The “Comfort Flooring Collection” comprises the following types of products.
Artcomfort: the floor can imitate the look of wood, stone or theoretically any other pattern, since the visible layer is a printed cork sheet.
Corkcomfort: the visible layer is a thin sheet of high quality cork that can be treated to assume different colours. There are two versions of the floor. The floating version means that the floor can be easily installed on top of the existing surface, whereas the glue-down version requires the floor to be glued to the existing surface, which usually implies professional assistance to make sure conditions are appropriate.
Vinylcomfort: layers of vinyl ensure greater durability while imitating the looks of other materials, such as wood or stone.
Dekwall: comprises the products meant to be applied on the wall.
Accessories: includes products such as glue, varnish and tool kits.
The “Parquet” brochure shows all the different kinds of wood floors that are available. In addition, some accessory products are also displayed.
The other brands have a smaller offering that consists of a selection of the products sold with premium brand Wicanders, though the brand Go4Cork also features a few exclusive products. A small explanation follows as to the reason of existence of the several brands. A deep brand strategy discussion is beyond the scope of this work, so only an overview is presented.
Wicanders sells the most comprehensive catalog of products and is directed towards the retail and wholesale markets. It is the only brand that also sells wood parquet.
Ipocork comprises a smaller product offering and is only available at wood distribution stores. The main reason for the existence of this brand is to allow for competition between neighboring stores of retail/wholesale and wood distribution, instead of having them advertise the same brand.
CorkLife and DecoLife are solely destined for the do-it-yourself business (DIY). CorkLife has the cork products and DecoLife has the vinyl products.
Go4Cork started as a brand aimed at selling products with low turnover at discounted rates. There is no permanent catalog for this brand and the number of products on offer is very low (around 10 products at any given time). Later, the concept of the brand was somewhat redefined to stand out as a low-cost collection within Wicanders, presented as “Go4Cork by Wicanders”.
3.1.5 Suppliers
The main supplier of Amorim Deutschland is Amorim Revestimentos. The parent company produces almost all of the products under offering. One exception is wood floorings. As mentioned before, this range of products is imported from external suppliers to the company’s warehouse. As for marketing products such as samples or catalogs, some come from AR whereas others are sourced locally. Accessory products and secondary materials are bought from a variety of suppliers.
ADE outsources the transportation of goods. This service is provided almost exclusively by one company. Other companies are used only for exceptional cases.
3.1.6 ERP system
BaaN is the name of the ERP (Enterprise Resource Planning) software used at ADE. The product bares the name of the company responsible for its development, which in turn bares the name of its founder. The BaaN Corporation was founded in the Netherlands in 1978 by Jan Baan. It was sold in 2003 amid financial difficulties. The version used at ADE dates back to the 80’s and has suffered a great deal of customization. Technical support for this system is granted by OSI, a company owned by the Amorim Group.
The fact that the system is outdated proves to be a source of inefficiencies. Modern ERPs have the ability to perform certain analyses in a user-friendly way. BaaN forces the execution of many potentially unnecessary steps in order to achieve the same results. The production of
statistics reports requires the extraction of data from BaaN and the processing of that data using programs such as Microsoft Access and Microsoft Excel.
3.2 Customer Profitability Analysis
The Customer Profitability Analysis (CPA) is an important tool for the company as it provides useful information to evaluate the profitability of customers and make business decisions based on that information.
3.2.1 Definition of customer
To be able to conduct a CPA, it is necessary to define what is considered to be the “customer” i.e. the level of aggregation of the analysis. Sometimes it makes sense to group several “customers” because they belong to the same owner or they have the same business agreement. The customers of ADE make up a reality that is not entirely easy to understand. Some customers belong to a “purchase organization” that negotiates business conditions with ADE on their behalf. Some customers belong to a “marketing association” that defines their product mix. In addition, ownership relationships must be considered on top of these other agreements. These factors make the decision of what to consider a “customer” not always an easy one. The most important criteria is the business agreement. If the commercial terms of the business agreement of a group of customers are negotiated together as a group, it usually makes sense to consider them as a group and perform the analysis at that level of aggregation. However, if one of those customers represents a significant sales volume, then it may be relevant to separate the customer from the group and perform the analysis on that customer separately.
3.2.2 Business agreement
Business agreements are negotiated with ADE by large customers. Some smaller customers leverage their collective negotiating power by joining a “purchase organization” that negotiates a business agreement on their behalf. The business agreement specifies payment conditions, bonuses and other commercial terms. The payment conditions refer to cash discounts that are provided if the payment is received within a given time frame. The bonuses refer to amounts that are paid on a yearly basis as a function of the sales volume reached during that year. Other commercial terms may include a payment for each new store opened by the customer and a threshold on sales volume above which marketing materials such as samples or displays are free.
3.2.3 Indicators
A number of indicators are used to assess the profitability of a customer. The most obvious one is the profit margin, in absolute and relative terms. To calculate the profit margin of a customer, it is necessary to know several other indicators. The formula is presented in the next point. The profitability of a customer cannot be fully understood by looking solely at the profit margin. Other indicators are used to paint a better picture of the current situation of the customer as well as its future potential. Among these indicators are the number of stores, number of orders and average order size, in addition to the indicators that are used to compute the profit margin. A customer satisfaction survey is periodically sent to customers. Despite being a source of useful information with important links to present and future profitability, it is not given a lot
3.2.3.1 Gross and net profit margin
The first indicator that is calculated is the gross profit margin of the customer. This is simply the difference between the sales volume and the cost of sales for a given customer. In other words, it’s the sum of the differences between the selling prices and the purchase prices of all the different products that are sold to a given customer. Since most products are bought from the parent company, the purchase price is usually the transfer price. The gross profit margin can be presented in absolute or relative value. The formulas are shown below.
𝐺𝑟𝑜𝑠𝑠 𝑝𝑟𝑜𝑓𝑖𝑡 𝑚𝑎𝑟𝑔𝑖𝑛 = 𝑆𝑎𝑙𝑒𝑠 𝑣𝑜𝑙𝑢𝑚𝑒 − 𝐶𝑜𝑠𝑡 𝑜𝑓 𝑠𝑎𝑙𝑒𝑠
𝐺𝑟𝑜𝑠𝑠 𝑝𝑟𝑜𝑓𝑖𝑡 𝑚𝑎𝑟𝑔𝑖𝑛 (%) = 𝐺𝑟𝑜𝑠𝑠 𝑝𝑟𝑜𝑓𝑖𝑡 𝑚𝑎𝑟𝑔𝑖𝑛
𝑆𝑎𝑙𝑒𝑠 𝑣𝑜𝑙𝑢𝑚𝑒 × 100
The second indicator that is calculated is the net profit margin of the customer. This indicator is calculated every 3 months. The net profit margin is computed by subtracting a number of indicators from the gross profit margin. The theoretical goal is to come as close as possible to the ideal situation where all the costs of the company are properly assigned to customers. In practice, it is not possible to meaningfully assign some costs to customers e.g. wages of general staff. Management believes that more important than assigning every possible cost to customers is to have a consistent indicator that is comparable between customers and across different periods of time. This means that the net profit margin of the customer must be computed in the same way for every customer and changes to the formula should be avoided. As a side note, the exercise of calculating the most accurate value of net profit margin of a customer was done previously with help from one of the big four accounting firms. Management found that the approximate calculation of this indicator is strongly correlated to the “real” value i.e. if a customer is very profitable according to one method, he is also very profitable according to the other method. One thing that is kept in mind is the fact that the computed value is always an overestimation, given that not all costs are assigned. The net profit margin can be presented in absolute or relative value. The formulas are shown below.
𝑁𝑒𝑡 𝑝𝑟𝑜𝑓𝑖𝑡 𝑚𝑎𝑟𝑔𝑖𝑛 = 𝐺𝑟𝑜𝑠𝑠 𝑝𝑟𝑜𝑓𝑖𝑡 𝑚𝑎𝑟𝑔𝑖𝑛 − 𝐷𝑖𝑠𝑐𝑜𝑢𝑛𝑡𝑠 − 𝐵𝑜𝑛𝑢𝑠𝑒𝑠 − 𝑃𝑟𝑜𝑣𝑖𝑠𝑖𝑜𝑛𝑠 − 𝑇𝑟𝑎𝑛𝑠𝑝𝑜𝑟𝑡 𝑐𝑜𝑠𝑡𝑠 − 𝐴𝑑𝑣𝑒𝑟𝑡𝑖𝑠𝑖𝑛𝑔 𝑐𝑜𝑠𝑡𝑠 − 𝐻𝑎𝑛𝑑𝑙𝑖𝑛𝑔 𝑐𝑜𝑠𝑡𝑠 − 𝐶𝑟𝑒𝑑𝑖𝑡 𝑖𝑛𝑠𝑢𝑟𝑎𝑛𝑐𝑒 − 𝐶𝑜𝑠𝑡 𝑜𝑓 𝑐𝑎𝑝𝑖𝑡𝑎𝑙 𝑁𝑒𝑡 𝑝𝑟𝑜𝑓𝑖𝑡 𝑚𝑎𝑟𝑔𝑖𝑛 (%) = 𝑁𝑒𝑡 𝑝𝑟𝑜𝑓𝑖𝑡 𝑚𝑎𝑟𝑔𝑖𝑛 𝑆𝑎𝑙𝑒𝑠 𝑣𝑜𝑙𝑢𝑚𝑒 × 100
In the next few points, the indicators used in the computation of the net profit margin of the customer are given individual attention: sales volume, discounts, bonuses, transport costs, advertising costs, handling costs, credit insurance and cost of capital.
3.2.3.2 Sales volume
The sales volume of a customer is a very important indicator. This indicator is used as criteria to define different policies related to customer service, as well as other customer related decisions. Management acknowledges that more important than looking at the current sales volume is focusing on the future sales volume. This makes more sense, implying that the
priority is given to future profitability, which is of greater relevance than current profitability. The classification of customers based on this indicator is divided in 5 levels according to specific thresholds of sales potential:
Classification A: sales potential > 80 k€
Classification B: 40 k€ < sales potential < 80 k€
Classification C: 12.5 k€ < sales potential < 40 k€
Classification D: 5 k€ < sales potential < 12.5 k€
Classification E: sales potential < 5 k€
One of the uses of this indicator is to define the frequency with which the sales force visits different customers. The estimate of the potential sales volume is given by the sales representative in charge of the respective customer, based on his personal assessment.
3.2.3.3 Cost of sales
One limitation of the CPA is the reliance on transfer prices for the cost of sales. Although this results in a correct assessment of profitability at the level of ADE, it fails to provide the overall profitability at the level of the parent company AR. This is the case because transfer prices hide the margin that the parent company AR has when it sells the products to ADE.
3.2.3.4 Discounts
Discounts include commercial and cash discounts. Customers that buy large volumes are awarded a commercial discount based on quantity. In addition, a cash discount is awarded when customers meet the defined terms of payment. These terms of payment can be different between customers depending on the negotiated business agreement. The value of cash discounts that is used for the computation of the net profit margin of the customer is a theoretical value, based on the discounts contracted by the customer with ADE. It is assumed that the customer always takes advantage of the cash discount that he is entitled to by paying within the given time frame. Obviously, this is a flawed assumption. Despite the incentive to pay within the given time frame, the customer may choose to pay later e.g. due to cash flow constraints.
3.2.3.5 Bonuses
Some large customers have negotiated a yearly bonus that depends on the sales volume reached during a given year. There are usually different levels of sales volume that the customer can reach that award different amounts at the end of the year. There are also other kinds of bonuses. One example is a bonus given to customers to make sure that they advertise ADE’s products in their catalogs. Another example is a bonus for new store openings i.e. ADE pays a fixed amount whenever the customer opens a new store. Since the value of the yearly bonuses is only known at the end of the year, an estimation is used based on the sales volume up to the date of the analysis.
3.2.3.6 Transport costs
The amount of transport costs is a relevant indicator to consider when analyzing the profitability of a customer, since it varies significantly between customers. The value used in the computation of the net profit margin of the customer is the “real” value. However, this value is
not extracted from the ERP system. In fact, the value is obtained through a process that totally bypasses the ERP system. Upon request, the transport company sends an Excel sheet with data on transport costs. This data is then edited and organized to obtain the necessary information.
3.2.3.7 Advertising costs
Advertising costs is an indicator that includes marketing costs such as the cost of advertisement in specialized magazines, product samples, marketing events, trade fairs and other marketing activities. When there are advertising costs that are specific to a customer, they are assigned to the respective customer. However, most advertising costs are distributed among customers using the sales volume as a cost driver.
3.2.3.8 Handling costs
The handling costs are related to the picking activities at the warehouse. This value is estimated using the sales volume as the cost driver. This is quite a rough estimate, since a few examples can easily tell that the sales volume is not a very accurate cost driver for handling costs. For example, some big orders are fulfilled with the shipment of containers that come directly from the factory in Portugal. Those do not have any handling costs since they are shipped directly to the customer without going through ADE’s warehouse.
3.2.3.9 Credit insurance
Credit insurance represents a cost that is specific to each customer. The insurance is bought from a major provider of trade credit insurance. This protects ADE from losses in case a customer fails to pay a debt as a result of becoming insolvent. The provider defines the premium as a small percentage of sales. The premium depends on the creditworthiness of the customer, as judged by the insurance provider. Not all customers are insured though and those are usually required to pay upfront.
3.2.3.10 Cost of capital
When the customer is not required to pay upfront, the cost of capital of trade credit must be considered. For example, if a customer is allowed to pay one month after the sale, this indicator would be calculated by multiplying the monthly sales volume with the cost of capital expressed as a percentage value, given by the parent company AR.
3.2.3.11 Number of stores
The number of stores of a customer is an indicator that is considered relevant to help evaluate the size of the customer, as well as the potential for sales growth and the reach to end users. The profitability of a customer depends on a number of factors. Negotiation power is affected greatly by the size of the customer due to the current or potential sales volume that they represent. Also, since a big customer reaches a high number of end users, a marketing perspective must be considered. Having the product on display at the stores of a well-known customer and on their catalogs is an important advertisement channel that brings awareness to the brand. For these reasons, the number of stores is an indicator that is taken into consideration for a better understanding of future profitability and for guidelines on the negotiation of business agreements.
3.2.3.12 Number of orders and average order size
The number of orders is a useful indicator because it gives an idea of the frequency with which a customer places orders. Moreover, this indicator can be used together with the sales volume to compute the average order size, according to this formula:
𝑨𝒗𝒆𝒓𝒂𝒈𝒆 𝒐𝒓𝒅𝒆𝒓 𝒔𝒊𝒛𝒆 = 𝑺𝒂𝒍𝒆𝒔 𝒗𝒐𝒍𝒖𝒎𝒆 𝑵𝒖𝒎𝒃𝒆𝒓 𝒐𝒇 𝒐𝒓𝒅𝒆𝒓𝒔
The average order size is an interesting indicator because it gives information that is related to transportation costs and, ultimately, the profitability of the customer. Decisions can be made to encourage bigger orders with lesser frequency, providing a more efficient use of transportation resources.
3.2.3.13 Customer Satisfaction
The existing links to customer profitability enhance the importance of monitoring indicators related to customer satisfaction. ADE sends a customer satisfaction survey to its customers on an annual basis. The survey asks the customer to classify the quality of service and products of ADE. The classification is done using a 4-point Likert scale:
1. Not sufficient 2. Sufficient 3. Good 4. Very good
However, this Likert scale is not balanced (or symmetric), because there is not an equal number of positive and negative positions. There are 3 positive answers (“sufficient”, “good” and “very good”) and only 1 negative answer (“not sufficient”). As mentioned in the literature, this may skew results towards a more favorable outcome. To overcome this problem, the author suggests changing to a balanced 5-point Likert scale:
1. Very insufficient 2. Insufficient 3. Sufficient 4. Good 5. Very good
Another option is to keep a 4-point Likert scale but with different position names: 1. Very insufficient
2. Insufficient 3. Good 4. Very good
Although both alternatives solve the problem of balance, there are differences between them. Most notably, the first option may suffer from central tendency bias i.e. the customer may be led to choose the middle position too often. On the contrary, the second option forces the surveyed customer to be positive or negative about the statement. Hence, the second option is arguably deemed superior.
The survey asks to classify features related to customer support, sales force, logistics, technical assistance, marketing, products, packaging, product development, product samples, prices and others. There is also some space for additional suggestions and comments. The template of the customer satisfaction survey can be found in annex A.
The customer satisfaction survey originates a number of different indicators. It is possible to produce indicators on individual questions, groups of questions or an indicator for the overall customer satisfaction level. The latter can be called customer satisfaction index. The calculation of the customer satisfaction index is done by computing the average classification of the customer satisfaction survey, taking the numerical values of the Likert scale. Any one of these indicators can be used to compare between different customers or to study the evolution of a particular customer over time. Based on this information, decisions can be made to improve customer satisfaction and drive increased profitability.
3.3 Conclusion of the chapter
After exploring how the Customer Profitability Analysis (CPA) is performed at ADE, potential improvement opportunities were discussed. Among other things, it was observed that the indicators used to compute the net profit margin of the customer had a few issues.
Firstly, the value of indicators such as commercial and cash discounts was a theoretical value, based on the conditions contracted by the customer with ADE. It was recognized that using the real value would be more accurate. The reason why the real value was not being used was because the data was not adequately organized in the information system.
Secondly, the value of the transport costs of the customer was not extracted from the ERP system. This indicator was obtained almost manually through a method that totally bypassed the ERP system. Again, the information system was not delivering the needed data the way it should.
At this point, the question was what could be done to be able to extract the data needed from the ERP system. Discussion with management led to the conclusion that in order to achieve this goal, the way transactions were classified in the system had to be reviewed as well as the associated procedures for data collection. Indeed, the methodology by which data was collected to serve as input for the Customer Profitability Analysis was identified as being too manual and time consuming. The focus was thus set upon improving the accurateness and accessibility of this data. At a more detailed level, this involved redesigning the financial dimensions of the Chart of Accounts and defining procedures related to the input of data in the ERP system, as explained in the next chapter.
The problem explained above was deemed the most relevant to address. Nonetheless, there are other issues, some of which have been previously mentioned and given a critical assessment throughout this section. However, a deep discussion of those other problems is beyond the scope of this work.
4 Suggestions of improvement and developed prototypes
In this chapter, the suggestions for improvement are presented as well as the prototypes developed. As stated before, solving the selected problem meant designing the financial dimensions of the Chart of Accounts used to classify transactions in the ERP system and defining procedures related to the input of data in the ERP system. As a side effect, this course of action brought improvements beyond the scope of the initial problem. The organization of transactional data in the ERP system benefits not only the extraction of data for the performance of the Customer Profitability Analysis, but also generally benefits the accessibility and accurateness of data demanded by other Management Control activities. This chapter starts by introducing some of the concepts used to better understand the problems under scrutiny.
4.1 Chart of Accounts
The Chart of Accounts used at ADE is defined by the parent company AR and is the same for all distribution units. The income statement portion of the Chart of Accounts deserves special attention, because it holds data on revenues and expenses that is then used for the Customer Profitability Analysis.
4.2 Levels of the Chart of Accounts
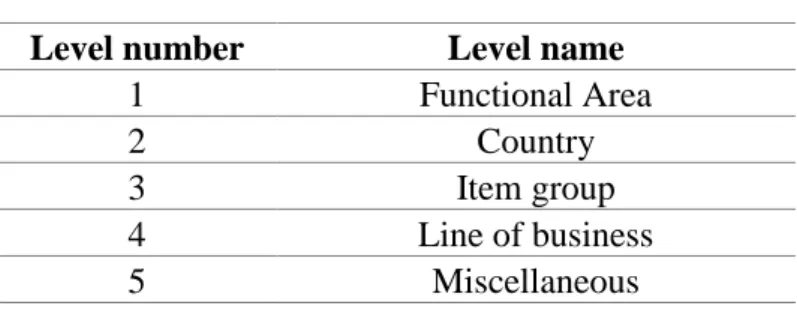
The levels of the Chart of Accounts are extra fields of the Chart of Accounts that are used to store additional information in the ERP system related to a given transaction. In other words, when a transaction is registered in the Finance module of the ERP system, the appropriate account is selected and additional information is provided about the transaction regarding the functional area, country, item group, line of business and other miscellaneous information. The 5 levels of the Chart of Account are presented below.
Table 1 – The 5 levels of the Chart of Accounts Level number Level name
1 Functional Area
2 Country
3 Item group
4 Line of business
5 Miscellaneous
Without going into too much detail, a hypothetical example is given ahead. A transaction regarding transport costs would be registered in the transport account of the Chart of Accounts. Additional information would be provided using the 5 levels of the Chart of Accounts to indicate that the functional area is Logistics, the country is Germany, the item group is Corkstyle, the line of business is Bauhaus and, if there is any other miscellaneous information of relevance, it would be stored in level 5.
4.3 List of Dimensions
The information that can be inserted under each level is limited to a set of predefined options. From here on, this set of predefined options shall be referred to as the List of Dimensions. Each dimension has a code. It is this code that is typed on the computer to store additional information
List of Dimensions is organized in a hierarchic fashion. Each dimension belongs to a certain “sublevel”. The sublevel states its place in the hierarchy. This is best understood with an example:
Table 2 – Sample of the List of Dimensions
Dimension Dimension Description Sublevel Account Type Parent Dimension
B Sales Back Office 8
B0 Sales Back Office 6 B
B00 Sales Back Office 4 B0
B000 SBO - Manager Order Desk 0 Normal B00
B001 SBO - Order Desk North 0 Normal B00
B002 SBO - Order Desk South 0 Normal B00
B003 SBO - Order Desk DIY 0 Normal B00
B004 SBO - Order Desk Contract 0 Normal B00
Above is a small sample of the List of Dimensions to better explain the matter. Using the example, the codes that belong to dimensions of sublevel zero are the codes that can be typed on the computer to store additional information in the levels of the Chart of Accounts when a transaction is registered in the ERP system. In this example, these codes are: B000, B001, B002, B003 and B004. The sublevels above zero (4, 6 and 8) are used to identify a group of dimensions with the same common ground. In this example, the common ground is “Sales Back Office” i.e. the shown dimensions all belong to the Sales Back Office, representing different desks of the Sales Back Office. The column “Account Type” helps to quickly identify the dimensions of sublevel zero i.e. the dimensions of sublevel zero are classified as “Normal” in the column “Account Type”. From here on, the dimensions of sublevel zero may be referred to as “normal dimensions” and the dimensions of sublevels above zero shall be generally referred to as “parent dimensions”.
4.3.1 Dimensions with status “blocked for all purposes”
Some dimensions have become obsolete over time, though their existence in the system persists. This happens because deleting a dimension in the IT system means deleting all past data associated with that dimension, which is not desirable. Although the dimensions must not be deleted, those same dimensions can be redefined to be used for a different purpose, as long as they haven’t been in use for some time, as to avoid mixing data of the new dimension with data of the old dimension. To prevent the use of these obsolete dimensions, they are given the status “blocked for all purposes” which makes it impossible to assign them to new transactions. This status is not necessarily permanent as it can be changed at any time.
4.3.2 Dimensions with no recent transactions
There are many dimensions that are not associated with any recent transactions. This may imply that they have become obsolete. If that is the case, the best policy is to change their description to “do not use” and change their status to “blocked for all purposes”, so that confusion is avoided and their use is prevented. However, in some cases the dimension can serve a useful purpose if used correctly. In those cases, changes are suggested to the procedures for inserting data in the system.
4.3.3 Dimensions named “N/A”
The List of Dimensions has one dimension named “N/A” (stands for “not available”) for each level of the Chart of Accounts. The code for this dimension is simply “----”. This dimension is used when a transaction cannot be classified with any of the other dimensions.
4.4 Problems of the List of Dimensions
In this section, the identified problems of the List of Dimensions are given a critical assessment and the solutions found to solve these problems are presented. This section is organized according to the levels of the Chart of Accounts i.e. the problems of the List of Dimensions are addressed as the List of Dimensions is explored for each level of the Chart of Accounts.
4.4.1 Level 1: Functional Area
The level 1 of the Chart of Accounts is named “Functional Area”. In this level is registered information related to the functional area of the firm i.e. the department or person of the firm responsible for the transaction. The List of Dimensions of level 1 is quite extensive. It is organized in groups identified with the following parent dimensions:
Table 3 – Parent dimensions of level 1
Parent dimension code Parent dimension name Sublevel
- N/A 8
B Sales Back Office 8
C Marketing & Sales 8
D Distribution 8
F Floor Layer 8
G General Administrative Support 8
I Information Flow 8
L Logistics and Stock Management 8
S Sales Force 8
T Technical Assistance 8
Y Industrial BU 8
W AWS 8
Some parent dimensions are not used i.e. the normal dimensions under those parent dimensions are either non-existent or do not have any recent transactions associated with them. The following parent dimensions are in this situation: D, F, Y and W, respectively named Distribution, Floor Layer, Industrial BU (Industrial Business Unit) and AWS (Amorim Wood Flooring). Since the parent dimensions are defined centrally by the parent company AR and are the same across all distribution units, the ERP system of ADE still includes these parent dimensions, despite them not being used. These parent dimensions that are currently not used at ADE may however be in use at other distribution units.
4.4.1.1 Dimensions N/A
Some transactions are registered in the ERP system without being given any additional information about the Functional Area to which they are associated. The code of the dimension named “N/A” (stands for “not available”) is given. The code of this dimension is simply “----”. It was found that most transactions associated with this dimension were of small value and due to mistakes that have no reason to be repeated.
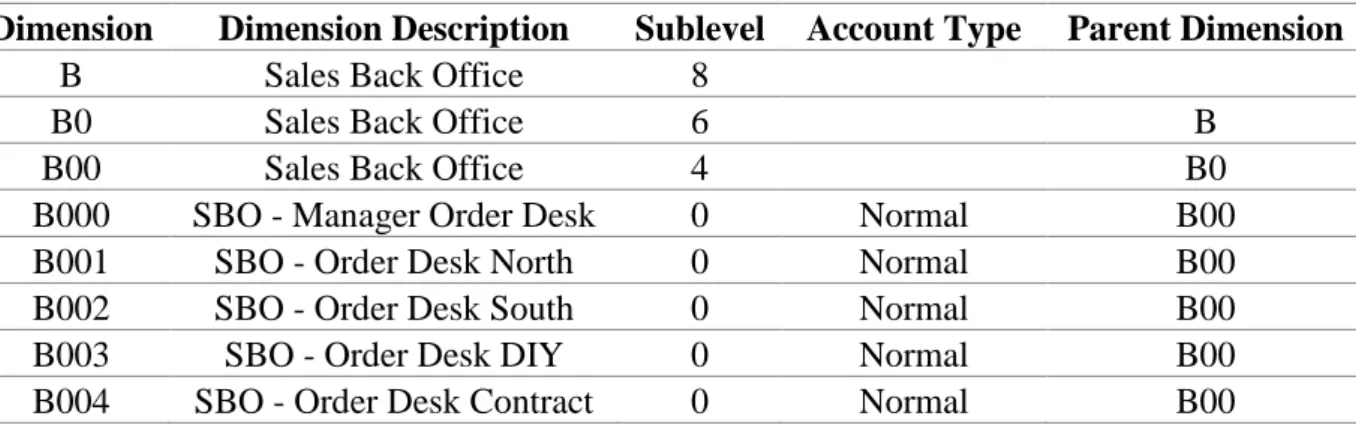
4.4.1.2 Dimensions B: Sales Back Office
The dimensions under the parent dimension named Sales Back Office are presented below.
Table 4 – Dimensions of level 1 under parent dimension B
Dimension Dimension Description Sublevel Account Type Parent Dimension
B Sales Back Office 8
B0 Sales Back Office 6 B
B00 Sales Back Office 4 B0
B000 SBO - Manager Order Desk 0 Normal B00
B001 SBO - Order Desk North 0 Normal B00
B002 SBO - Order Desk South 0 Normal B00
B003 SBO - Order Desk DIY 0 Normal B00
B004 SBO - Order Desk Contract 0 Normal B00
There are 5 normal dimensions below this parent dimension. Dimensions B001-B004 represent each desk of the sales back office. On each desk there are normally 2 people working.
Dimension B000 (SBO - Manager Order Desk) belongs to the Sales Back Office Manager, but has no registered expenses. The explanation for this is that those costs are being distributed among the 4 desks. However, it is more appropriate to register some of the exclusive costs of this person under this dimension, namely salary and travelling expenses.
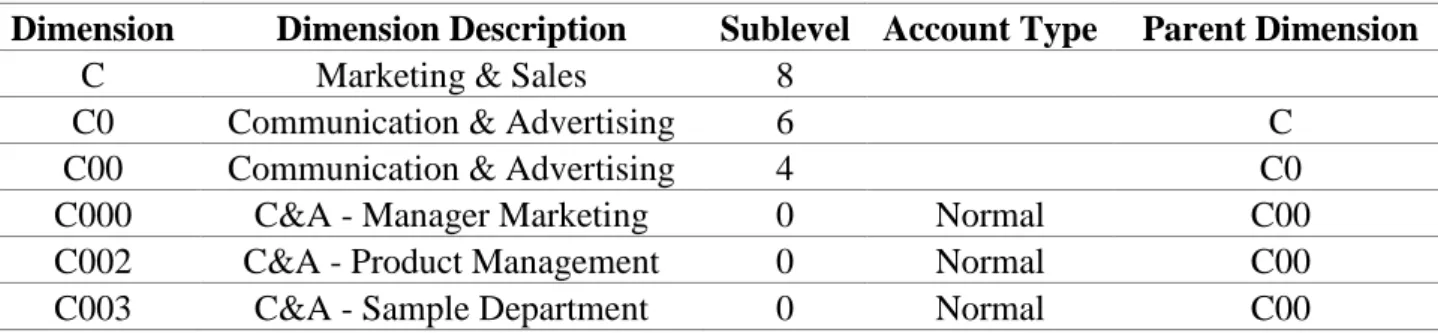
4.4.1.3 Dimensions C: Marketing & Sales
The dimensions under the parent dimension named Marketing & Sales are presented below, excluding the dimensions with no recent transactions.
Table 5 – Dimensions of level 1 under parent dimension C
Dimension Dimension Description Sublevel Account Type Parent Dimension
C Marketing & Sales 8
C0 Communication & Advertising 6 C
C00 Communication & Advertising 4 C0
C000 C&A - Manager Marketing 0 Normal C00
C002 C&A - Product Management 0 Normal C00
There are 3 normal dimensions and each one of them matches a person working at the department. A very large percentage of the total amount goes under dimension C000. All general costs incurred by the Marketing Department fall under dimension C000 (C&A - Manager Marketing) with the reasoning that this is the person that makes the decisions. These costs could instead fall under a new dimension C004 (C&A – General). However, this change has no clear benefit, since the interest of management is mostly focused on knowing the cost of the full marketing department and associate those costs with products, customers and/or events. The only change done to this portion of the List of Dimensions was to block the dimensions with no recent transactions that were not already blocked.
4.4.1.4 Dimensions G: General Administrative Support
Most of the dimensions under the parent dimension named General Administrative Support should not exist. The Bookkeeping department assigned dimensions of level 1 to represent customers or suppliers in transactions such as commissions, penalties, cash discounts, bonuses and other expenses. This is conceptually wrong since dimensions of level 1 are meant to represent the functional area responsible for the transaction. To represent the customer or supplier, dimensions of level 4 should be used. This was changed so that these transactions are registered with dimensions of level 4. The list of dimensions of level 4 was updated and expanded to properly replace the former dimensions of level 1 under the parent dimension named General Administrative Support.
Below is the list of dimensions of level 1 under the parent dimension named General Administrative Support that is meant to be used. Only the dimensions that relate to functional areas of the company were kept.
Table 6 – Dimensions of level 1 under parent dimension G
Dimension Dimension Description Sublevel Account Type Parent Dimension
G General Administrative Support 8
G0 General Administrative Support 6 G
G00 General Administrative Support 4 G0
G000 GAS - General Company 0 Normal G00
G002 GAS-Apprentices 0 Normal G00
G003 GAS-Workers Council 0 Normal G00
G200 CORTEX 0 Normal G00
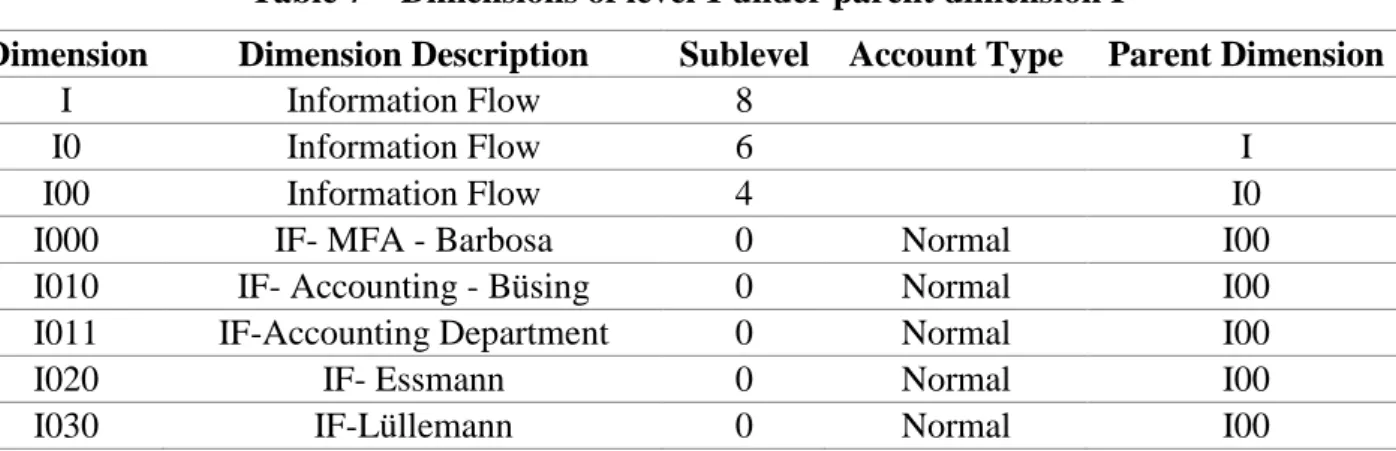
4.4.1.5 Dimensions I: Information Flow
Information Flow is the designation given to the Finance department. The dimensions under the parent dimension named Information Flow are presented below, excluding the dimensions with no recent transactions.
Table 7 – Dimensions of level 1 under parent dimension I
Dimension Dimension Description Sublevel Account Type Parent Dimension
I Information Flow 8
I0 Information Flow 6 I
I00 Information Flow 4 I0
I000 IF- MFA - Barbosa 0 Normal I00
I010 IF- Accounting - Büsing 0 Normal I00
I011 IF-Accounting Department 0 Normal I00
I020 IF- Essmann 0 Normal I00
I030 IF-Lüllemann 0 Normal I00
In order to achieve coherence in the structure of the dimensions, a few changes were suggested. First of all, the names of people were replaced by names that indicate the function of those people within the organization. A dimension of general character was created for transactions that do not fit in other dimensions. This dimension was named “IF- General” and was associated with code I000. As a consequence, the dimension previously associated with the code I000 was then associated with the code I001. Dimensions I020 (IF- Essmann) and I030 (IF- Lüllemann) were merged into a new dimension I004 (IF- Information Flow), since they represent 2 people from the same department and the transactions associated with those dimensions are limited to the respective salaries. The changes are shown below.
Table 8 – Dimensions of level 1 under parent dimension I: old and new version Old version New version
Dimension Dimension Description Dimension Dimension Description
I000 IF- General
I000 IF- MFA - Barbosa I001 IF- Manager
I010 IF- Accounting - Büsing I002 IF- Accounting Responsible I011 IF- Accounting Department I003 IF- Accounting Department
I020 IF- Essmann
I004 IF- Information Flow
I030 IF- Lüllemann
4.4.1.6 Dimensions L: Logistics and Stock Management
Logistics and Stock Management represents the costs incurred by the Purchase Department, the Forwarding Department, the warehouse and transportation. The dimensions under the parent dimension named Logistics and Stock Management are presented below, excluding the dimensions with no recent transactions.
Table 9 – Dimensions of level 1 under parent dimension L
Dimension Dimension Description Sublevel Account Type Parent Dimension
L Logistics and Stock Management 8
L0 Logistics and Stock Management 6 L
L00 Logistics and Stock Management 4 L0
L000 LSM-SCM - Pereira 0 Normal L00
L010 LSM-Transport 0 Normal L00
L011 LSM-Warehouse 0 Normal L00
L020 LSM-Purchase / Disposition 0 Normal L00
L030 LSM-Julio Pereira 0 Normal L00
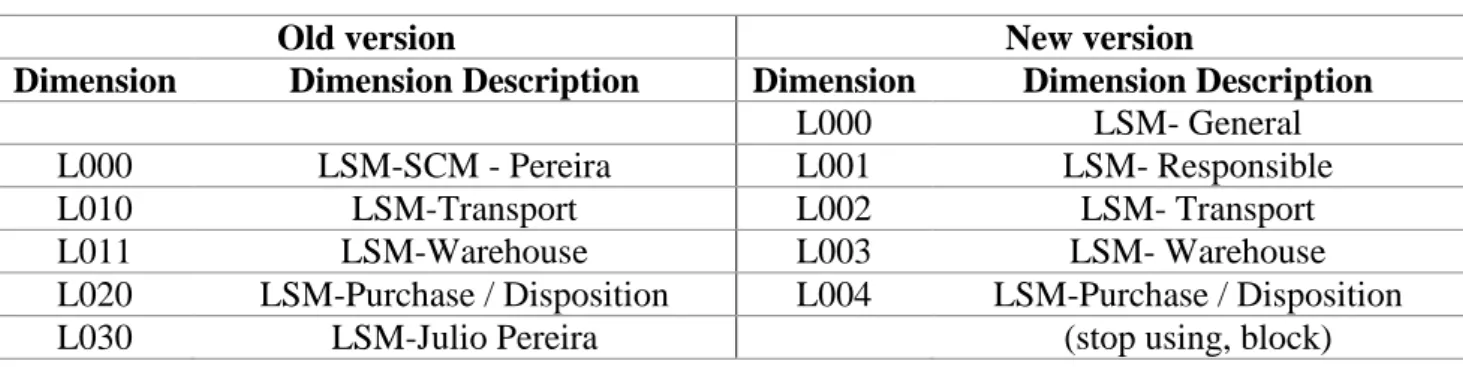
In order to achieve coherence in the structure of the dimensions, a few changes were suggested, using the same logic of the changes done to the dimensions under the parent dimension named Information Flow, as explained in the previous point. In addition, it was suggested to stop using the dimension L030 (LSM- Julio Pereira), named after a former employee. The changes are shown below.
Table 10 – Dimensions of level 1 under parent dimension L: old and new version Old version New version
Dimension Dimension Description Dimension Dimension Description
L000 LSM- General
L000 LSM-SCM - Pereira L001 LSM- Responsible
L010 LSM-Transport L002 LSM- Transport
L011 LSM-Warehouse L003 LSM- Warehouse
L020 LSM-Purchase / Disposition L004 LSM-Purchase / Disposition
L030 LSM-Julio Pereira (stop using, block)
4.4.1.7 Dimensions S: Sales Force
There are many dimensions under the parent dimension named Sales Force. These dimensions are organized in groups using parent dimensions of sublevel 4. The parent dimensions of sublevel 4 under the parent dimension named Sales Force are presented below.
Table 11 – Dimensions of level 1 under parent dimension S Parent dimension code Parent dimension name Sublevel
S10 SF - General Company 4 S20 SF - Cork Residential/DIY 4 S30 SF-Contract 4 S40 SF-Industrial BU 4 S50 SF- AWS 4 S60 SF- AUSTRIA 4