Solvent extraction of sodium chloride from cod
fish (Gadus morhua) salting
processing wastewater
Vincenza Ferraro
a,b, Isabel B. Cruz
a,b, Ruben Ferreira Jorge
b, Manuela E. Pintado
a, Paula M.L. Castro
a,⁎
a
CBQF/Escola Superior de Biotecnologia, Universidade Católica Portuguesa, Rua Dr. António Bernardino de Almeida, 4200-072 Porto, Portugal
bWeDoTech-Companhia de Ideias e Tecnologias, Lda./CiDEB, Escola Superior de Biotecnologia, Universidade Católica Portuguesa, Rua Dr. António Bernardino de Almeida,
4200-072 Porto, Portugal
a b s t r a c t
Keywords: Salting wastewater Codfish
Free amino acids Protein Salt extraction Solvent extraction
Codfish is worldwide mostly consumed salt-cured due to the highly appreciated sensory characteristics promoted by salt. During the salting process huge amounts of salted wastewater are generated – approximately 22% w/w of the codfish – carrying ca. 250 g/L of sodium chloride and ca. 10 g/L of organic compounds, namely proteins and free amino acids. In this study, the salt load of wastewater generated during the salting process of codfish (Gadus morhua) was successfully reduced by ethanol extraction. The effects of time, sample:ethanol ratio, pH and temperature on salt extraction by ethanol addition were assessed by a one-variable-at-a-time approach and then by performing a 32fractional factorial design. The effects of pH were also assessed in absence of ethanol. The maximum amount of salt precipitated in the wastewater was ca. 33%, at a wastewater-ethanol ratio 1:1 (v/v), at a temperature of 0 °C and after 30 min. Proteins and free amino acids present in the wastewater significantly limited salt precipitation; in a blank solution (salt in water at ca. 250 g/L) a higher amount of salt, ca. 37%, was precipitated in the same conditions. Ethanol and temperature showed a linear effect on salt precipitation for both wastewater and blank solution however ethanol was the driving factor. Changes in pH did not result in salt precipitation either in absence or presence of ethanol. During salt extraction, no precipitation of free amino acids occurred in the wastewater while ca. 1.4% of protein fell into the precipitated phase along with the salt.
1. Introduction
Salt-cured codfish continues to be produced in large quantities
because it is highly demanded worldwide. Salt-cured codfish
manu-facturers have to face the costly disposal of huge amounts of salted
wastewater produced throughout the codfish salting process. During
dry salting, alternate layers of codfish and food-grade marine salt are
stacked in a tank for 6 days. At the end of this period, approximately 200 L of heavy salted wastewater are drained away from each ton of
codfish, carrying ca. 250 g/L of salt (sodium chloride — NaCL) and ca.
10 g/L of organic compounds, namely muscle proteins, peptides and
free amino acids[1]. Due to the high load of chloride, this wastewater is
regarded as ecotoxic and can not be disposed to the sea, which could result, in the long run, in detrimental effects on the aquatic life as well
as on the quality of the seawater[2].
The recovery of salt and the recovery of relevant organic compounds present in such residual water are highly desirable as part of the wastewater management process. Furthermore, it is worth to highlight that the food processing industry has in general great
interest in lowering or removing excessive inorganic salt content from the matrix to be processed in order to avoid corrosion problems generated by salt deposits inside the process equipment, and in unit operations such as extractive or azeotropic distillation, adsorption,
crystallisation or liquid-liquid extraction, which are salt-sensitive[3].
The objective of this study was the extraction of NaCl dissolved in
codfish salting process wastewater, while concentrating in solution
proteins, peptides and free amino acids. Salt precipitation by ethanol, a food-grade solvent, was chosen as an adequate strategy. Organic solvents are frequently used to precipitate inorganic species from
aqueous solutions both in analytical or in industrial applications[4,5].
Pure aliphatic alcohols dissolve, in fact, inorganic salt very hardly and, for instance, just 0.18% (w/w) of NaCl can be dissolved in pure ethanol
at 20 °C[6]. Amino acids, proteins and peptides, although with lower
solubility in alcohols than in water, are however much more soluble than sodium chloride under the same operating conditions and
ethanol concentration[7,8].
In this study, the effects of wastewater–ethanol ratio, temperature,
pH and time on salt precipitation by ethanol addition were investigated. The effect of pH was also examined in absence of
ethanol. The study was carried outfirst by one-variable-at-a-time
approach and then by an experimental design performing a 32
fractional factorial design (2 variables at 3 levels). Compared to the ⁎ Corresponding author. Tel.: +351 225580059; fax: +351 225090351.
one-variable-at-a-time approach, the fractional factorial design methodology allows to study at the same time the effects of each factor and the effects of interaction between factors on the response variable. In addition, the total number of runs in factorial design is
much less as compared to the one-variable-at-a-time method[9]. The
behavior of proteins and amino acids in the wastewater-alcohol solution was also assessed by determining their concentration in wastewater before and after addition of ethanol.
2. Materials and methods
2.1. Wastewater, blank solution and ethanol
Wastewater was supplied by Pascoal & Filhos, S.A. (Aveiro, Portugal), as generated throughout the salting process of Atlantic
codfish (Gadus morhua) caught in the Northern Sea. Wastewater was
collected from a tank where 800 kg of codfish had gone through the
salting process for 6 days at 17 °C. Before sampling, wastewater was homogenized by stirring, and after sampling was centrifuged at 5000 rpm, 4 °C, 10 min in order to precipitate suspended solids, such
asfish flesh, skin and bonds residues.
A blank solution of 254 g/L NaCl (resembling concentration in wastewater) was prepared with food-grade marine salt, the same used
for the codfish salting, supplied by Pascoal & Filhos, S.A. An amount of
319 g of salt was added to 1 L deionized water and the mixture was placed in an ultrasound bath to accelerate salt dissolution.
Absolute ethanol (99.9% purity) of food-grade used for salt precipitation was supplied by Aga (Porto, Portugal).
2.2. Sodium chloride precipitation procedure
The following procedure was carried out for both wastewater and blank solution. The effects of pH and of ethanol addition on salt precipitation were assessed. Effects of pH were studied in presence and in absence of ethanol. For the sample-ethanol mixtures, beside the effects of pH, the effects of settling time, temperature and ethanol in solution were also studied.
The effect of pH changes in both blank and wastewater were assessed by acidifying samples down to pH 2, using 1 M hydrochloric acid (Sigma-Aldrich; Sintra, Portugal), and by alkalinizing up to pH 9 and pH 11, using 5 M sodium hydroxide (Sigma-Aldrich).
A volume of sample of 100 mL was transferred into a 250 mL cone shaped funnel. Then, acid or alkali was mixed with the sample in order to study the effect of pH. When the effect of ethanol was investigated (without changing the original sample pH), an aliquot of that solvent
(different for each experiment, and in the range 20–140 ml of ethanol
added to 100 ml of sample) was added to the funnel and the mixture was shaken for 1 min. Instantaneous extraction of sodium chloride following shaking was visible by the formation of a turbid and white fluid generated by the sample-ethanol mixture as a consequence of
Na+and Cl−ions association. After salt extraction, the funnel was
transferred into a water-bath to allow the salt to settle. In order to study the effect of temperature on the amount of salt removed, precipitation runs were carried out at 0, 10, 15 and 27 °C (this last as the actual ambient temperature). For the temperature of 0 °C, the water was replaced by ice. Effects of temperature were assessed at a sample-ethanol ratio of 1:1. The effect of time on the amount of salt precipitated was also evaluated, where NaCl concentration in upper
phase was determined at different times– 6.5, 13, 20, 25, 30, 60 and
120 min after precipitation started– at the temperature of 27 °C and
at a sample-ethanol ratio of 1:1. The effects of pH changes in the
sample:ethanol 1:1 mixtures were finally investigated at the
temperature of 27 °C.
After the salt was settled, the supernatant was gently separated from the precipitate with a pipette. Both supernatant mixture and precipitate were centrifuged at 5000 rpm for 10 min. After that, the
sample-ethanol mixture supernatant and the supernatant arising from centrifugation of the precipitated phase were mixed and kept at ambient temperature until analysis. Similarly, both heavy phases
generated by centrifugation of sample–ethanol mixture and the
precipitate were mixed and kept at ambient temperature until analysis.
Each combination of parameters was tested in duplicated: 12 mixtures (6 for wastewater and 6 for blank) for 3 different pH in absence of ethanol, 12 mixtures (6 for wastewater and 6 for blank) for 3 different pH value in the presence of ethanol, 28 mixtures (14 for wastewater and 14 for blank solution) for 7 different times, 28 mixtures (14 for wastewater and 14 for blank solution) for 7 different amounts of ethanol added to sample, 16 mixtures (8 for wastewater and 8 for blank solution) for 4 different temperatures, and 8 mixtures for factorial design (for wastewater only) were prepared, giving a total of 104 experiments. Amount of salt precipitated was calculated
as the percentage ratio of the difference between initial andfinal NaCl
concentration in sample-ethanol mixture and the initial NaCl concentration in the sample-ethanol mixture.
2.3. Determination of salt and dry matter
Total salt content, as NaCl, was determined by titration according
to the Mohr method[10]. Dry matter was quantified as described in
EN 12880:2000[11]. Determinations were carried out in triplicate.
2.4. HPLC–UV/Vis analysis of free amino acids
Chromatographic analysis were performed using a Beckman&Coulter 168 series HPLC system interfaced with a Photo Diode Array UV/Vis
detector (PDA 190–600 nm) (Beckman&Coulter; Fullerton, CA, USA).
Data acquisition and analysis were accomplished using Karat32 software.
All eluents were filtered through a 0.45 μm cellulose membrane
(Millipore-Interface; Amadora, Portugal) and degassed in an ultrasound bath (Millipore-Interface) for 15 min prior to be used as mobile phases. All determinations were carried out in triplicate.
2.4.1. Taurine and creatine analysis
Taurine and creatine were analysed using a Waters Nova-Pack
RP-HPLC, C18 column (150× 3.9 mm, 4μm) (ViaAthena; Lisbon, Portugal).
Taurine analysis was carried out using the method described by Orth
[12], with a slight modification in the gradient elution and in the column.
Standard solutions for calibration, covering the range of 10–80 μg/ml,
were prepared from a stock solution containing 100μg/ml taurine
(Sigma-Aldrich; Sintra, Portugal) dissolved in ultrapure water. Gradient of mobile phases was as follow: 100% of acetonitrile (Frilabo; Porto, Portugal) from 0 to 50% in 15 min, and constant at 50% for the subsequent 5 min. The other mobile phase was composed of 1.298 g
NaHPO4·H2O and 0.106 g NaHPO4·2H2O in 1 L ultrapure water at pH
6.0. Elutionflow rate was 1 ml/min. Chromatographic runs were carried
out at 25 °C. Taurine peak was detected at 360 nm.
Creatine analysis was performed as described by Smith-Palmer
[13], specifically for fish tissues. Standard solutions for calibration, in
the range 10–100 μg/ml, were prepared from a stock solution
containing 100μg/ml creatine (Sigma-Aldrich) dissolved in ultrapure
water. Chromatographic runs were carried out at 25 °C. Creatine peak was detected at 210 nm.
2.4.2. Other free amino acids analysis
For the remaining free amino acids, the method reported by Alonso,
Alvarez and Zapico[14]was selected, using a RP-HPLC C18 Ultrasphere
5-ODS (25 × 4.6, 5μm) column (Beckman&Coulter). The external
standards used for the calibration (Sigma-Aldrich) were 12.5 mM tyrosine, and 25 mM aspartic acid, glutamic acid, glutamine, serine, asparagine, glycine, threonine, histidine, arginine, alanine, proline, valine, methionine, cysteine, leucine, phenylalanine, tryptophan, lysine
and isoleucine all dissolved in ultrapure water. Amino acids were detected at 254 nm. Chormatographic runs were carried out at 50 °C. 2.5. HPLC-RID analysis of ethanol
Ethanol analysis was performed using a Beckman & Coulter 168 series HPLC system interfaced with a Waters R-401 differential refractometer detector (Beckman&Coulter; Fullerton, CA, USA) and by an Aminex HPX-87H Ion Exclusion column (300 × 7.8 mm) (Bio-Rad; ViaAthena). Isocratic elution of ethanol was performed using an 8 mM
H2SO4(Fluka; Lisbon, Portugal) mobile phase, at aflow rate of 0.8 ml/
min and at 25 °C. Standards solutions for calibration were in the range
5–0.5% (w/w) of absolute ethanol (Fluka) in ultra-pure water;
retention time was 17.5 min.
Samples to be analysed were dissolved in ultra-pure water and filtered through a 0.45 μm cellulose membrane (Millipore-Interface;
Amadora, Portugal). Mobile phase wasfiltered and degassed in an
ultrasound bath (Millipore-Interface) for 15 min prior to elution. All determinations were carried out in triplicate.
2.6. Determination of protein content
The concentration of water-soluble proteins was determined by
the Biuret method[15,16], using a UV mini 1240 spectrophotometer
(Shimatzu; Carnaxide, Portugal). The Biuret color yield was standar-dised against an aqueous solution of analytical bovine serum albumin
(Sigma-Aldrich) in the range 1–10 mg/ml. A volume of sample of
0.5 ml was used in the whole reacting mixture. All determinations were performed in triplicate.
2.7. Electrophoretic analysis
Prior to electrophoresis, samples were heated at 80 °C for 15 min, and then mixed with an equal volume of sample buffer. This buffer was prepared by adding 6 g of glycerol (Merck) and 1.6 g of sodium dodecyl sulphate Aldrich) to 4 ml of Tris-SDS solution (Sigma-Aldrih). SDS-PAGE was performed in a Protean II, XL Cell (Bio-Rad), using 4% stacking gel, 10% spacer gel and 16.5% running gel, as
described by Schägger and von Jagow[17].
Protein bands were stained with 0.25% Coomassie brilliant blue solution (Merck) for 1 h and then washed with a destaining solution of 2.5:1 (v/v) acetic acid and methanol (Frilabo), until protein bands became clearly visible in a colourless gel matrix. Band analysis was performed using a GS-700 Densitometer equipped with Molecular Analyst v.1.0 Software (Bio-Rad). Samples were analysed in duplicate. 2.8. Design of experiments
Design of experiments was performed by a fractional factorial design. As known, fractional factorial design consists of a properly chosen subset of the experimental runs of the full factorial design. The subset is chosen in order to exploit the sparsity-of-effects principle, which states that a system is usually dominated by not more than two factors with low order interactions and not higher than the second order. Higher order interactions such as three factors interactions, are
very rare[9].
Fractional factorial design was performed with the software STATISTICA v.9.0 (StatSoft Co.). Two factors at three levels were
considered for a total of 9 (32) factorial experiments. Factors
examined were temperature and wastewater-ethanol ratio. The factor time has been discarded since it not affects salt solubility, but only salt precipitation after solubility has been decreased by the ethanol or temperature. Levels considered for temperature were 0, 10 and 27 °C. For the factor ratio, studied levels were 20, 60 and 100% (v/ v) of ethanol added to sample. The matrix of chosen experiments for
fractional factorial design is reported in Table 1. According to the
factorial design symbology, symbol “+” indicates a parameters
combination whose response (% of salt precipitated) is known from
the one-variable-at-a-time approach, while symbol “−” indicates
parameters combination whose response must be tested[9].
2.9. Statistical analysis
One-way analysis of variance (ANOVA) was carried out with the
software STATISTICA v.9.0, setting a confidence level of 95% (p≤0.05).
3. Results and discussion 3.1. Effects of pH
Alteration in pH to acid or basic values did not produce salt precipitation either in wastewater or blank solution. These results
confirmed the finding that the common ion effect only occurs for
sparingly soluble salts. That is not the case of chloride salts which are
very soluble in water expect those of Ag+, Hg2+, Pb2+. For sparingly
soluble salts, in fact, solubility is reduced when another species containing the same ion (called common ion) is added in solution,
which results in salt precipitation[18].
3.2. Effects of ethanol
Different yields of precipitation of NaCl were achieved depending on the operating conditions. Differences in the amount of salt precipitated in wastewater and blank solution were observed for each combination of parameters examined. At the best operating condition, 15 ml of precipitated phase were collected, starting from
100 ml of wastewater, i.e. from 200 ml of wastewater–ethanol
mixture. As shown inTable 2 the precipitated phase contains ca.
70% of solid matter, constituted almost totally by salt, and 30% liquid matter, composed of ethanol and water, in the same proportion of
ethanol–wastewater mixture. No precipitation of amino acids
occurred while 1.44% of proteins felt down along with salt.
Precipitation of salt is attributed to the decrease of polarity in both wastewater and blank solution, which occurs after ethanol addition
[6]. Water and organic solvents have different polarities and different
strengths of interaction with NaCl, which results in different solubility of sodium chloride in water and organic solvents. Addition of ethanol, whose polarity at 25 °C (24), is approximately one third that of water
(80), induces significant reduction on salt solubility[19]. In our study,
for each parameter investigated, the amount of salt precipitated was
significantly higher (p≤0.05) in the blank–ethanol mixture than in
the wastewater-ethanol mixture (Figs. 1, 2and3), the difference being
attributed to the presence of amino acids in the wastewater. It is
known that the presence of amino acids significantly increases the
polarity of a solution above that of solvent[20]. As such, the lower
amount of salt precipitated in wastewater can be partially attributed
to the higher polarity of the wastewater–ethanol mixture, which
increased salt solubility above that of the blank–ethanol mixture. At
the same time, NaCl and ethanol contribute to the solubilisation of some amino acids in the wastewater-ethanol mixture. Aqueous solubility of a nonelectrolyte, like amino acids, is generally dependent on the concentration and type of salt present in solution, and the salt Table 1
Matrix of experiments for factorial design. Temperature (°C)
(Factor 1)
% (v/v) of Ethanol added (Factor 2)
20 (Level 1) 60 (Level 2) 100 (Level 3)
0 (Level 1) - – +
10 (Level 2) – – +
effect is described by the Setschenow equation[21]. According to the latter, solubility of polar amino acids increases by increasing NaCl concentration while the solubility of nonpolar analogues is decreased, and this happens because polar salts, like NaCl, produce a continuum that is more polar than pure water. An identical effect on the solubility
of amino acids is generated by the addition of ethanol to water[22].
Codfish salting processing wastewater contains 10 major free amino
acids with different physicochemical behaviour, and the amount of hydrophilic amino acids-aspartic acid, glutamic acid, creatine and
lysine-predominated (Table 2). HPLC–UV analysis of wastewater
before ethanol addition and in wastewater–ethanol mixture after salt
precipitation showed that no precipitation of amino acids occurred (Table 2), which accounts for the higher polarity of the wastewater–
ethanol mixture. The pH of the wastewater–ethanol mixture (pH 6)
might also account for this result because the zwitterion form of the amino acids-which exist at intermediate pH-has a large effect on increasing their solubility, since they are strong dipoles that easily
bind to water and ethanol[20].
Regarding proteins, 1.44% (w/w) precipitated with salt at the best extracting conditions, and the precipitated phase showed the same protein composition of wastewater and wastewater-ethanol mixture
supernatant (Fig. 7). InFig. 7, myosin heavy chains (205 kDa) and
other bands originated from myosin heavy chain fragmentation between 205 and 97.4 kDa, which account for heavy meromyosin (and its subunits) and light meromyosin, are clearly visible. The band appearing at 78 kDa may be either tropomyosin or a remaining of light
meromyosin, as reported elsewhere[23]. Actin appeared visible with
a band at ca. 45 kDa. The peptide of ca. 8.2 kDa, can be a product of myosin degradation.
Myofibrillar proteins were found in wastewater as a consequence
of the salting-out effect throughout the codfish salting process, as
reported by Ferraro et al.[1]. Protein solubility is a function of the
dielectric constant, ionic strength, pH and temperature of a solution
[24]. A salting-in/salting-out effect phenomenon is common to most
proteins: increasing salt concentration initially improves solubility in), but after a maximum, solubility is depressed (salting-Table 2
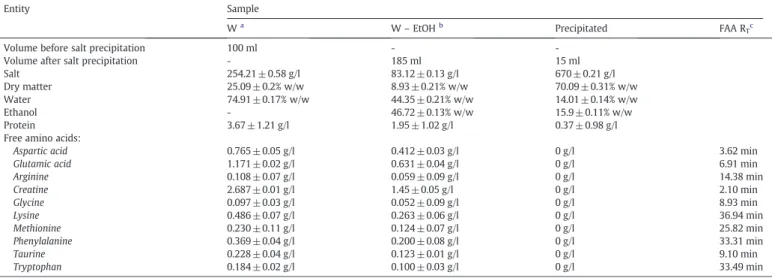
Composition of wastewater, wastewater-ethanol mixture and precipitated phase at the best operating conditions– 0 °C, 30 min, wastewater:ethanol ratio 1:1 (v/v) (mean± standard deviation).
Entity Sample
Wa
W– EtOHb
Precipitated FAA RTc
Volume before salt precipitation 100 ml -
-Volume after salt precipitation - 185 ml 15 ml
Salt 254.21 ± 0.58 g/l 83.12 ± 0.13 g/l 670 ± 0.21 g/l
Dry matter 25.09 ± 0.2% w/w 8.93 ± 0.21% w/w 70.09 ± 0.31% w/w
Water 74.91 ± 0.17% w/w 44.35 ± 0.21% w/w 14.01 ± 0.14% w/w
Ethanol - 46.72 ± 0.13% w/w 15.9 ± 0.11% w/w
Protein 3.67 ± 1.21 g/l 1.95 ± 1.02 g/l 0.37 ± 0.98 g/l
Free amino acids:
Aspartic acid 0.765 ± 0.05 g/l 0.412 ± 0.03 g/l 0 g/l 3.62 min
Glutamic acid 1.171 ± 0.02 g/l 0.631 ± 0.04 g/l 0 g/l 6.91 min
Arginine 0.108 ± 0.07 g/l 0.059 ± 0.09 g/l 0 g/l 14.38 min Creatine 2.687 ± 0.01 g/l 1.45 ± 0.05 g/l 0 g/l 2.10 min Glycine 0.097 ± 0.03 g/l 0.052 ± 0.09 g/l 0 g/l 8.93 min Lysine 0.486 ± 0.07 g/l 0.263 ± 0.06 g/l 0 g/l 36.94 min Methionine 0.230 ± 0.11 g/l 0.124 ± 0.07 g/l 0 g/l 25.82 min Phenylalanine 0.369 ± 0.04 g/l 0.200 ± 0.08 g/l 0 g/l 33.31 min Taurine 0.228 ± 0.04 g/l 0.123 ± 0.01 g/l 0 g/l 9.10 min Tryptophan 0.184 ± 0.02 g/l 0.100 ± 0.03 g/l 0 g/l 33.49 min a
Wastewater before ethanol addition.
b Wastewater-ethanol mixture after salt precipitation. c
Retention time of free amino acids on HPLC-UV analysis.
0 5 10 15 20 25 30 35 40 0 30 60 90 120 % NaCl precipitated Time (min) Blank solution Wastewater
Fig. 1. Salt precipitation trends in blank solution and wastewater after 100 ml ethanol addition to 100 ml of sample, along 120 min (mean values ± standard deviation bars).
0 5 10 15 20 25 30 35 40 45 0 20 40 60 80 100 120 140 % NaCl precipitated % (v/v) Ethanol added Blank solution Wastewater
Fig. 2. Salt precipitation trends in blank solution and wastewater along ethanol addition, after 30 min and at 27 °C (mean values ± standard deviation bars).
out)[25]. As such, proteins of white muscle, like cod proteins, are completely soluble in diluted salt solution, i.e. in solution of
physiological ionic strength (9 g/L NaCl) or less, at a neutral pH[26].
Myosin, the major myofibrillar protein, is soluble at higher ionic
strength (N18 g/L NaCl) because of hydrophobicity of its surface[25].
Weakly polar solvents, like ethanol, methanol or acetone, cause denaturation of secondary and tertiary structure of proteins. As such, their solubility decreases markedly due to an increase in strength and number of intra and intermolecular electrostatic attraction, which
result in proteins aggregation and precipitation[27]. As reported by
Simpson [26], most proteins larger than 20 kDa precipitate from
aqueous solutions when concentration of organic solvent reaches ca. 50% (w/w). Typically, larger proteins and more hydrophilic proteins (like myosin rod) precipitate at lower organic solvents concentration, while higher solvent concentrations are required for smaller and
hydrophobic proteins (like myosin head)[28]. However, performing
salt precipitation at 0 °C should help reducing protein precipitation since protein solubility increases by decreasing temperature, due to
increasing of the dielectric constant[23]. Also, denaturation induced
by ethanol can be reduced by the low temperature of salt precipitation
since codfish proteins in physiological solution does not undergo
denaturation at temperatures in the range— 4 °CbTb30 °C[29].
3.2.1. One-variable-at-time-approach methodology
3.2.1.1. Amount of NaCl precipitated depending on time. When the effect
of time on salt settling was investigated, results showed that blank–
and wastewater–ethanol mixtures needed the same time period to
reach the equilibrium, ca. 30 min. However, precipitation trends of
salt in blank– and wastewater–ethanol mixtures were different
(Fig. 1). In the wastewater-ethanol mixture, the amount of salt
precipitated increased with time (from ca. 15 to ca. 26%) (p≤0.05) up
to 30 min, and remained constant between 30 and 120 min (pN0.05) .
On the contrary, in the blank–ethanol mixture, salt easily precipitated
Fig. 5. Pareto plot of the standardised effects of the two factors (“EtOH” — ethanol; “Temp” — temperature) on the response (salt precipitated). “L” stands for “linear”, “Q” stands for“quadratic”. Vertical line defines significance limit expressed by the p-value at a confidence level of 95%. 0 5 10 15 20 25 30 35 40 0 3 6 9 12 15 18 21 24 27 % NaCl precipitated Temperature (C) Blank solution Wastewater
Fig. 3. Salt precipitation trends in blank solution and wastewater along temperature increasing, after 30 min and for 100 ml of ethanol added to 100 ml of sample (mean values ± standard deviation bars).
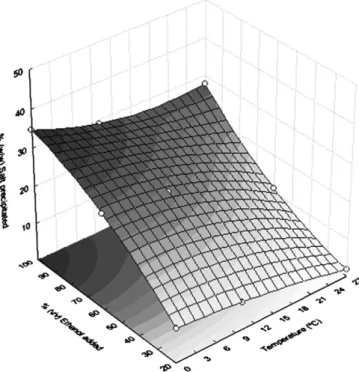
Fig. 4. Second-orderfitted response surface.
Fig. 6. Pareto plot of the effects of the two factors (“EtOH” — ethanol; “Temp” — temperature) on the response (salt precipitated).“L” stands for “linear”, “Q” stands for “quadratic”.
during thefirst 6.5 min (ca. 34% NaCl precipitated), but it dissolved again until reaching an equilibrium value at 30 min (ca. 30% NaCl
precipitated), after which remained constant up to 120 min (pN0.05).
At the equilibrium time of 30 min, the amount of salt precipitated was
higher in the blank than in the wastewater-ethanol mixture (p≤0.05)
where a difference of ca. 3% was observed.
Although in the blank–ethanol solution salt precipitated more
quickly, NaCl particles that have been rapidly pulled down by gravity tended to migrate to region of lower concentration according to the Fick's law and until establishing a dynamic equilibrium with NaCl in
the supernatant phase[30]; that condition was achieved at 30% of
NaCl precipitated (Fig. 1). The slower precipitation rate and the lower
amount of NaCl precipitated in the wastewater–ethanol solution
could be attributed to the presence of proteins and hydrophobic amino acids, and two phenomena can be hypothesised. First, the large surface of proteins in solution made the precipitation of NaCl particles
difficult, and as such an amount of the salt settled onto proteins and
floated along with them. On the other hand, proteins and hydrophobic
amino acids were kept in solution due to NaCl bridges with water–
the salting-in phenomenon [26] – so that an amount of NaCl
continued bonded to protein and amino acids even after ethanol addition, limiting salt precipitation.
3.2.1.2. Amount of NaCl precipitated depending on amount of ethanol added to samples. The effects of variable volumes of ethanol added to the samples on salt precipitation were studied at 27 °C and at a
defined time period of 30 min. As the volume of ethanol added
increased, the amount of salt precipitated significantly and linearly
increased (p≤0.05) in the blank–ethanol mixture (from ca. 7 to ca.
40%) in all the range studied (20–140% ethanol added). In the
wastewater–ethanol mixture the amount of precipitated salt
in-creased only up to 100% ethanol added (corresponding to 45% (w/w)
of ethanol in the mixture) (from ca. 1.7 to ca. 26.1 %); no significant
differences (pN0.05) in amounts of sodium chloride precipitated in
the wastewater were observed by increasing the proportion to
ethanol over 1:1 (v/v) (Fig. 2). As such, ethanol had a positive effect
on salt settling in the wastewater-ethanol mixture, however only up to a ratio 1:1. At that proportion, yield of precipitation was 4% higher
in the blank- than in the wastewater-ethanol mixture (p≤0.05).
At constant temperature, solubility of hydrophilic amino acids increases by increasing ethanol concentration, while solubility of hydrophobic amino acids decreases, however only up to 45% (w/w)
ethanol in water, since no significant change in the polarity occurs
over this concentration[7,20]. This phenomenon largely explains why
in our study precipitation of salt in the wastewater-ethanol mixture
did not increase by increasing ethanol addition over 100% (v/v) (Fig. 2).
3.2.1.3. Amount of NaCl precipitated depending on temperature. The effects of temperature were analysed at a sample:ethanol ratio 1:1 (v/ v) and at the plateau time of 30 min. Both samples showed the same
trend: linear and significant increase (p≤0.05) on the percentage of
precipitated salt was observed in blank–ethanol mixture (from ca. 30
to ca. 37%) and wastewater–ethanol mixture (from ca. 26 to ca. 33%)
by decreasing the temperature from 27 °C to 0 °C (Fig. 3). For each
temperature tested, yield of precipitation of sodium chloride was ca.
4% higher in blank– than in wastewater–ethanol mixture; however,
the increase in amount of salt precipitated by decreasing temperature from 27 to 0 °C was the same in both samples, ca. 7%. Sodium chloride solubility in water is slightly affected by temperature: Pinho and
Macedo[4]reported a decrease of NaCl solubility of ca. 0.051% for a
decrease of 1 °C, in the range 0–30 °C. On the contrary, in aqueous–
ethanol solutions, Farelo[3]reported a decrease of NaCl solubility of
ca. 0.26% for a decrease of 1 °C in the same range of temperature, 0–
30 °C, and for a ratio ethanol to water of 1:1 (v/v).
3.2.1.4. Amount of NaCl precipitated depending on pH. The effects of pH change were examined at 27 °C and at a sample:ethanol ratio of 1:1. Results revealed that no increase in salt precipitation occurred either by acidifying or alkalinizing the samples, which can be attributed to
the absence of the common ion effect as discussed insection 3.1.
3.2.2. Experimental design methodology
Fractional factorial design was established only for wastewater
and by the assumption that no significant differences in salt
precipitation from the wastewater-ethanol mixture were found by
increasing ethanol up 100%(v/v) (Fig. 2). The second-order fitted
response surface (Fig. 4) generated by factorial design data (Table 3)
shows no maximum points but a trend, which corroborates the results found by the one-variable-at-a-time approach: ca. 33% salt precipi-tated at the operating conditions of 0 °C, 100% (v/v) ethanol added
and 30 min duration. As it can be seen in the Pareto graph (Fig. 5), the
response (% salt precipitated) is significantly dependent upon a linear
effect of each factor (p≤0.05), and ethanol showed the greatest effect.
As expected, temperature dependence of the response was not as
pronounced as ethanol (Fig. 5). Quadratic effects of variables,
which can be expected for factor levels greater than 2[9], were not
significant as was not the interaction between variables (pN0.05)
(Figs. 5 and 6).
Results of experimental design confirmed the
one-variable-at-a-time approach outcomes; however, only 9 experiments were needed for the fractional factorial design versus the 18 runs performed in the one-variable-at-a-time methodology.
4. Conclusion
Solvent extraction of salt from wastewater generated at a fish
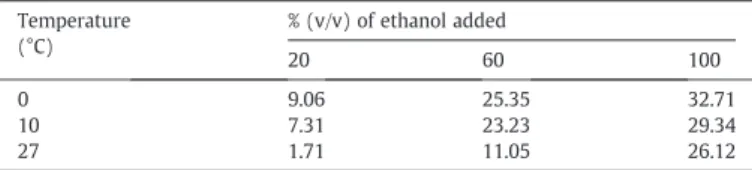
processing industry was investigated and successfully carried out. 33% of salt was precipitated at the optimal operating conditions of 0 °C, 100% (v/v) ethanol added to the wastewater and at a settling time of 30 min. Amount of salt precipitated could be increased by several Table 3
Matrix of data (mean values) for factorial design. Temperature (°C) % (v/v) of ethanol added 20 60 100 0 9.06 25.35 32.71 10 7.31 23.23 29.34 27 1.71 11.05 26.12 205 116 97.4 66 45 22 8.2 6.2
Fig. 7. SDS-Page electropherogram of samples. First lane represents standards mixture with weight expressed in kDa. Second and third lanes refer to wastewater; fourth and fifth lanes refer to wastewater-ethanol mixture supernatant; sixth and seventh lanes represent the precipitated phase.
extraction stages, each followed by ethanol distillation. Salt contained in the supernatant allows avoiding the azeotrope formed by water and ethanol, making the recovery of pure ethanol feasible which could be recycled in the next precipitation stage. It can be concluded that salt precipitation from the wastewater by ethanol allows the recovery
of the organic load– valuable proteins, peptides and amino acids –
and salt dissolved in that residual water. Ethanol can be considered the driving factor for salt precipitation while the low temperature helps avoiding protein denaturation and precipitation. Changes in pH did not exert any effect on salt precipitation.
Results obtained by our research allowed assessing the feasibility
of codfish salting processing wastewater upgrading by amino acids
and proteins recovery after salt removing. Valorisation of that liquid
waste could contribute to codfish salting industry sustainability,
through reduction of costly disposal treatments and creation of economical value from a costless feed.
Acknowledgments
Author Vincenza Ferraro thanks Marie Curie Actions (European Research Area) for a doctoral grant (Ref. InSolEx RTN under FP6).
Financial support from the project iCOD (QREN/POFC/SII&DT) is also acknowledged.
Pascoal & Filhos S.A. (Portugal) is gratefully acknowledged for supply of samples and technical support.
References
[1] V. Ferraro, I.B. Cruz, R. Ferreira Jorge, F.X. Malcata, P.M.L. Castro, M.E. Pintado, Characterisation of high added value natural compounds in wastewater throughout the salting process of codfish (Gadus morhua), Food Chemistry 124 (4) (2011) 1363–1368.
[2] M.H. El-Naas, A.H. Al-Marzouqi, O. Chaalal, A combined approach for the management of desalination reject brine and capture of CO2, Desalination 251
(2010) 70–74.
[3] F. Farelo, Solubilities of sodium chloride and potassium chloride in water + ethanol mixtures from (298 to 323) K, Journal of Chemical Engineering Data 49 (2004) 1782–1788.
[4] S.P. Pinho, E. Macedo, Solubility of NaCl, NaBr, and KCl in water, methanol, ethanol, and their mixed solvents, Journal of Chemical Engineering Data 50 (2005) 29–32.
[5] M.S.H. Bader, Precipitation and separation of chloride and sulfate ions from aqueous solutions: basic experimental performance and modelling, Environmen-tal Progress 17 (2) (1998) 126–135.
[6] K. Jurkiewicz, Phase equilibrium in the system of water, alcohol or ketone, and sodium chloride, Fluid Phase Equilibria 251 (2007) 24–28.
[7] P. Ji, J. Zou, W. Feng, Effect of alcohol on the solubility of amino acids in water, Journal of Molecular Catalysis B: Enzymatic 56 (2009) 185–188.
[8] C.J. van Oss, R.J. Good, M.K. Chaudhury, Solubility of proteins, Journal of Protein Chemistry 5 (6) (1986) 385–405.
[9] A. Jiju, A systematic methodology for design of experiments, in: A. Jiju (Ed.), Design of experiments for engineers and scientists, Elsevier Press, Oxford, UK, 2003, pp. 29–41.
[10] AOAC, Association of Official Analytical Chemists, Official Methods of Analysis, 15th Ed., AOAC International 1990 Washington DC, USA.
[11] ISO 973:1978, Determination of nitrogen content, International Organization for Standardization, Geneva, Switzerland, 1978.
[12] D.L. Orth, HPLC determination of taurine in sport drinks, Journal of Chemical Education 78 (6) (2001) 791–792.
[13] T. Smith-Palmer, Separation method applicable to urinary creatine and creatinine, Journal of Chromatography B 781 (2002) 93–106.
[14] M.L. Alonso, A.I. Alvarez, J. Zapico, Rapid analysis of free amino acids in infant foods, Journal of Liquid Chromatography 17 (1994) 4019–4030.
[15] R.A. Copeland, Methods for protein quantitation, in: R.A. Copeland (Ed.), Methods of Protein Analysis, Chapman & Hall, New York, USA, 1994, pp. 39–58. [16] B. Chance, E.R. Redfearn, Direct spectrophotometric studies of the kinetics of
oxidation and reduction of ubiquinone of heart-muscle particles, Biochemical Journal 80 (1961) 632–635.
[17] H. Schägger, G. von Jagow, Tricine-sodium dodecyl sulphate-polyacrylamide gel electrophoresis for the separation of proteins in the range from 1 to 100 kDa, Analytical Biochemistry 166 (1987) 368–379.
[18] M.K. Khoshkbarchi, J.H. Vera, Measurements and correlation of ion activity coefficient in aqueous solutions of mixed electrolytes with a common ion, Fluid Phase Equilibria 21 (1996) 253–265.
[19] T. Morlyoshi, T. Ishli, Y. Tamai, M. Tado, Static dielectric constant of water + ethanol and water+2-methyl-2-propanol mixtures from 0.1 to 300 MPa at 298.15 K, Journal of Chemical Engineering Data 35 (1990) 17–20.
[20] C.J. Orella, D.J. Kirwan, Correlation of amino acids solubility in aqueous aliphatic alcohol solutions, Industrial & Engineering Chemical Research 30 (2) (1991) 1040–1045.
[21] N. Ni, S.H. Yalkowsky, Prediction of Setschenow constants, International Journal of Pharmaceutics 254 (2003) 167–172.
[22] B. Palecz, A. Nadolna, Heterogeneous interaction between zwitterions of some L-α-amino acids and ethanol molecule in water at 298.15 K, Fluid Phase Equilibria 250 (2006) 49–52.
[23] K.A. Thorarinsdottir, S. Arason, M. Geirsdottir, S.G. Bogason, K. Kristbergsson, Changes in myofibrillar proteins during processing of salted cod (Gadus morhua) as determined by electrophoresis and differential scanning calorimetry, Food Chemistry 77 (2002) 377–385.
[24] Solubility of proteins, in: J.S. Zayas (Ed.), Functionality of proteins in food, Chapter 1, Springer, New York, USA, 1997, pp. 1–10.
[25] P. Gagnon, T. Mayes, A. Danielsson, An adaptation of hydrophobic interaction chromatography for estimation of protein solubility optima, Journal of Pharma-ceutical and Biomedical Analysis 16 (1997) 587–592.
[26] H.O. Hultin, Y. Feng, D.W. Stanley, A re-examination of muscle protein solubility, Journal of Muscle Food 6 (2) (2007) 91–107.
[27] Concentrating solution for proteomics, in: R.J. Simpson (Ed.), Purifying proteins for proteomics, CSHL Press, New York, USA, 2004, p. 707.
[28] D.M. Smith, Protein Separation and Characterization, in: S.S. Nielsen (Ed.), Food Analysis, Springer, New York, USA, 2010, p. 264.
[29] K. Arai, A. ul Hasnain, Y. Takano, Species specificity of muscle proteins of fishes against thermal and urea denaturation, Bulletin of the Japanese Society of Scientific Fisheries 46 (2) (1976) 687–695.
[30] Chemical methods of analysis, in: B. Sivasankar (Ed.), Engineering Chemistry, McGraw-Ill, New York, USA, 2008, p. 275.