Multi-scale Assessment of Drought-Induced
Forest Dieback
Multi-scale Assessment of Drought-Induced
Forest Dieback
Tanmoy Chakraborty
[email protected]
A thesis submitted in fulfilment of the requirements for the award of
the Degree of Master of Science (Geospatial Technologies)
Dissertation supervised by:
Dr. Hanna Meyer
Co-supervisors:
Dr. Torsten Prinz
Dr. Carlos Granell
Institut für Geoinformatik der Universität Münster
February 2020
DECLARATION
I declare that this thesis entitled, “Multi-scale Assessment of Drought-Induced Forest Dieback” is the result of my own research except as cited in the references. The thesis has not been accepted for any degree and is not concurrently submitted in candidature of any other degree.
Signature:
Name: Tanmoy Chakraborty Place: Muenster, Germany Date: 24 February 2020
DEDICATION
To my beloved mother and father
AKNOWLEDGMENT
Firstly, I would like to deeply thank my supervisor, Dr. Hanna Meyer, for her valuable supervision and guidance. I would like to thank her for helping me throughout the duration of the study. Her varied input on the subject matter greatly increased its value and originality. Besides I would like to thank my Co-supervisors, Dr. Torsten Prinz and Dr. Carlos Granell. Their support and diligence on the study has helped greatly improve the study and tackle obstacles from different aspects. I would like to my offer deepest gratitude to Dr. Marco Painho for his support and assistance which has been invaluable to me. Furthermore, I would like to thank the authority of Institute for Geoinformatics (IFGI) and Westfälische Wilhelms-Universität Münster (WWU) for providing me with the resources and facilities to complete this work.
Finally, an honourable mention goes to my families and friends for supporting me in completing this project. Their continued support made me unrelenting towards my goal.
ABSTRACT
Drought has been intensified over the years and will continue to worsen due to climate change. Existing works have focused their attention on crops rather than forests. Adverse effects are felt by all flora and fauna but the impact of the recent droughts on forest ecosystems is still unknown. Greater root depth allows them to withstand the immediate impacts of drought in contrast to crops and other vegetation. This study aims to see not only the interaction between drought and forest vitality from a multi-scale and temporal viewpoint while also to detect the impact of the recent 2018/19 drought on forest vitality based on remote sensing data. The data from the German Drought Monitor was used for the area-wide estimation of drought in Germany. Vegetative indices like NDVI collected from MODIS and Sentinel 2A were used to study the interactions between drought and forest vitality. Data for both have been acquired for the years 2000-2019. A long-standing time series data was decomposed and seasonally adjusted for better cross-correlation between the variables. The cross-correlation was verified by using breakpoints estimation by dividing the data into historically observed and test data. The coniferous-dominated black forest was used as a study area for a more in-depth analysis.
Results showed that forest vitality was lowest one month after a severe drought, indicated by the highest decline in NDVI for all the forest types. This was verified using high resolution Sentinel images and the highest change does correspond to the month of January 2019. There was change in NDVI of over -0.5 for 80.63% of the entire study area. The change for each forest type was 81.74%, 54.42%, 84.14% for coniferous, broadleaved and mixed forests respectively. Two decades of NDVI and Soil Moisture Index (SMI) data along with Sentinel images for better area calculation because of higher resolution make this a highly effective approach to assess the impacts of drought on forest dieback. The methodology and data can be applied across the study area and with suitable drought indices can be used to assess the drought induced forest dieback across the globe. However, in-situ analysis with ecological considerations at the individual level could further the validity of the cross-correlations among forest types and drought.
Reproducibility self-assessment (https://osf.io/j97zp/): 3, 2, 3, 1, 3 (input data, pre-processing, methods, computational environment, results).
Table of Contents
1 Introduction ... 1
1.1 General Aspects and Related work ... 2
2 Methods and Data ... 7
2.1 Study Area ... 7
2.2 Tools ... 8
2.3 MODIS ... 8
2.4 Sentinel ... 10
2.5 Soil Moisture Index (SMI) ... 10
2.6 CORINE Land Cover (CLC) ... 11
3 Workflow ... 12
3.1 Time Series Analysis ... 12
3.2 Seasonal Adjustment ... 13
4 Results and Discussion ... 16
5.1 Cross-correlation ... 16
5.2 NDVI Comparison ... 18
5.3 Conclusion ... 21
References ... 22
List of Tables
Table 1: The list of datasets and R packages used in R v3.6.1 for processing and analysing breakpoints for the time series data to calculate the effect of drought on forest vitality .. 8 Table 2: SMI classes and their potential impacts ... 11 Table 3: Cross-correlation values of mean NDVI for coniferous, broadleaved and mixed forest against the mean SMI for 2000 to 2018. ... 16
List of Figures
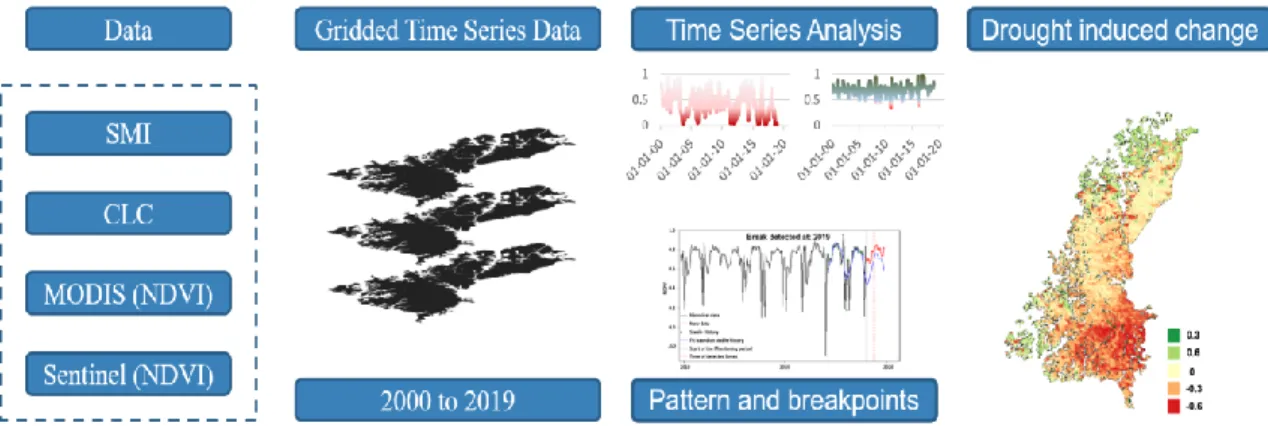
Figure 1: Drought in Germany based on the Soil Moisture Index (SMI) from 2015 to 2018 for each month. (Source: German Drought Monitor, 2018) ... 6 Figure 2: CORINE land cover (CLC) of 2018 which comprises of Coniferous, Broadleaved and Mixed forests for Germany (left) and the Study Area (Black Forest on the right) ... 7 Figure 3: MODIS data used for the study and its relative quality in terms of acceptable pixel quality on the right axis and NDVI on the left axis for 2000-2019 ... 9 Figure 4: The chart shows the mean data values for a) SMI for drought b) NDVI of Coniferous forest c) NDVI of Mixed forest and d) NDVI of Broadleaved forest in the study area with data range (0 to 1) in x and time (2000-2019) in y axis. ... 9 Figure 5: The combo chart (2000 to 2018) contains the SMI data for topsoil (up to 25cm) and total soil in the form of bars (lower the value greater the severity of drought). The mean NDVI for coniferous, broadleaved and mixed forests are in line charts for visual comparison... 10 Figure 6: The above flowchart describes the methodology of the study starting from data collection and storing SMI and NDVI data for each forest type in raster stacks and bricks. Time series analysis for each dataset is done and then calculation of change in NDVI for forest types by area. ... 12 Figure 7: Time Series Decomposition of observational mean SMI and mean NDVI for coniferous, broadleaved and mixed forests in the entire study area into trend, seasonal and random components from 2000 to 2019 ... 14 Figure 8: Seasonal adjustment of mean SMI and mean NDVI of coniferous, broadleaved and mixed forest in the entire study area for 2000-2019 which shows varied effects of drought on NDVI of forests. ... 13
Figure 9: Seasonal adjustment of mean SMI and mean NDVI of coniferous, broadleaved and mixed forest in the study area for 2000-2018 which shows the lack of immediate effect after the onset of drought. ... 15 Figure 10: Cross-correlation of mean SMI versus mean NDVI of coniferous, broadleaved and mixed forest in the study area which shows the significant negative correlation after the offset of drought. ... 16 Figure 11: Breakpoint estimation (2019-(1)) for the study area on random pixels for each forest type (coniferous, broadleaved and mixed) during the 2018 drought using 2000-2017 as historical data and new simulated data. ... 17 Figure 12: Median NDVI comparison of aggregated data from 2000 to 2019 versus difference in median NDVI of 2018 and 2019 which shows the effect of intrinsic change especially in January for the drought of 2018-2019 ... 19 Figure 13: The figure shows: (a) Mean NDVI for January from 2000 to 2019; (b) Mean NDVI of January 2019 and (c) Difference between (b) and (a) to observe the total change in NDVI for the month of January 2019 over two decades. ... 19 Figure 14: Area of change in NDVI (Percentage of total) as derived from Sentinel satellite imagery for the study for coniferous, broadleaved and mixed forest in the month of December 2018 (1st month), January 2019 (2nd month) and February 2019 (3rd month) following the offset of peak drought conditions of 2018. ... 20
1
1 Introduction
Drought is categorized as a natural hazard, but it is different from other natural hazards like Floods, Earthquake, Tropical Cyclones and Other Winds, Tsunami and Volcanoes. Other natural hazards have a set time frame, we know the onset and end of the event but that is not true in the case of droughts. Therefore, it has been termed as a “creeping phenomenon” (Tannehill, 1947). Another key difference is a standard definition to break it down into its rudimentary components (Arndt et al., 2019). Intensity, duration, and spatial coverage allow for the differentiation of droughts. There are direct and indirect impacts for drought (Wilhite et al., 2007). Direct impacts relate to forest mortality, crop yield (specific to type of crop), forest productivity, livestock and water shortages. Indirect effects are derived from the direct effects. They are much harder to quantify as they lead to loss on a socio-economic scale such as the rise of food due to low yield caused by direct impact. These effects may last even after the presence of drought has vanished. The effects vary based on the region and the population that it effects. Societal considerations also come in to play when quantifying the severity of these effects as some are more prepared or are not entirely reliant on the sectors that are affected by drought.
Tree mortality and drought-induced forest dieback are a growing concern globally. Agriculture, cropland and forest behave differently to drought. Trees tend to have a higher resistance as their roots can reach the soil deeper and water scarcity stress can be reduced. Although this does not mean that they are completely resistant. Germany’s forests are at risk due to the effects of drought. Almost a third of the country is covered by forests. The drought of 2018 intensified by the highest recorded monthly temperatures during April to July made news headlines. Approximately 90 percent of the German territory suffered under drought in August (Mühr et al., 2018). Heat and drought combined led to devastating ecological effects such as crop failures and forest dieback in Germany and has received a lot of media attention (Karlsruhe Institute of Technology, 2018). Forests are on the verge of ecological breakdown with more than a million established trees dead since 2018 as a result of drought, directly or indirectly (P. Johnson, 2019). Germany's Centre for Integrative Biodiversity reported that current trend if left unchecked will lead to areas that will leave the land barren.Therefore, the impact is long term and thus needs to be researched further (Reinermann et al., 2019). The forest ecosystem is already being deteriorated due to anthropogenic causes and this will
2
intensify as a result of climate change (Allen et al., 2010). Forest ecosystems will be hampered severely in the near future due to the intensified drought stress and the consequences may lead to serious environmental concerns (Mareike et al., 2015). Tree mortality are not only increased but also augmented due to continued effects of drought as the effects are persistent and last longer (Ganey et al., 2011). Droughts in the past years have put substantial stress on the forests and thus an increase in tree mortality and forest dieback are being observed. Tree growth among different species of trees is also a major concern due to droughts. This growth is hampered due to the accumulation of nitrogen compounds which are taken in as a result of water stress (Rouault et al., 2006). That results in more intake of nutrients from the soil and leads to increased resistance for growth in trees. Thus, coping with the varied range of impact thresholds becomes concerning and requires various strategies (Pasho et al., 2011). The forest degradation is not only limited to dieback but also the emergence of the bark beetles (Dendroctonus
frontalis) that have an easy play after the drought-induced loss in vitality of the trees.
Therefore, the environmental and habitual factors also stack up against the trees (Kolb et al., 2016). As a phenomenon that has no defined point of entry or exit and whose effects last longer than the duration of the event, drought has made itself known as one of the most devastating hazards of recent time.
1.1 General Aspects and Related work
Forest dieback or decline is an umbrella term under which tree mortality and die-off are encapsulated. It also considers death of trees in a large population (Martínez-Vilalta et al., 2012). It should also be noted that death is not the only aspect that should be considered here. There are also effects on the canopy and leaf size. The consequences reach out not only to the trees but also the water and energy balance of the region. Therefore, a variety of different published articles have touched this topic from different aspects and perspectives. The effects of drought are also defined by region, but it has been seen to be on the rise globally (Allen et al., 2010; Steinkamp et al., 2015). Drought is already a major hazard but it is being intensified by the effects of climate change and the temperature variant studies are trying to analyze the effect of climate to model forest mortality (Allen et al., 2010; Gustafson et al., 2013; N. G. McDowell et al., 2015; Williams et al., 2013). Other studies are more focused on the different species of trees and how they are influenced by drought (Allen et al., 2015; Byer et al., 2017; Ganey et al., 2011; Garrity et al., 2013; Matusick et al., 2012; N. McDowell et al., 2008; Michaelian
3
et al., 2011). These studies are very important as they opened the avenues to prevent the onset of drought and made clear that drought affects tree species differently. This provoked thinking that since different species are affected differently than it would be possible to reduce the consequences of drought by increasing the diversity in a forest ecosystem. Diversity does help in improving resistance from drought, but this was only found to be true in region specific cases and is not true for all types of mixed forests (Grossiord et al., 2014). There is also evidence based on a study of 40 drought events spread globally that larger trees suffer greatly (Bennett et al., 2015). They become more prone to risks in their growth and as a result have increased mortality. Density of forested areas should also be taken into consideration as research has found that high tree density coupled with adequate moisture is advantageous than relatively dry regions with low tree density for tree growth (Schwantes et al., 2016).
Drought monitoring and of its impact on tree vitalities have consequently gained increased attention. Global and Regional drought monitors have sprung up to analyze and forecast drought. Remote sensing has been gaining importance for the analysis of drought (Deshayes et al., 2006). It has made its mark on these kind of analysis from the contribution of information regarding damage to forests and their assessment in various articles, reports and publications (Food and Agriculture Organization of the United Nations (FAO), 2017). However, for remote sensing based analysis of drought and its impact, there is always a trade-off between resolution in terms of spatial and temporal aspects. Many studies have used MODIS for its revisit time (Byer et al., 2017; C. Cammalleri et al., 2019; Carmelo Cammalleri et al., 2019; Dorjsuren et al., 2016; Haroon et al., 2016; Kim et al., 2017; Mu et al., 2016; Orvos et al., 2015; Sánchez et al., 2016; Xulu et al., 2018). In contrast there are not many studies that have utilized high resolution imagery for the purpose of analyzing drought and its impact (Elhag et al., 2018; Garrity et al., 2013). This is due to unavailability of such high resolution images in terms of temporal attributes and being publicly available without any charge. There is always a caveat when it comes to such issues in remote sensing. According to the “Handbook of Drought Indicators and Indices, 2017” there are 10 remote sensing based indices that are suitable to observe the impact of drought. They are Enhanced Vegetation Index (EVI), Evaporative Stress Index (ESI), Normalized Difference Vegetation Index (NDVI), Temperature Condition Index (TCI), Vegetation Condition Index (VCI), Vegetation Drought Response Index (VegDRI), Vegetation Health Index (VHI), Water Requirement
4
Satisfaction Index (WRSI) and Geo-spatial WRSI, Normalized Difference Water Index (NDWI) and Land Surface Water Index (LSWI) and Soil Adjusted Vegetation Index (SAVI). Apart from SAVI, all the indices have been categorized as “green” in the handbook for their ease of use. This means that they have the following criteria: readily and freely available, data requirements are not necessary on a day-to-day basis and it accounts for missing data (Svoboda et al., 2017). Although it should be mentioned that this does not necessarily mean that are most appropriate for use which is judged by the user, applicability of the index and the region that it is to be used. Due to this many experimental, observational and in-situ studies have been conducted as well based on the indices. The observation of drought from the indices itself can be misleading especially for forest ecosystems and other resilient flora as do not feel the immediate impacts of drought. Considering all the tradeoffs between region specific drought index, Soil Moisture Index (SMI) from the German drought monitor developed by data from German Meteorological Service was used for the study (Zink et al., 2016).
Correlation among many of the aforesaid indices and other forms of meteorological and hydrological drought indices have been performed (Reinermann et al., 2019). One such meteorological drought index is the Palmer Drought Severity Index (PDSI), which was developed by Wayne Palmer in 1965 and variations of it are still one of the most widely used drought index (Xulu et al., 2018). Time series analysis has been applied to remotely sensed metrics for a variety of reasons such as tree mortality (Byer et al., 2017), trends for greening and browning (R. de Jong et al., 2011), impacts on phenology of forests (Lewinska et al., 2018) and anomaly analysis on vegetation indices (Winkler et al., 2017). Comprehensive analysis based on time series data has been done but based on linear correlation with tests of significance (Gong et al., 2017). This may have been suitable for vegetation with its region specific conditions, but the underlying hypothesis is unsuitable for forested areas. This is dependent also on the severity of drought and its duration (Williams et al., 2013). Another major aspect of time series analysis is the breakage of temporal components namely trend, seasonality and randomness. Seasonality can affect the conclusions made from observations and need to adjusted with in situ verifications if taken into account (R. de Jong et al., 2011). Therefore, seasonally adjusted or corrected data need to be produced. Forests unlike other types of vegetation do not feel the immediate impacts of drought. Therefore, the linear correlations between drought and forest vitality need to be performed with time lags and thus the use of cross-correlation.
5
Cross correlation are an effective method for achieving significant lagged correlations and this has been established by the resistance to immediate impact of forests to drought (Dorjsuren et al., 2016). Spatio-temporal characteristics can consequently provide better understanding of the underlying workings of forested areas and their impacts from drought.
The purpose of this study is to look at the impacts of the recent droughts on forests. As forests have an initial greater resilience towards droughts, the imminent effects of drought cannot be observed. Therefore, the quantification of forest dieback becomes harder. Trees tend to have a higher resistance as their roots can reach the soil deeper and water scarcity stress can be reduced (Nicolai-Shaw et al., 2017). Although this does not mean that they are completely resistant. Therefore, the impact is long term and thus needs to be researched further (Reinermann et al., 2019). A lag analysis of the vegetative indexes with the correlation of drought indices has therefore been applied to shed further light into the matter. This will lead to better understand the effects of the creeping phenomenon on the forest ecosystem. Historical data is accordingly used to enhance the quality of correlations that seem to have a lagged tendency. MODIS having a lower resolution and higher temporal revisits is used for the time series analysis and Sentinel data is used to assess how much of the impact is made thereof due to recent drought. This will improve the understanding of drought impacts and their interaction with forest ecosystem. Strengthened by climatic factors, droughts have become more common and yet do not follow a seasonal pattern. This can be seen in Figure 1. Most of the studies regarding drought are focused on the analysis of the onset and offset of the drought itself. Many indicators like SPI (Standardized Precipitation Index), SPEI (Standardized Precipitation Evapotranspiration Index), NDVI (Normalized Difference Vegetation Index), EVI (Enhanced vegetation index) and so on have been developed for this very purpose but little work has been done to see the onset of the effects of drought on forest ecosystem. Germany for example, has its own drought monitor that acts as a warning system and can be used to study the effect of drought on forest ecosystems. Drought data coupled with NDVI consisting of two decades of data each will be used in this study to correlate their relationship and assess the impact of drought on forest ecosystems. Time series analysis of drought with Vegetative Index (VI), namely NDVI, are used for investigating patterns, trends and anomalies. The key questions about how long it takes the forest ecosystem to respond to drought and consequently how much area did recent (2018-2019) drought
6
affect tree vitality in the entire study area will be shown. There are various challenges to assessing damage and loss in a forest ecosystem. Focusing on different tree vitality aspects like canopy loss or growth deceleration can lead to different conclusions. These coupled with scenarios where drought is made stronger due to warmer temperatures can lead to wrong inference on the effects of drought itself (Allen et al., 2015). The way forward therefore is to look for a condition like vegetation vitality which can be given by NDVI for a long historical overview. A reasonable baseline against which to assess dieback is lacking, and this study attempts to accomplish that.
Figure 1: Drought in Germany based on the Soil Moisture Index (SMI) from 2015 to 2018 for each month which shows the irregular pattern of drought and its spatial distribution over the years (Source: German Drought Monitor, 2018).
7
2 Methods and Data
2.1 Study Area
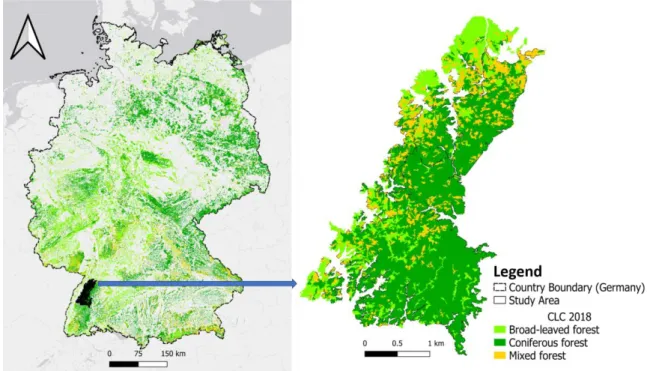
The focus of this study will be at the well-known forested mountainous area of Black Forest or Schwarzwald, located in southwest Germany and lies in the state of Baden-Württemberg (Figure 2). The forest contains dense evergreen coniferous forests along with broadleaved and mixed tree species which makes it ideal for investigating the effects of drought on different tree types. As can be seen in Figure 1, not all the parts of Germany have equal spatial pattern for drought. Drought does not follow seasonal pattern but strongly affects the location of the study area. The study area is in a location of severe drought on the third and fourth quarter of 2018. It also has the same for the fourth quarter of 2015 and 2016, and second to third quarter of 2017. Therefore, with continued exposure to drought conditions and the seemingly small area with different forest types is perfectly suited for prototyping and experimental setup of the methodology which should be applicable beyond the test area for the future.
Figure 2: CORINE land cover (CLC) of 2018 which here comprises of Coniferous, Broadleaved and Mixed forests for Germany (left) and the Study Area (Black Forest on the right) which will be used to analyse the impact of drought on forest vitality.
8
2.2 Tools
The tools used for the most part during this study has been the programming language R v3.6.1 (R Core Team, 2019) and QGIS (QGIS Development Team, 2019) for data visualization. Data used will be described in the following sections. The main motive to use R was to make the work as reproducible as possible with scope to enhance and expand the underlying methodological approach. Various packages were used to carry out pre-processing, processing and data analysis which have been referenced in Table 1.
Table 1: The list of datasets and R packages used in R v3.6.1 for processing and analysing breakpoints for the time series data to calculate the effect of drought on forest vitality
Dataset Reference
1 Soil Moisture Index (SMI) (Zink et al., 2016)
2 MOD13Q1v006 (Didan, 2015)
3 Sentinel 2 (European Space Agency, 2019)
4 CORINE land cover 2018 (Copernicus Land Monitoring Service, 2018)
R Package Reference
1 "strucchange" v1.5.2 (Zeileis et al., 2019)
2 "zoo" v1.8.6 (Zeileis et al., 2005)
3 "bfastSpatial" v0.6.3 (Dutrieux et al., 2016)
4 "raster" v3.0.7 (Hijmans, 2019)
5 "MODISTools" v1.1.0 (Koen, 2019) 6 "greenbrown" v2.4.3 (Forkel, 2017) 7 "lubridate" v1.7.4 (Spinu et al., 2018) 8 "rgdal" v1.4.8 (Bivand et al., 2019)
9 "sf" v0.8.0 (Pebesma, 2019)
2.3 MODIS
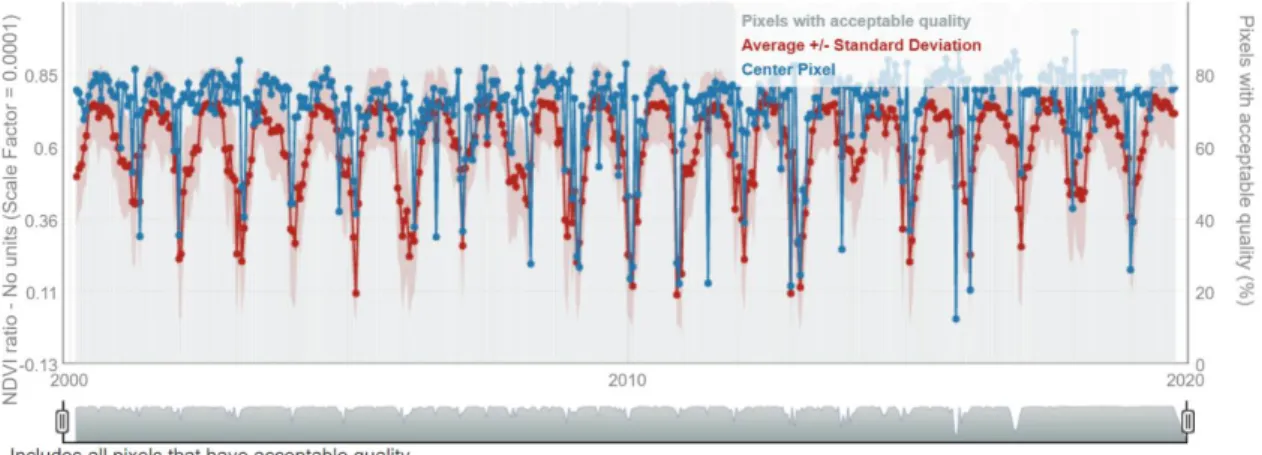
MODIS (or Moderate Resolution Imaging Spectroradiometer) is boarded on the Terra and Aqua satellites (Didan, 2015). A very large swath enables them to have a revisit time of 1-2 days. Vegetation Index namely NDVI was obtained from both the sources. The reason for choosing MODIS was the data availability with a very high temporal resolution which is essential for monitoring purposes. While the testing is done in a comparably smaller area, the use of MODIS will enable extending the present framework to the entirety of Germany. The data was downloaded via the MODIStools package in R (Tuck et al., 2014). The data product used was “MOD13Q1v006” and within it NDVI was obtained which is of 16 day composites, has a resolution of 250m and is version 6 which is better because the 16-day composites are made from two 8 day composites. The starting date of data acquisition was 2000-01-01 (yyyy-mm-dd) and the end date is 2019-12-31
9
Figure 3: MODIS data used for the entire study area and its relative quality in terms of acceptable pixel quality on the right axis and NDVI on the left axis for 2000-2019.
Figure 4: The chart shows the mean data values for a) SMI for drought b) NDVI of Coniferous forest c) NDVI of Mixed forest and d) NDVI of Broadleaved forest in the study area with data range (0 to 1) in x and time (2000-2019) in y axis.
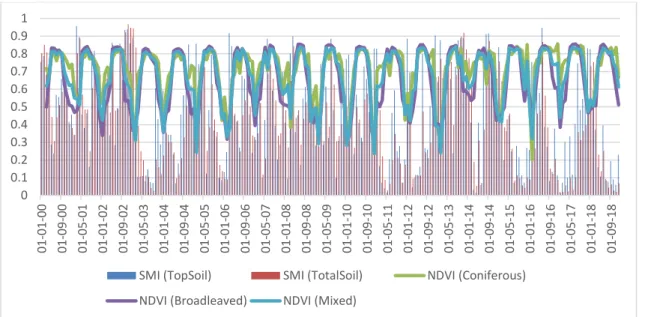
Therefore, all in all there is two decades of bi-weekly NDVI data here. Data pre-processing steps included removal of bad pixels and utilizing the quality assessment (QA) layer (pixel reliability) provided in the MODIS dataset. It was the with the help of the 16-bit QA layer that adjustments were made so that possible snow or ice and clouds were masked out from the initial dataset (Figure 3). Data was then stored as raster bricks for ease of work. The mean NDVI for each of the forest types was then calculated by using the cell statistics in the raster layers (Figure 4). Combining both the mean NDVI for all
(a) (b)
(d) (c)
10
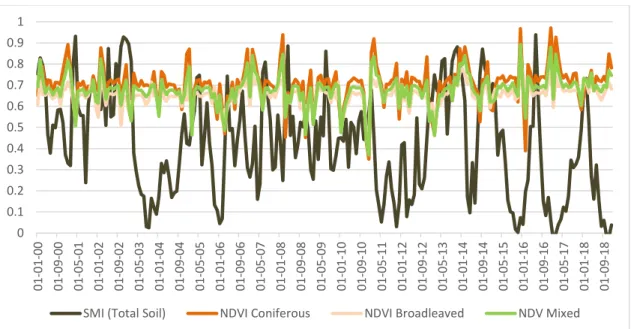
forest classes available in the study area and SMI shows no inherent change or pattern between the datasets (Figure 5).
Figure 5: The combo chart (2000 to 2018) contains the SMI data for topsoil (up to 25cm) and total soil in the form of bars (lower the value greater the severity of drought). The mean NDVI for coniferous, broadleaved and mixed forests are in line charts for visual comparison.
2.4 Sentinel
The Copernicus Sentinel 2 data is a constellation of two satellites each with a revisit time of 10 days and 5 days as a combination. The data is hosted by the European Space Agency (ESA) and can be downloaded from various sources such as the Copernicus Open Access Hub and USGS Earth Explorer. Compared to the 250m resolution data from MODIS, this dataset has a resolution of 10m, and the product level was Level-2A which provided Bottom of Atmosphere (BoA) reflectance as compared to Level-1C which provides Top of Atmosphere (ToA) reflectance. The downloaded data were monthly composites for the fourth quarter of 2018 and first quarter of 2019 of the study area, and the Mosaic Hub desktop application was used for this regard. As part of the multiscale assessment spatial considerations, Sentinel 2 data were acquired for the calculation of area with NDVI change that took place after the drought event that is being investigated.
2.5 Soil Moisture Index (SMI)
Since region specific data is very important to understand the dynamics of drought and
0 0.1 0.2 0.3 0.4 0.5 0.6 0.7 0.8 0.9 1 01-01-00 01-09 -00 01-05-01 01-01-02 01-09-02 01-05-03 01-01-04 01-09-04 01-05 -05 01-01-06 01-09-06 01-05-07 01-01-08 01-09-08 01-05-09 01-01 -10 01-09-10 01-05-11 01-01-12 01-09-12 01-05-13 01-01-14 01-09-14 01-05-15 01-01-16 01-09-16 01-05-17 01-01-18 01-09-18
SMI (TopSoil) SMI (TotalSoil) NDVI (Coniferous)
11
its impact on forests, Soil Moisture Index (SMI) was used for the purpose of this study. It is more recognized as the German drought monitor which was established in 2014. It is a simulated soil moisture which uses the mesoscale Hydrologic Model (mHM 5.0) (Samaniego et al., 2010). Properties of drought such as duration, extension, and severity are then classified as in Table 2. The spatial resolution of the gridded hydrological model is of 4x4 km2 and represent the monthly soil water quantile at every grid cell (Samaniego et al., 2013). The data was downloaded from the Helmholtz Centre for Environmental Research GmbH – UFZ website and in the form of Netcdf-format (Zink et al., 2016). It contained the SMI from the year 1951 to 2018 and had different statistics for topsoil (up to 25cm) and total soil. The data was then resampled to the MODIS 250m resolution and then applied to the study area. It should be noted here that the lower the SMI values then higher the drought severity.
Table 2: SMI classes and their potential impacts
2.6 CORINE Land Cover (CLC)
Since the study area is in Europe it made more sense to use land cover data from CORINE land cover dataset. The land cover dataset is available for the years 1990, 2000, 2006, 2012, and 2018. There is a total of 44 land cover classes. The Minimum Mapping Unit (MMU) or width are 25 hectares (ha) and 100 m for areal and linear phenomena respectively. Broad-leaved forests, Coniferous forests and Mixed forests have been considered for this study which have classification codes 311, 312 and 313 respectively.
SMI class Soil Condition Description of potential impacts
0.3 ≤ SMI ≤ 0.2 Abnormally dry Conditions before or after a preceding drought
0.2 ≤ SMI ≤ 0.1 Moderate drought Damages to crops and pastures possible 0.1 ≤ SMI ≤ 0.05 Server drought Losses in crops and pastures likely
0.05 ≤ SMI ≤ 0.02 Extreme drought High probability of major losses in crops and pastures
SMI ≤ 0.02 Exceptional
drought
High probability of exceptional losses in crops and pastures
12
3 Workflow
3.1 Time Series Analysis
SMI data had two datasets for topsoil and total soil which had been both extracted from the downloaded netcdf format into raster stacks in R. It should be noted that the SMI used for further analysis is for total soil given the length of tree roots. The data from MODIS were first downloaded as dataframes and then converted into raster layers and then into raster bricks. The time series data now contained five time series for three land cover classes of CLC and the two for SMI. The time series data had been decomposed into their respective parts and as can be seen in Figure 7. The decomposed parts are composed of trend, seasonality and randomness. This is necessary to examine the stationarity of the time series and find whether the time series for each of the dataset is additive or multiplicative. The cross-correlation between NDVI of three land cover classes with SMI were done to yield significant results about the lagged relations between the variables. The statistical analysis and all the above analysis were conducted in R. The Bfast package (Verbesselt et al., 2010) in R was also applied to the NDVI to see breakpoints after the event of the observed drought and significant observations will be shown in the results section. An overview of the entire process is also given in Figure 6.
Figure 6: The above flowchart describes the methodology of the study starting from data collection and storing SMI and NDVI data for each forest type in raster stacks and bricks. Time series analysis for each dataset is done and then calculation of change in NDVI for forest types by area.
13
3.2 Seasonal Adjustment
The time series data for each of the datasets which were decomposed were seasonally adjusted. The Bfast package in R was used to accomplish this. It disintegrates the decomposition of time series data into its primary components and breaks down the data for change detection in a time series and is not limited to remotely sensed time series data (Verbesselt et al., 2010). This was done by differencing the observed data from the seasonality component of the time series. As can be seen in Figure 8 the drought index does not follow any repetitive trend or seasonality. Seasonal adjustment helped to the get more definitive information about how the 2018 drought affected the study area. As was visually evident from the time series itself, more statistical approaches were required to reach a conclusive result. Therefore Correlation function (ACF) and Partial Auto-Correlation Function (PACF) were also carried to find significant correlations among the dataset itself but there were no significant results. One of the assumptions that is necessary to proceed with ACF and PACF is stationarity of time series. This was done with the Augmented Dickey-Fuller (ADF) and Kwiatkowski-Phillips-Schmidt-Shin (KPSS) test and both had significant results for stationarity (Kebłowski et al., 2004). The correlation between NDVI of three land cover classes with SMI were done but significant results were yet to be made and that is why Cross-correlation function (CCF) was applied to the dataset. Cross-correlation can be tricky and false assumptions can be made readily (Dean et al., 2016). Therefore, CCF was applied to the seasonally adjusted data and not on the raw non-stationary data.
Figure 7: Seasonal adjustment of mean SMI and mean NDVI of coniferous, broadleaved and mixed forest in the entire study area for 2000-2019 which shows varied effects of drought on NDVI of forests.
14
Figure 8: Time Series Decomposition of observational mean SMI and mean NDVI for coniferous, broadleaved and mixed forests in the entire study area into trend, seasonal and random components from 2000 to 2019
15
When seen individually the NDVI data of all CLC classes seem to be similar with minor change in the amplitude of the range value (0-1). The SMI value when coincided with that of the NDVI values in Figure 9, show at first glance no proper correlation on immediate impact. There are even points in time where the effect of drought is minimized due to seasonal changes, for example the extended drought period of 2011. It also shows how during the latter part of twenty-year data, drought seems to have intensified. This is the reason that the drought of 2018 will be used as the drought event to measure the effects of drought on the study area.
Figure 9: Seasonal adjustment of mean SMI and mean NDVI of coniferous, broadleaved and mixed forest in the study area for 2000-2018 which shows the lack of immediate effect after the onset of drought.
0 0.1 0.2 0.3 0.4 0.5 0.6 0.7 0.8 0.9 1 01-01-00 01-09-00 01-05-01 01-01-02 01-09-02 01-05-03 01-01-04 01-09 -04 01-05-05 01-01-06 01-09 -06 01-05-07 01-01-08 01-09-08 01-05-09 01-01-10 01-09-10 01-05-11 01-01-12 01-09-12 01-05-13 01-01-14 01-09-14 01-05-15 01-01-16 01-09-16 01-05-17 01-01-18 01-09-18
16
4 Results and Discussion
5.1 Cross-correlation
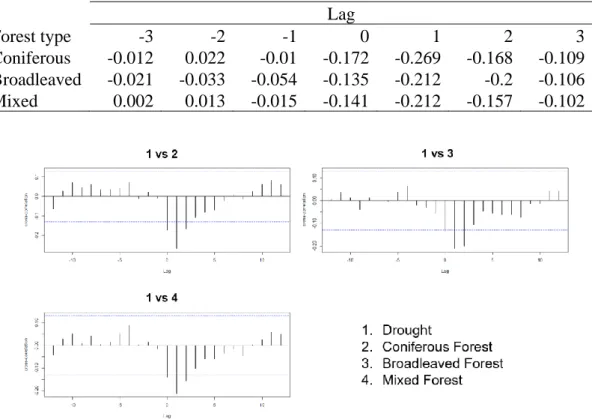
The lagged analysis between the NDVI for each of the land cover datasets and the SMI showed that negative impacts of drought are felt with time lags. This supported our initial assumption of the lagged impacts between forested areas and drought. Significant results were observed for the following three months after the severity of drought decreases. The initial change in NDVI is not as substantial as compared to the following months. This is also observed in the Figure 10 and it can be seen there are higher significance values as time progresses than the initial stage. Based on the time series analysis, there is greater impact of drought on the following months than on the initial month. This was also calculated based on the duration of the time series which suggests that the impacts are felt more on the later stages after the drought has started to decline than on the onset of drought itself.
Table 3: Cross-correlation values of mean NDVI for coniferous, broadleaved and mixed forest against the mean SMI for 2000 to 2018.
Lag
Forest type -3 -2 -1 0 1 2 3
Coniferous -0.012 0.022 -0.01 -0.172 -0.269 -0.168 -0.109
Broadleaved -0.021 -0.033 -0.054 -0.135 -0.212 -0.2 -0.106
Mixed 0.002 0.013 -0.015 -0.141 -0.212 -0.157 -0.102
Figure 10: Cross-correlation of mean SMI versus mean NDVI of coniferous, broadleaved and mixed forest in the study area which shows the significant negative correlation after the offset of drought.
17
Taking into consideration the land cover types of the study area, it is noted that the behaviour in terms of cross-correlation based on seasonally adjusted data is similar for coniferous and mixed forests but are different for broad-leaved forests. This is due to the major existence of coniferous trees even in the mixed forest population. The result is similar to that which has been obtained for the behaviour of EVI in forested area by Reinermann et al., 2019. The anomalies for observed monthly averaged EVI anomalies and pixel-based analysis of EVI exceeding two standard deviations for the years 2000– 2018 showed no similar initial impacts and therefore engaged our study into the matter. This can be thus explained with the help of the lag analysis and better understanding about forest interaction with drought stress can be clarified. It should be noted here that the results for topsoil and total soil cross correlation with the land cover types differ and is dependent on the tree species and ecological surrounding. Large forested areas and the trees that have reached adulthood have greater access to the subsurface soil and lengthier roots (Andivia et al., 2019; Devaranavadgi et al., 2010). From an ecological perspective this is of great importance and further deepens the understanding of how tree roots interact with the soil to resist the impacts of drought (Brunner et al., 2015; Leuschner et al., 2018).
Figure 11: Breakpoint estimation (2019-(1)) for the study area on random pixels for each forest type (coniferous, broadleaved and mixed) during the 2018 drought using 2000-2017 as historical data and new simulated data.
This was also verified using the Bfast package in R by searching for breakpoints on the observed historical period of 2000-2017 as can be seen in Figure 11. Test runs are
18
required for proper adjustment of the parameters (Geng et al., 2019). It allows for the calculation of breakpoints and can be run over the entire raster brick that we had created from MODIS (Verbesselt et al., 2010). This estimation gave further reliability to the lagged cross-correlation between the SMI and CLC classes.
5.2 NDVI Comparison
The results from the cross-correlation have identified the specific times when the effect of drought on the forest becomes most obvious. Based on this, the NDVI for the entire study area was different from the month following the offset of peak drought conditions. The nomenclature of the following months is 0 lag for 1st month, 1 for 2nd month and so on. As we can see in Figure 11 the month of January which is the second month after the initial drop of the 2018 drought according to the SMI values has the most abrupt change as compared to the initial month. This suggests that the month experienced severe loss in vitality. Sentinel data with a resolution of 10m for better accuracy was used for change in area calculation following the drought event of 2018. Better resolution led to more accurate results in terms of area calculation (Velpuri et al., 2009). Note that there is no conclusive evidence that this is only due to drought or already secondary effects of drought like associated ecological processes at play such as bark beetles (Kolb et al., 2016). Seasonal data has therefore been analysed and compared. Two decades of NDVI data from 2000-2019 were aggregated by month (median) and the also the years of 2018 and 2019 were extracted to get better inference (Figure 12). The relation between them suggests a seasonal variation among the long term and the immediate 2018-2019 data. Drought frequency combined with ecological factors for forest dieback at the hands of pests seem to become more common (Hendrik et al., 2017). Although this relationship may not be easily correlated depending on the species of pests and the environment (Kolb et al., 2016). The irregularity of external factors aside, when drought event occurs there is forest dieback and is increasing (Steinkamp et al., 2015). Therefore, we are focusing the effects occurred on specific points in time to infer that the dieback occurred is due to drought.
The peak values of the 2018 drought was noticed at November and December. This led us to focus our attention on the following months and as seen from the cross-correlation analysis in Figure 10, we concluded that the most abrupt change in NDVI would be seen in the month of January. Therefore, NDVI change was calculated for each of the
19
following months to till the 3rd month after the drought event of 2018.
Figure 12: Median NDVI comparison of aggregated data from 2000 to 2019 versus difference in median NDVI of 2018 and 2019 which shows the effect of intrinsic change especially in January for the drought of 2018-2019
Figure 13: The figure shows: (a) Mean NDVI for January from 2000 to 2019; (b) Mean NDVI of January 2019 and (c) Difference between (b) and (a) to observe the total change in NDVI for the month of January 2019 over two decades.
The area calculation for the NDVI change was compiled and as expected the most amount of NDVI change was observed on the month of January 2019 (Figure 13). This is evident from Table 3 where for each of the CLC classes in the study the most amount area that has highest change in NDVI is for the 2nd month. This could have been due to seasonal
effects which is why the twenty years of data from 2000-2019 helped to clear some doubts. The highest impact corresponds to the month of January with 81.74%, 54.42%,
20
84.14% for coniferous, broadleaved and mixed forests respectively (Figure 14). As can be seen in Figure 13, the amount of change in the lower left portion of the study area is concentrated the most. As to why the most change is concentrated there, needs further study and an in-situ analysis of the area. The confidence for the cross-correlation comes from the fact that seasonally adjusted time series data were used instead of the raw data. It should also be noted that the lags are different when correlated with the SMI for topsoil. That would have been the basis of consultation if the area to be investigated was vegetation other than forested area. The study relied and emphasized on the use of two decades of NDVI data for the CLC classes to reach to those inferences. As only SMI has been used because of region specific issues, more analysis into other drought indices may give further credibility to the drought resistance and effects of drought on forests.
Figure 14: Area of change in NDVI (Percentage of total in the left axis) as derived from Sentinel satellite imagery for the study for coniferous, broadleaved and mixed forest in the month of December 2018 (1st month), January 2019 (2nd month) and February 2019 (3rd month) following the offset of peak drought conditions of 2018.
0.04 81.74 15.55 2.63 0.04 0.00 0.00 20.00 40.00 60.00 80.00 100.00 -1.5 to -1.0 -1 to - 0.5 -0.5 to 0 0 to .5 0.5 to 1 1 to 1.5 Conifeorus 0.00 54.42 39.56 5.98 0.05 0.00 0.00 20.00 40.00 60.00 80.00 100.00 -1.5 to -1.0 -1 to - 0.5 -0.5 to 0 0 to .5 0.5 to 1 1 to 1.5 Broadleaved 0.03 84.14 12.46 3.37 0.01 0.00 0.00 20.00 40.00 60.00 80.00 100.00 -1.5 to -1.0 -1 to - 0.5 -0.5 to 0 0 to .5 0.5 to 1 1 to 1.5 Mixed
21
5.3 Conclusion
This study integrates the drought index for Germany with the NDVI. A myriad of studies has investigated the effects of drought on vegetation, however without much attention on forests. Therefore, with remotely sensing data and related tools, this study has derived a relation between the temporal effects of drought on three different forest types such as Coniferous, Broadleaved and Mixed forests. Taking advantage of MODIS and Sentinel, a multi-scale assessment of drought impacts was done. Summary of the results are as follows:
− 2nd month, which is of lag 1 shows the most adverse effects of drought and they
are dependent on the type of forests.
− The highest impact corresponds to the month of January with 81.74%, 54.42%, 84.14% for coniferous, broadleaved and mixed forests respectively.
− Mixed forests behaved similar to coniferous forests due to the greater concentration of coniferous trees in the mixed tree population as the study area is known for that particular trait.
− As literature explains that diversity does not necessarily increase drought resistance as different tree species are all fighting for water and are starved by water stress which might be the case for the broadleaved forests.
− The data with historical evidences also suggests an increasing drought presence and severity over the years which will be harmful for forests.
There are a few limitations which are as follows: − Lack of in situ analysis
− The time series could not have been extended to NDVI data before that because of the operational date of MODIS and Sentinel.
− Forest phenological interactions and
− Drought effects with pests which hinge on complex interactions in the habitat. Although it should be noted that all the limitations are influenced by direct and indirect impact of drought. Forest phenology is different and vary based on habitat and region which could further the merits of the study if understood better. The study accomplished to achieve a simple methodology based on time series data to analyse the impact of drought on forested area using lagged cross-correlations in conjunction with Sentinel images for area calculation of forest dieback. This can thus be used to enhance the effectiveness of the German Drought Monitor.
22
References
Allen, C. D., Breshears, D. D., & McDowell, N. G. (2015). On underestimation of global vulnerability to tree mortality and forest die-off from hotter drought in the Anthropocene. Ecosphere, 6(8), 1–55. https://doi.org/10.1890/ES15-00203.1
Allen, C. D., Macalady, A. K., Chenchouni, H., Bachelet, D., McDowell, N., Vennetier, M., Kitzberger, T., Rigling, A., Breshears, D. D., Hogg, E. H. (Ted., Gonzalez, P., Fensham, R., Zhang, Z., Castro, J., Demidova, N., Lim, J. H., Allard, G., Running, S. W., Semerci, A., & Cobb, N. (2010). A global overview of drought and heat-induced tree mortality reveals emerging climate change risks for
forests. Forest Ecology and Management, 259(4), 660–684.
https://doi.org/10.1016/j.foreco.2009.09.001
Andivia, E., Zuccarini, P., Grau, B., de Herralde, F., Villar-Salvador, P., & Savé, R. (2019). Rooting big and deep rapidly: the ecological roots of pine species distribution in southern Europe. Trees -
Structure and Function, 33(1), 293–303. https://doi.org/10.1007/s00468-018-1777-x
Arndt, & Enloe. (2019). Future Drought | Did You Know? | Monitoring References | National Centers for
Environmental Information (NCEI).
https://www.ncdc.noaa.gov/monitoring-references/dyk/future-drought
Bennett, A. C., Mcdowell, N. G., Allen, C. D., & Anderson-Teixeira, K. J. (2015). Larger trees suffer most
during drought in forests worldwide. Nature Plants, 1(September), 1–5.
https://doi.org/10.1038/nplants.2015.139
Bivand, R., Keitt, T., & Rowlingson, B. (2019). rgdal: Bindings for the “Geospatial” Data Abstraction
Library. https://cran.r-project.org/package=rgdal
Brunner, I., Herzog, C., Dawes, M. A., Arend, M., & Sperisen, C. (2015). How tree roots respond to drought. Frontiers in Plant Science, 6(JULY), 1–16. https://doi.org/10.3389/fpls.2015.00547 Byer, S., & Jin, Y. (2017). Detecting drought-induced tree mortality in Sierra Nevada forests with time
series of satellite data. Remote Sensing, 9(9), 14–17. https://doi.org/10.3390/rs9090929
Cammalleri, C., Verger, A., Lacaze, R., & Vogt, J. V. (2019). Harmonization of GEOV2 fAPAR time series through MODIS data for global drought monitoring. International Journal of Applied Earth
Observation and Geoinformation, 80(March), 1–12. https://doi.org/10.1016/j.jag.2019.03.017
Cammalleri, Carmelo, & Vogt, J. V. (2019). Non-stationarity in MODIS fAPAR time-series and its impact on operational drought detection. International Journal of Remote Sensing, 40(4), 1428–1444. https://doi.org/10.1080/01431161.2018.1524603
Copernicus Land Monitoring Service. (2018). Corine Land Cover (CLC). https://land.copernicus.eu/pan-european/corine-land-cover/clc2018
de Jong, R., de Bruin, S., de Wit, A., Schaepman, M. E., & Dent, D. L. (2011). Analysis of monotonic greening and browning trends from global NDVI time-series. Remote Sensing of Environment,
115(2), 692–702. https://doi.org/10.1016/j.rse.2010.10.011
Dean, R. T., & Dunsmuir, W. T. M. (2016). Dangers and uses of cross-correlation in analyzing time series in perception, performance, movement, and neuroscience: The importance of constructing transfer
function autoregressive models. Behavior Research Methods, 48(2), 783–802.
https://doi.org/10.3758/s13428-015-0611-2
Deshayes, M., Guyon, D., Jeanjean, H., Stach, N., Jolly, A., & Hagolle, O. (2006). The contribution of remote sensing to the assessment of drought effects in forest ecosystems. Annals of Forest Science,
63(6), 579–595. https://doi.org/10.1051/forest:2006045
Devaranavadgi, S. B., Patil, S. B., Jambagi, M. B., Wali, S. Y., & Kambrekar, D. N. (2010). Influence of
various potting mixtures on germination and root length of tree species in vertisols of northern Karnataka. 23(4), 663–664.
Didan, K. (2015). MOD13Q1 MODIS/Terra Vegetation Indices 16-Day L3 Global 250m SIN Grid V006. NASA EOSDIS Land Processes DAAC. http://doi.org/10.5067/MODIS/MOD13Q1.006. In USGS. https://doi.org/10.5067/MODIS
Dorjsuren, M., Liou, Y. A., & Cheng, C. H. (2016). Time series MODIS and in situ data analysis for Mongolia drought. Remote Sensing, 8(6), 1–16. https://doi.org/10.3390/rs8060509
Dutrieux, L., DeVries, B., & Verbesselt, J. (2016). bfastSpatial: Utilities to monitor for change on satellite
image time-series.
Elhag, K. M., & Zhang, W. (2018). Monitoring and assessment of drought focused on its impact on sorghum yield over sudan by using meteorological drought indices for the period 2001-2011. Remote Sensing,
10(8), 1–21. https://doi.org/10.3390/rs10081231
European Space Agency. (2019). Sentinel Online. https://sentinel.esa.int/web/sentinel/terms-conditions Food and Agriculture Organization of the United Nations (FAO). (2017). The Impact of disasters and crises
23
on agriculture and Food Security.
Forkel, M. (2017). greenbrown: Land Surface Phenology and Trend Analysis. https://r-forge.r-project.org/projects/greenbrown/
Ganey, J. L., & Vojta, S. C. (2011). Tree mortality in drought-stressed mixed-conifer and ponderosa pine
forests, Arizona, USA. Forest Ecology and Management, 261(1), 162–168.
https://doi.org/10.1016/j.foreco.2010.09.048
Garrity, S. R., Allen, C. D., Brumby, S. P., Gangodagamage, C., McDowell, N. G., & Cai, D. M. (2013). Quantifying tree mortality in a mixed species woodland using multitemporal high spatial resolution
satellite imagery. Remote Sensing of Environment, 129, 54–65.
https://doi.org/10.1016/j.rse.2012.10.029
Geng, L., Che, T., Wang, X., & Wang, H. (2019). Detecting spatiotemporal changes in vegetation with the BFAST model in the Qilian Mountain region during 2000-2017. Remote Sensing, 11(2). https://doi.org/10.3390/rs11020103
Gong, Z., Zhao, S., & Gu, J. (2017). Correlation analysis between vegetation coverage and climate drought conditions in North China during 2001–2013. Journal of Geographical Sciences, 27(2), 143–160. https://doi.org/10.1007/s11442-017-1369-5
Grossiord, C., Granier, A., Ratcliffe, S., Bouriaud, O., Bruelheide, H., Chećko, E., Forrester, D. I., Dawud, S. M., Finér, L., Pollastrini, M., Scherer-Lorenzen, M., Valladares, F., Bonal, D., Gessler, A., & Schlesinger, W. H. (2014). Tree diversity does not always improve resistance of forest ecosystems to drought. Proceedings of the National Academy of Sciences of the United States of America, 111(41), 14812–14815. https://doi.org/10.1073/pnas.1411970111
Gustafson, E. J., & Sturtevant, B. R. (2013). Modeling Forest Mortality Caused by Drought Stress: Implications for Climate Change. Ecosystems, 16(1), 60–74. https://doi.org/10.1007/s10021-012-9596-1
Haroon, M. A., Zhang, J., & Yao, F. (2016). Drought monitoring and performance evaluation of MODIS-based drought severity index (DSI) over Pakistan. Natural Hazards, 84(2), 1349–1366. https://doi.org/10.1007/s11069-016-2490-y
Hendrik, D., & Maxime, C. (2017). Assessing drought-driven mortality trees with physiological
process-based models. Agricultural and Forest Meteorology, 232, 279–290.
https://doi.org/10.1016/j.agrformet.2016.08.019
Hijmans, R. J. (2019). raster: Geographic Data Analysis and Modeling. https://cran.r-project.org/package=raster
Karlsruhe Institute of Technology. (2018). Drought affected about 90% of German territory in 2018.
Physics.Org, 2018(102), 1–5. https://phys.org/news/2018-09-drought-affected-german-territory.html
Kebłowski, P., & Welfe, A. (2004). The ADF-KPSS test of the joint confirmation hypothesis of unit
autoregressive root. Economics Letters, 85(2), 257–263.
https://doi.org/10.1016/j.econlet.2004.04.013
Kim, Y., Lee, S. B., Yun, H., Kim, J., & Park, Y. (2017). A drought analysis method based on modis satellite imagery and AWS data. International Geoscience and Remote Sensing Symposium
(IGARSS), 2017-July, 4862–4865. https://doi.org/10.1109/IGARSS.2017.8128092
Koen, H. (2019). MODISTools: Interface to the “MODIS Land Products Subsets” Web Services. https://cran.r-project.org/package=MODISTools
Kolb, T. E., Fettig, C. J., Ayres, M. P., Bentz, B. J., Hicke, J. A., Mathiasen, R., Stewart, J. E., & Weed, A. S. (2016). Observed and anticipated impacts of drought on forest insects and diseases in the United States. Forest Ecology and Management, 380, 321–334. https://doi.org/10.1016/j.foreco.2016.04.051 Leuschner, C., & Meier, I. C. (2018). The ecology of Central European tree species: Trait spectra, functional trade-offs, and ecological classification of adult trees. Perspectives in Plant Ecology, Evolution and
Systematics, 33(July 2017), 89–103. https://doi.org/10.1016/j.ppees.2018.05.003
Lewinska, K. E., Ivits, E., Schardt, M., & Zebisch, M. (2018). Drought impact on phenology and green biomass production of alpine mountain forest-Case study of South Tyrol 2001-2012 inspected with MODIS time series. Forests, 9(2). https://doi.org/10.3390/f9020091
Mareike, B., Walter, K., Savelsberg, J., Becker, N., Bubeck, P., Kabisch, S., Kind, C., Tempel, A., Tucci, F., Stefan, G., Fleischhauer, M., Lindner, C., Lückenkötter, J., Schonlau, M., Schmitt, H., Hurth, F., Othmer, F., Augustin, R., Becker, D., … Christian, K. (2015). Germany’s vulnerability to Climate
Change -Summary. In Umweltbundesamt.
https://www.umweltbundesamt.de/sites/default/files/medien/378/publikationen/climate_change_24 _2015_summary_vulnerabilitaet_deutschlands_gegenueber_dem_klimawandel_2.pdf
Martínez-Vilalta, J., Lloret, F., & Breshears, D. D. (2012). Drought-induced forest decline: Causes, scope and implications. Biology Letters, 8(5), 689–691. https://doi.org/10.1098/rsbl.2011.1059
24 Matusick, G., Ruthrof, K. X., & Hardy, G. S. J. (2012). Drought and Heat Triggers Sudden and Severe
Dieback in a Dominant Mediterranean-Type Woodland Species. Open Journal of Forestry, 02(04), 183–186. https://doi.org/10.4236/ojf.2012.24022
McDowell, N. G., & Allen, C. D. (2015). Darcy’s law predicts widespread forest mortality under climate warming. Nature Climate Change, 5(7), 669–672. https://doi.org/10.1038/nclimate2641
McDowell, N., Pockman, W. T., Allen, C. D., Breshears, D. D., Cobb, N., Kolb, T., Plaut, J., Sperry, J., West, A., Williams, D. G., & Yepez, E. A. (2008). Mechanisms of plant survival and mortality during drought: Why do some plants survive while others succumb to drought? New Phytologist, 178(4), 719–739. https://doi.org/10.1111/j.1469-8137.2008.02436.x
Michaelian, M., Hogg, E. H., Hall, R. J., & Arsenault, E. (2011). Massive mortality of aspen following severe drought along the southern edge of the Canadian boreal forest. Global Change Biology, 17(6), 2084–2094. https://doi.org/10.1111/j.1365-2486.2010.02357.x
Mu, Q., Zhao, M., Running, S. W., Kimball, J. S., & McDowell, N. G. (2016). Using MODIS weekly evapotranspiration to monitor drought. Remote Sensing and Modeling of Ecosystems for
Sustainability XIII, 9975(Vi), 997502. https://doi.org/10.1117/12.2237749
Mühr, B., Kubisch, S., Marx, A., Stötzer, J., Wisotzky, C., Latt, C., Siegmann, F., Glattfelder, M., Mohr, S., & Kunz, M. (2018). Dürre & Hitzewelle Sommer 2018 (Deutschland) - Report No. 1 (Vol. 2018, Issue 1).
Nicolai-Shaw, N., Zscheischler, J., Hirschi, M., Gudmundsson, L., & Seneviratne, S. I. (2017). A drought event composite analysis using satellite remote-sensing based soil moisture. Remote Sensing of
Environment, 203, 216–225. https://doi.org/10.1016/j.rse.2017.06.014
Orvos, P. I., Homonnai, V., Várai, A., Bozóki, Z., & Jánosi, I. M. (2015). Global trend analysis of the MODIS drought severity index. Geoscientific Instrumentation, Methods and Data Systems, 4(2), 189–196. https://doi.org/10.5194/gi-4-189-2015
P. Johnson, I. (2019). Germany′s forests on the verge of collapse, experts report. Deutsche Welle (DW). https://www.dw.com/en/germanys-forests-on-the-verge-of-collapse-experts-report/a-49659810 Pasho, E., Camarero, J. J., de Luis, M., & Vicente-Serrano, S. M. (2011). Impacts of drought at different
time scales on forest growth across a wide climatic gradient in north-eastern Spain. Agricultural and
Forest Meteorology, 151(12), 1800–1811. https://doi.org/10.1016/j.agrformet.2011.07.018
Pebesma, E. (2019). sf: Simple Features for R. https://cran.r-project.org/package=sf
QGIS Development Team (2019). QGIS Geographic Information System. Open Source Geospatial Foundation Project. http://qgis.osgeo.org.
R Core Team (2019). R: A language and environment for statistical computing. R Foundation for Statistical Computing, Vienna, Austria. URL https://www.R-project.org/.
Reinermann, S., Gessner, U., Asam, S., Kuenzer, C., & Dech, S. (2019a). The Effect of Droughts on Vegetation Condition in Germany: An Analysis Based on Two Decades of Satellite Earth Observation Time Series and Crop Yield Statistics. Remote Sensing, 11(15), 1783. https://doi.org/10.3390/rs11151783
Reinermann, S., Gessner, U., Asam, S., Kuenzer, C., & Dech, S. (2019b). The Effect of Droughts on Vegetation Condition in Germany: An Analysis Based on Two Decades of Satellite Earth Observation Time Series and Crop Yield Statistics. Remote Sensing, 11(15), 1783. https://doi.org/10.3390/rs11151783
Rouault, G., Candau, J. N., Lieutier, F., Nageleisen, L. M., Martin, J. C., & Warzée, N. (2006). Effects of drought and heat on forest insect populations in relation to the 2003 drought in Western Europe.
Annals of Forest Science, 63(6), 613–624. https://doi.org/10.1051/forest:2006044
Samaniego, L., Kumar, R., & Attinger, S. (2010). Multiscale parameter regionalization of a grid-based
hydrologic model at the mesoscale. Water Resources Research, 46(5), 1–25.
https://doi.org/10.1029/2008WR007327
Samaniego, L., Kumar, R., & Zink, M. (2013). Implications of parameter uncertainty on soil moisture
drought analysis in Germany. Journal of Hydrometeorology, 14(1), 47–68.
https://doi.org/10.1175/JHM-D-12-075.1
Sánchez, N., González-Zamora, Á., Piles, M., & Martínez-Fernández, J. (2016). A new Soil Moisture Agricultural Drought Index (SMADI) integrating MODIS and SMOS products: A case of study over the Iberian Peninsula. Remote Sensing, 8(4). https://doi.org/10.3390/rs8040287
Schwantes, A. M., Swenson, J. J., & Jackson, R. B. (2016). Quantifying drought-induced tree mortality in the open canopy woodlands of central Texas. Remote Sensing of Environment, 181, 54–64. https://doi.org/10.1016/j.rse.2016.03.027
Spinu, V., Grolemund, G., & Wickham, H. (2018). lubridate: Make Dealing with Dates a Little Easier. https://cran.r-project.org/package=lubridate
25
Ecology, 103(1), 31–43. https://doi.org/10.1111/1365-2745.12335
Svoboda, M., & Fuchs, B. (2017). Handbook of Drought Indicators and Indices*. In Integrated Drought
Management Tools and Guidelines Series (Issue March 2018, pp. 155–208). https://doi.org/10.1201/9781315265551-12
Tannehill, I. R. (1947). Drought, Its Causes and Effects. Journal of Farm Economics, 29(3), 779. https://doi.org/10.2307/1232917
Tuck, S. L., Phillips, H. R. P., Hintzen, R. E., Scharlemann, J. P. W., Purvis, A., & Hudson, L. N. (2014). MODISTools - downloading and processing MODIS remotely sensed data in R. Ecology and
Evolution, 4(24), 4658–4668. https://doi.org/10.1002/ece3.1273
Velpuri, N. M., Thenkabail, P. S., Gumma, M. K., Biradar, C., Dheeravath, V., Noojipady, P., & Yuanjie, L. (2009). Influence of resolution in irrigated area mapping and area estimation. Photogrammetric
Engineering and Remote Sensing, 75(12), 1383–1395. https://doi.org/10.14358/PERS.75.12.1383
Verbesselt, J., Hyndman, R., Newnham, G., & Culvenor, D. (2010). Detecting trend and seasonal changes in satellite image time series. Remote Sensing of Environment, 114(1), 106–115. https://doi.org/10.1016/j.rse.2009.08.014
Wilhite, D. A., Svoboda, M. D., & Hayes, M. J. (2007). Understanding the complex impacts of drought: A key to enhancing drought mitigation and preparedness. Water Resources Management, 21(5), 763– 774. https://doi.org/10.1007/s11269-006-9076-5
Williams, A. P., Allen, C. D., Macalady, A. K., Griffin, D., Woodhouse, C. A., Meko, D. M., Swetnam, T. W., Rauscher, S. A., Seager, R., Grissino-Mayer, H. D., Dean, J. S., Cook, E. R., Gangodagamage, C., Cai, M., & Mcdowell, N. G. (2013). Temperature as a potent driver of regional forest drought
stress and tree mortality. Nature Climate Change, 3(3), 292–297.
https://doi.org/10.1038/nclimate1693
Winkler, K., Gessner, U., & Hochschild, V. (2017). Identifying droughts affecting agriculture in Africa based on remote sensing time series between 2000-2016: Rainfall anomalies and vegetation condition in the context of ENSO. Remote Sensing, 9(8). https://doi.org/10.3390/rs9080831
Xulu, S., Peerbhay, K., Gebreslasie, M., & Ismail, R. (2018). Drought influence on forest plantations in Zululand, South Africa, using MODIS time series and climate data. Forests, 9(9), 1–15. https://doi.org/10.3390/f9090528
Zeileis, A., & Grothendieck, G. (2005). zoo: S3 Infrastructure for Regular and Irregular Time Series.
Journal of Statistical Software, 14(6), 1–27. https://doi.org/10.18637/jss.v014.i06
Zeileis, A., Leisch, F., Hornik, K., & Kleiber, C. (2019). strucchange: Testing, Monitoring, and Dating
Structural Changes. https://cran.r-project.org/package=strucchange
Zink, M., Samaniego, L., Kumar, R., Thober, S., Mai, J., Schafer, D., & Marx, A. (2016). The German drought monitor. Environmental Research Letters, 11(7). https://doi.org/10.1088/1748-9326/11/7/074002