Departamento de Eletrónica, Telecomunicações e Informática (DETI)
Ricardo Jorge Amaral Nestler
Desenvolvimento de um Protótipo para Colheita Automática de Plantas
Automatic Medicinal and Aromatic Plants Harvester Robot Prototype
Departamento de Eletrónica, Telecomunicações e Informática (DETI)Ricardo Jorge Amaral Nestler
Desenvolvimento de um Protótipo para Colheita Automática de Plantas
Aromáticas
Automatic Medicinal and Aromatic Plants Harvester Robot Prototype
Development
Aveiro 2018
Departamento de Eletrónica, Telecomunicações e Informática (DETI)
Desenvolvimento de um Protótipo para Colheita Automática de Plantas
Universidade de Aveiro 2018
Departamento de Eletrónica, Telecomunicações e Informática (DETI)
Ricardo Jorge Amaral
Nestler
Desenvolvimento de um Protótipo para Colheita
Automática de Plantas Aromáticas
Automatic Medicinal and Aromatic Plants Harvester
Robot Prototype Development
Dissertação apresentada à Universidade de Aveiro para cumprimento dos requisitos necessários à obtenção do grau de Mestre em Engenharia
Electrónica e Telecomunicações, realizada sob supervisão científica do Doutor Paulo Bacelar Reis Pedreiras, Professor Auxiliar da Universidade de Aveiro, e do Doutor Manuel Bernardo Salvador Cunha, Professor Auxiliar da
Universidade de Aveiro.
Dissertation submitted to the University of Aveiro in fulfillment of the
requirements for the degree of Master in Electronics and Telecommunications Engineering, under the supervision of Doctor Paulo Bacelar Reis Pedreiras, Assistant Professor at the University of Aveiro, and co-supervision of Doctor Manuel Bernardo Salvador Cunha, Assistant Professor at the University of Aveiro.
I dedicate this work to my family and close people around me that supported me during this work. I want to dedicate this work to myself that contributed to my personal happiness and success in life and therefore to the future people connected to me.
júri / Jury
Presidente / President Prof. Doutor Pedro Nicolau Faria da Fonseca Assistant Professor, University of Aveiro
Vogais / Examiners Committee
Prof. Doutor Paulo Bacelar Reis Pedreiras Assistant Professor, University of Aveiro (supervisor)
Luis Miguel Pinho de Almeida
Associate Professor, Faculty of Engineering, University of Oporto (Opponent)
Agradecimentos
Acknowledgments
Em primeiro lugar quero agradecer aos meus orientadores, Paulo Pedreiras e Bernardo Cunha, por aceitarem o desafio de me guiar nesse processo. Quero dar meu especial agradecimento ao meu orientador Paulo Pedreiras, que foi muito dedicado e acompanhou todo o desenvolvimento com muito apoio e paciência.
Quero agradecer a minha família, que me apoiou durante todo este processo. Quero também expressar minha gratidão à minha namorada que, só por existir, me motivou bastante.
Através deste trabalho aprendi muito sobre a profissão da Engenharia, sobre a vida e sobre mim mesmo. Aprendi como muitos dos conteúdos que foram ensinados ao longo do curso são realmente importantes na prática da Engenharia. Aprendi também muito sobre o controlo das emoções, prazos, estimativa de carga de trabalho e sobre o valor do trabalho duro.
O trabalho apresentado é uma porta de entrada para o que espero venha a ser o meu futuro sucesso pessoal e profissional.
First of all I want to thank for my advisors Paulo Pedreiras and Bernardo Cunha for accepting the challenge of guiding me through this process. I want to give my special gratitude to my advisor Paulo Pedreiras whom was very dedicated to the project and followed the development very closely with much support and patience.
I want to give my thanks to my family that supported me throughout work time. I want to express my gratefulness to my girlfriend that just for existing
motivated me a lot.
Through this work I learned a lot about the technical professional concepts, about life and myself. I learned how many of the content that was taught through the course along the years actually works in practice. I learned much about emotions mastery, workload estimation deadlines for plans and about an increased value of hard work.
Palavras chave:
Keywords
Colheita de ervas aromáticas, Eletrónica, Reconhecimento de Imagem, PAM (Plantas Aromáticas e Medicinais), robô agrícola
Tea harvesting, Electronics, Image recognition, MAP (Medicinal and Aromatic Plants), agricultural robot.
Resumo
Abstract
Este trabalho tem como objetivo desenvolver um protótipo para automatizar o processo de colheita de plantas medicinais e aromáticas. Atualmente existem algumas soluções para este propósito, mas estas apresentam muitas
limitações. Assim, o objetivo deste projeto é criar uma solução mais inteligente para o problema. A principal capacidade deste robô é reconhecer a posição das plantas e colocar um dispositivo de corte, acoplado a uma ponte de 3 eixos, no centro da planta, para realizar a colheita.
Esta dissertação relata o desenvolvimento do protótipo, desde o projeto da sua estrutura mecânica até os resultados finais, passando pelos circuitos
eletrónicos e software.
This work aims at developing a prototype for automating the harvesting process of medicinal and aromatic plants. Currently there are some solutions for this purpose, but they have many limitations. The goal of this project is to create a smarter solution for the problem. This robot’s key capability is to recognize the plants positions and position a robotic 3-axis-bridge pointer on the center of the plant for harvesting.
This project follows the prototype development from its physical structure up to the final results, going through the electronics circuit and software.
i
Index
1. Introduction ... 1 1.1 Mediterranean Aromatics ... 1 1.2 Motivations ... 2 1.3 Thesis Overview ... 5 2. Related Work ... 72.1 Commercial Solutions Review ... 7
2.2 Related Solutions Review ... 9
2.3 Evaluation ... 13
2.4 Control Systems... 14
2.4.1 PID controller ... 15
2.5 DC Motor ... 17
2.6 H-bridge... 19
2.7 Control of the DC Motor with PWM ... 20
2.8 Encoders for DC Motors... 20
2.9 Servo Motors ... 21
2.10 Classification and interpretation methods in image recognition ... 22
2.10.1 Statistical based analysis - Bayesian Classifier ... 22
2.11 Edge detection filters ... 24
2.12 Hough Transform ... 26
2.13 Precision and accuracy ... 28
ii
3.1 Block specification and functionality ... 32
4. Implementation ... 34
4.1 Physical Structure ... 35
4.2 Electronic Circuit... 38
4.3 Software... 41
4.3.1 Communication between the PC and micro-controller through UART... 42
4.3.2 Timers setup and PWM generation ... 44
4.3.3 Encoder position reading ... 46
4.3.4 Axis motors controllers ... 47
4.3.5 Pixel classification and training ... 47
4.3.6 Image recognition – progress development ... 49
4.3.7 Image recognition – implemented ... 53
4.3.8 High level program (Top view) ... 57
4.3.9 Alignment recognition ... 62
5. Results and Analysis... 64
5.1 Buffer explicit example results ... 64
5.2 Direction servo motors ... 67
5.3 DC motor for the robot’s traction movement ... 71
5.4 Axis length according to encoder’s pulses ... 73
5.5 Controllers and axis motors ... 73
5.6 3-axis-bridge specification ... 79
5.7 Image recognition – shape validation ... 84
5.8 Image recognition – results with loaded images ... 87
5.9 Image recognition – results on robot version 1 ... 88
5.10 Image recognition – results on robot version 2 ... 91
5.11 Visual odometry – motion tracking ... 95
5.12 Image recognition – time efficiency ... 96
5.13 Alignment Recognition... 97
iii
iv
List of figures
Figure 1: Lime-Thyme on the field ... 3
Figure 2: A vertical cut view of the shape of the result of a usual machine ... 4
Figure 3: A vertical cut view of the shape of the result of a harvest by hand work or the presented machine .. 4
Figure 4: Two Man plucking Machine, by NCC ... 8
Figure 5: MAP harvesting machine by McLeça ... 9
Figure 6: Basic design of the robotic arm developed in the MAGALI Project [9] ... 10
Figure 7: General system scheme concept of the harvester Agribot.[14] ... 12
Figure 8: HSV model: hue (H), saturation (S), Value (V) ... 13
Figure 9: Open loop concept model [19] ... 14
Figure 10: Close loop concept model [19] ... 15
Figure 11: PID controller diagram... 16
Figure 12: Schematics of a DC motor [20] ... 18
Figure 13: DC motor concept [21] ... 18
Figure 14: Electric diagram of an H-bridge, in the rest position (left), in the two possible active positions (others) [23] ... 19
Figure 15: Representation of the signal on the two channels in the two different directions [22] ... 21
Figure 16: Posterior probabilities functions representation for class W1 and W2 given a dataset x [24] ... 24
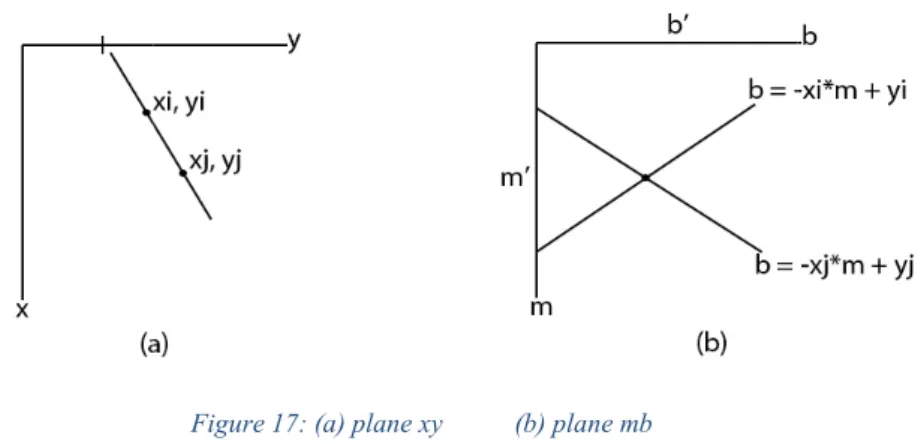
Figure 17: (a) plane xy (b) plane mb ... 27
Figure 18: Image domain representation of xcosθ + ysinθ = ρ [25] ... 27
Figure 19: Standard deviation plot [27] ... 28
Figure 20: System Architecture Top-View ... 31
Figure 21: Systems Architecture ... 33
Figure 22: General Central decision making block’s data flowchart... 33
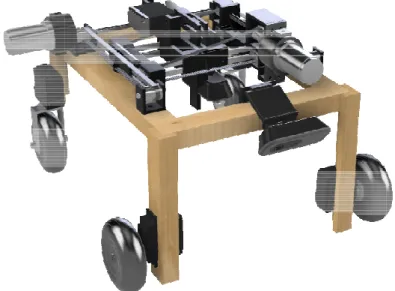
Figure 23: Prototype Model ... 34
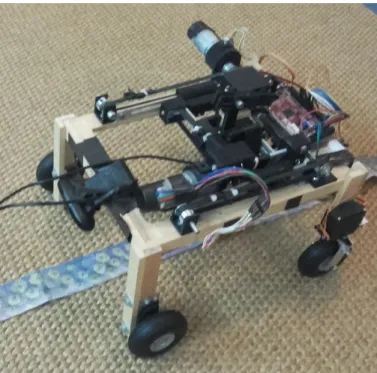
Figure 24: Picture of the prototype on a printed line of plants ... 35
Figure 25: Base structure with the moving motors ... 36
Figure 26: 3 axis bridge structure ... 37
v
Figure 28: y axis structure of the 3 axis bridge ... 38
Figure 29: Electric diagram of the overall circuit ... 39
Figure 30: Full-H driver H-bridge configuration with fast diodes in reverse conduction ... 40
Figure 31: Encoder output circuit ... 41
Figure 32: TCST 2103 top view scheme ... 41
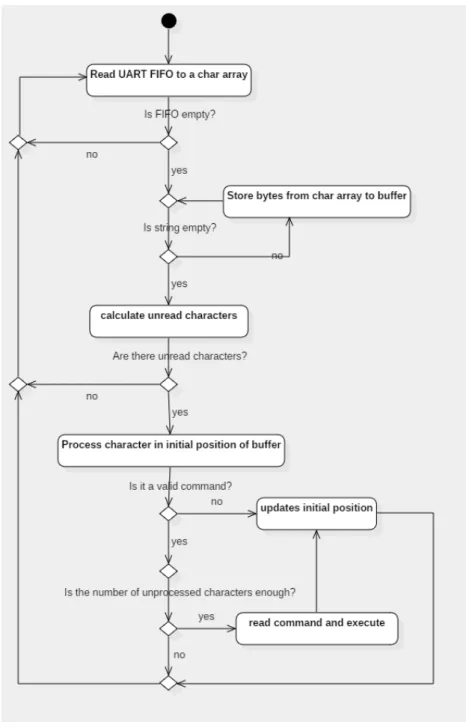
Figure 33: Buffer representation with the initial and final pointers ... 43
Figure 34: Activity diagram of the buffer management (UML) ... 44
Figure 35: Illustration of the PWM states ... 46
Figure 36: Pixel classification through Sobel filters ... 48
Figure 37: Comparation of the different classifiers ... 49
Figure 38: Bayes classifier data flowchart (UML) ... 49
Figure 39: Centers detection ... 50
Figure 40: Peaks of overlapping rate ... 50
Figure 41: Starting image ... 51
Figure 42: Analysis of a blobs shape in a valid plant case ... 52
Figure 43: Circles recognition through Hough transform ... 52
Figure 44: Combination of the Hough transform with the developed shape validation system ... 53
Figure 45: Blob centralization ... 54
Figure 46: Blob clearing, case 1 ... 54
Figure 47: Blob clearing, case 2 ... 54
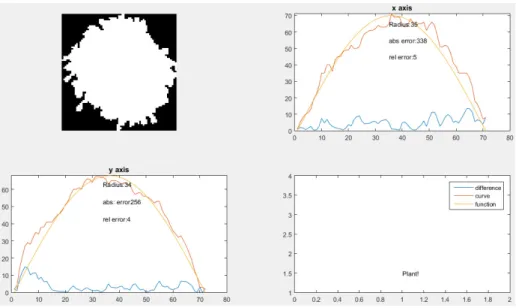
Figure 48: Absolute error function computing, x axis on the left and y axis on the right ... 55
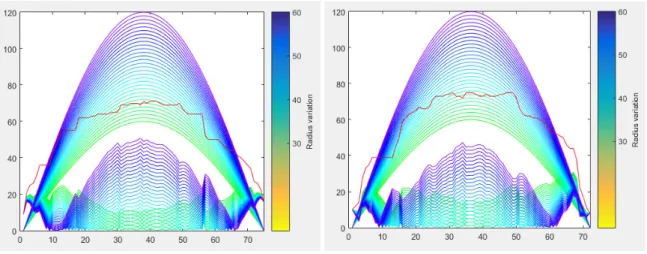
Figure 49: Radius likelihood function, x axis on the left and y axis on the right ... 55
Figure 50: Analysis of a blobs shape ... 56
Figure 51: Circle conflict example, case 1 ... 56
Figure 52: Circle conflict example, case 2 ... 57
Figure 53: Scheme of the first solution for the camera position and mapping idea (top view) ... 58
Figure 54: Simulation of the mapping algorithm with compiled loaded picture part 1 ... 58
Figure 55: simulation of the mapping algorithm with compiled loaded picture part 2 ... 58
Figure 56: Simulation of the algorithm with loaded actual pictures from the robot on the printed plants ... 59
Figure 57: Scheme for the second solution for the camera position (top view) ... 59
Figure 58: High level main program activity diagram (UML) ... 61
Figure 59: Classified image for alignment recognition ... 62
Figure 60: The plot of one line values of a classified image ... 63
Figure 61: Demonstration of the array with the largest peaks ... 63
Figure 62: Original image with the recognized alignment drew with a white line and the real in grey ... 63
Figure 63: Buffer management example 1 ... 65
vi
Figure 65: Buffer management example 3 ... 67
Figure 66: Setup of the measurements of the servo’s angle ... 68
Figure 67: Resulted paper sheet with all the measurements for the left side servo motor ... 69
Figure 68: Graph of the angle with standard deviation error for impulse width for left side servo motor ... 69
Figure 69: Standard deviation graph for left side servo ... 70
Figure 70: Resulted paper sheet with all the measurements for the right side servo motor ... 70
Figure 71: Graph of the angle with standard deviation error for impulse width for right side servo motor .... 70
Figure 72:Standard deviation graph for right side servo ... 71
Figure 73: Graph relating the duty cycle of the signal and motor’s speed and voltage for the right motor ... 72
Figure 74: Graph relating the duty cycle of the signal and motor’s speed and voltage for the left motor ... 72
Figure 75: Graph comparing the speed of both motors in relation to the average applied voltage ... 73
Figure 76: Motor’s response to for a movement of 4, 10 and 100 counts, respectively, for proportional controller with gain of 3 ... 74
Figure 77: Motor’s response to for a movement of 4, 10 and 100 counts, respectively, for proportional controller with gain of 6 ... 75
Figure 78: motor’s response for the parameters K=4, ti=0.02, y=10, wd=10 ... 75
Figure 79: motor’s response for the parameters K=4, ti=0.09, y=10, no wd ... 76
Figure 80: Motor’s response for the parameters K=4, Ti= 0.09, wd=5 ... 77
Figure 81: x axis motor motion/time statistics ... 78
Figure 82: y axis motor motion/time statistics ... 78
Figure 83: Motor response curve in two different cases ... 79
Figure 84: Setup for the 3-axis-bridge measurements ... 79
Figure 85: Picture to study the components relations pixel-millimeter and coordinate-millimeter ... 80
Figure 86: Measurements results for pixel-mm relation ... 80
Figure 87: Measured coord-mm relation ... 82
Figure 88: Standard deviation for axis x measurements ... 82
Figure 89: Standard deviation for y axis measurements ... 83
Figure 90: Millimeter sheet used for the coordinates validation ... 84
Figure 91: Precision (SD) vs Accuracy for x axis ... 84
Figure 92: Precision (SD) vs Accuracy for y axis ... 84
Figure 93: Analysis of a blobs shape in an invalid small plant case ... 85
Figure 94: Analysis of a blobs shape in an invalid plant case ... 86
Figure 95: Analysis of a blobs shape in a false negative case ... 86
Figure 96 Image recognition results example 1 ... 87
Figure 97: Image recognition results example 2 ... 88
Figure 98: Image recognition results example 3 ... 88
vii
Figure 100: Printed images with plants used for recognition ... 89
Figure 101: Setup for the accuracy measurements ... 90
Figure 102: Sheet’s segment with the recognized results ... 91
Figure 103: Histogram of x and y axis accuracy errors ... 91
Figure 104: Histogram of absolute accuracy error ... 91
Figure 105: Setup for the final precision and accuracy results ... 92
Figure 106: Program recognition results display example ... 92
Figure 107: Comparation of the recognition and pixel classification between normal lab brightness and extra brightness conditions ... 93
Figure 108: Histogram of x and y axis accuracy errors ... 94
Figure 109: Histogram of absolute accuracy error ... 95
Figure 110: Accumulative motion measurements of visual odometry ... 96
Figure 111: Accumulative motion measurements of visual odometry measurements... 96
Figure 112: Line’s offset ‘b’ vs slope ... 97
Figure 113: Angle correction example. ... 98
Figure 114: Recognized corrected angle (alignment) vs Accuracy error ... 99
1
1. Introduction
Agricultural machinery to improve agricultural efficiency is a theme that has been going on for many centuries, and nowadays the kind of machinery tends to develop towards automatization of the tasks. There are many kinds of machinery involved in agriculture from the simplest to the most advanced and intelligent. There are different areas where machinery can be applied in the process of farming [1,2]:
• Preparing the soil (ploughing, levelling and applying fertilizers); • Fertilizing and Pest control;
• Irrigation;
• Planting/seed sowing;
• Weeding – removal of unwanted plants; • Harvesting;
• Crop Selection – Crop Sorter; • Storage.
This work focuses on the harvesting automatization process of Medicinal and Aromatic Plants (MAP). There is a vast amount of work on harvesting automation solution for plants such as: wheat, potatoes, grapes, rice, sugarcane, corn, carrots, olives, strawberries, tomatoes, apple, orange, etc. Some of these cultures require simpler solutions, while other impose more complex ones. The machine studied in this dissertation is designed for automatic aromatics harvesting.
1.1 Mediterranean Aromatics
Aromatics is the term used for plants with an aromatic propriety that can be used in different fields such as medicine, food, tea and hygiene products. The most produced cultures in the European region are the Mediterranean cultures [3]. In Portugal the main Mediterranean cultures are Pepper mint, lemon verbena, lemon balm, thyme, lemon thyme, and savory. There is a big diversity between farmers that grow other kinds
2
of plants such as: basil, rosemary, oregano, stevia, salvia/saves, mint, Thymus mastichina, tarragon, marjoram, prince herb, pennyroyal, Urtica dioica, Calendula officialis, Gomphrena globosa, Echinacea purpurea, Agastache foeniculum, Agrimonia eupatoria, Lavanda, Althaea, Ocimum basilicum.
Aromatics and Medicinal plant farmers use machinery, manual human labor or, more often, a combination of both. In Portugal, the class of plants addressed in this study are usually harvested from the mid of spring until mid of autumn, because they need warm and dry weather to grow.
1.2 Motivations
To have notion of the market size, in the European Union (EU), medicinal and aromatic plants are cultivated on an estimated total area of 70000ha. In 2012 the global trade value was of 102 billion Euros, compared with 173 billion of agricultural products in America, Europe, Brazil and Canada. Germany imported 65000 tons for 201 million Euros. Spain imported 18000 tons of MAPs for 51 million Euros and exported 14500 tons. France imported 19000 tons for 78 million Euros [6].
In a typical Portuguese harvesting day, because of the weather conditions, the work must start in the early morning, between 6-8 am depending on the season. Starting so early allows to get the most profitability from worker payday because after a certain time of the day it become unbearable to carry out manual work at the plantations, especially in the summer, where the temperatures frequently reach 40ºC at the peak in the South of Portugal and 30ºC in the North. In the north the air is a little more humid, giving similar sensation as in the south when it is hot. After harvesting, the workers have to put the harvested branches in boxes or treadmills to let them dry in a greenhouse or a warehouse. There is usually no need for an electric dry system and most of the producer don’t have one. Opening the spaces during the day to let the air ventilate the herbs is enough. Before entering in the economic perspective, first let’s take a look at the plant’s biological and quality benefits.
Whether a producer has any kind of machines or not, he has to divide the work in two parts during the day, that may be executed in parallel or alternate. One part consists in harvesting the plants, either using machines or manually. The other part of the work consists in organizing the branches in a warehouse to dry. Nowadays there are many kinds of plants that still have to be harvested by handwork, to be harvested properly. Currently available machines are too rough, cutting these delicate plants in a way where there is too much waste of green matter, while making it hard for the plant to restore itself again for the next harvest. As such, the best way is still use handwork for harvesting.
The diversity of plants is a challenge for automation, as each plant has its size and form. Moreover, some of these aromatics are extremely delicate.
Let’s take the example of lime-thyme, which is a much-appreciated plant and it is also one of the top cultures in Portugal, for explaining the importance of the way in which plants are harvested. Figure 1 shows a photo of Lime-Thyme plants on the field and Figure 2 illustrates the comparison of a vertical cut view of the plant
3
before and after being harvested by a typical machine. In an analysis of the state of the plant before the cut, it can be seen that it gets sunlight from every side and it naturally grows uniformly. After the cut we notice that a vital part of the plant was removed, thus it will take much longer to recover. This happens because the remaining branches, that take energy and carry nutrients from the roots to the leaves, are farther away from the center. Right after the cut the plant still has to feed the side branches so they don’t dry and at the same time it has to quickly protect the exposed center from the heavy sunlight that dries it.
Figure 3 compares the shape of a vertical cut before and after a harvest by a worker or by the machine described in this work. This is the optimal scenario, where the plant is cut uniformly so it can grow uniformly again right after the cut. It can apply the energy uniformly, so it grows faster. That way the center of the plant is always protected from the sun, so the plant’s health is better and consequently maintain the quality of the leaves.
For the case of ground plants, this difference has an even higher impact because, as the name suggests, ground plants don’t grow much in high but instead on the ground. There is a great amount of damage and waste if they are cut horizontally, because the branches that are stick to the ground will cover the floor and the plant will stop growing as fast, as they are most likely to dry, to get old and will constantly get unprotected from the sun after each harvest.
In case of the plants that grow more vertically, the impact is not so relevant, therefore this machine has also a module to cut it horizontally when it is needed.
4
Figure 2: A vertical cut view of the shape of the result of a usual machine
Figure 3: A vertical cut view of the shape of the result of a harvest by hand work or the presented machine Finally, let’s get into the economic evaluation.
For this thesis there was a previous study about the costs and gains around the aromatics business for the plants Verbena and Lime Thyme. The source of the information comes from some Portuguese aromatics reports through a questionnaire that was sent to all the aromatics farmers registered in the EPAM Portuguese website, which got a reply rate of 15%. The content of some of the replies was conclusive enough to perceive that using machines in the harvesting process makes the whole process more efficient and economically viable. Assuming that the costs of each worker is six euros per hour, which is a common value that includes the social insurance too in Portugal, then the average harvesting cost using machines is 0.8 €/Kg and without machines is 1 €/Kg. Similar results appear for the study of the Thyme Lyme culture. For the study of this culture the results of the questionnaire where inconclusive and therefore the data was gathered from one specific plantation, with much detail. The direct conclusions about the economic perspective where that with manual labor the harvesting costs are 1.1 €/Kg without machines and 0.5 €/Kg with machines. This data was taken from a part of the field that is always harvested with a machine, corresponding to the other data from a part of the field that is always harvested with manual labor. Both parts of the field are directly connected with the same conditions of water, lightening and wind. It is obvious that the use of the machines improves the efficiency of the harvesting process significantly, so we can wonder why such a big difference on harvesting cost boils down to a so modest difference in what regards the overall gain. The answer lies in the plant’s growing explanation previously described. The plants harvested by hand grow much healthier, with better quality and faster. That means that one area harvested with hand labor results in a larger outcome of good green quality material. A specific study to verify this fact was also made and reported. The study was
5
conducted in an aromatics field in south Portugal. It consisted in the analysis of the data of some typical harvests of Thyme Lime. The data documented was the number of plants harvested, weight of the plants and the harvest method for each harvest. The total number of plants harvested were 798 by hand and 5994 with machine, in this study. The conclusion was that in the same conditions the plants harvested with a machine had in average 12g per plant available to harvest, while the others had around 16g per plant. A 4g of difference does not seem too much, but in proportion to the collected material, these 4g represent 33% of the 12g plant. There is another interesting fact in this particular regard. Since the manually harvested plants grow healthier and faster, the farmer can even have the possibility to make an extra entire harvest during one year and gain much more profitability from the field. One field can have between two to 5 harvests per year, depending on many factors.
Considering the above discussion, the aim set for the final version of the robot designed in the scope of this dissertation is to combine the benefits and advantages of manual labor harvesting with the ones that a machine can provide, creating an innovative solution for the harvesting process of aromatic and medicinal plants, especially the most delicate ones, such as Thyme Lyme. This robot is an intelligent machine with the ability to simulate the manual cut in the harvesting process.
1.3 Thesis Overview
This project is about the development and study of a prototype of a real machine, realized in a reduced scale. The purpose of this small scale prototype is to develop the basic individual components and make a proof of concept of the machine and its different components.
The structure of this thesis starts with the motivation and market study economic perspective, presented in section “Motivations”. This section studies the reasons for developing this projects in order to justify it. Before developing something in any area is important to know what alternative solutions exist in the market The Related Work section presents a review of the various existing solutions on the current market place, in the “Commercial Solutions Review” subsection. The “Related solution review” subsection presents a review of some of the most significant solutions for other kinds of cultures, mainly for fruits. The projects chosen to be covered here are according to the degree of innovation that they brought and the level of the systems intelligence. Thus, this section does not cover pure mechanical solutions.
Section “Basic concepts” explains with detail how the various concepts work. The concepts that were chosen to be covered are the ones that are key components in the development of the prototype. It is important to understand how the various components work conceptually, because they are the technical principles for the development.
6
Section “Systems Architecture” describes the top view systems architecture of the prototype. By separating the different main components it is possible to get an overview of the system parts. It is important to understand how it works as a whole to be able to understand the development process in the next section. Section “Implementation” details the development process, starting from the initial basic physical structure, to the electronic circuitry and finally to the software. It covers also the intermediate development steps and failures. This is the most technical practical part of the project, as here it covers the actual technical problems and solutions.
It follows the “Results and Analysis” section, that in some sense extends the implementation section. While on the implementation section only covers the development progress and main results, this section covers all the additional results that helped to take the corresponding development decisions during the implementation. It is here where the importance of this section lies on. When a problem appears, there is an idea to solve the problem, then the solution is designed implemented and tested. During the testing phase there are results that are analyzed in order to validate the solution.
Finally comes the “Conclusions” section, where there is a review of what the robot capable of, its limitations and possible further developments. This section covers the review of the final perspective about the robot’s working state. Two types of future developments are covered, one related to the current prototype limitations, while the second addresses late development possibilities and expansions.
Right at the end there is a list of bibliographic references, which are the main source of knowledge to write the thesis.
2. Related Work
2.1 Commercial Solutions Review
Currently there are diverse companies worldwide that provide machinery for automated aromatic and medicinal plant harvesting. They are well known in this sector and the products they provide are effective, resulting in economic benefits to the farmers. Some of these companies develop
by themselves, from the machine mechanical parts to the software. In general these companies build other kinds of machines, such as planting machines, tree pruning machines (resizing in pyramid, cone and round shape), soil treatment, fertilization, etc. About the tea harvesting machines some are hand
self-propelling ones.
Table 1 shows some of the more important companies that are present in this market, as well as the type of machinery they manufacture. The prices of the machines vary between 5000
Company Name
New Century
Corporation
MCLeça
Euro Prima
7Related Work
Commercial Solutions Review
ompanies worldwide that provide machinery for automated aromatic and medicinal plant harvesting. They are well known in this sector and the products they provide are effective, resulting in economic benefits to the farmers. Some of these companies develop and manufacture everything by themselves, from the machine mechanical parts to the software. In general these companies build other kinds of machines, such as planting machines, tree pruning machines (resizing in pyramid, cone and round
ent, fertilization, etc. About the tea harvesting machines some are hand
shows some of the more important companies that are present in this market, as well as the type of machinery they manufacture. The prices of the machines vary between 5000€ and 10000€
Company Logo
Location
Special Products (PAM)
Japan
Hand-Held Tea Plucking Machine Self-Propelled Tea Harvester
Tea Sniffing and Pruning Machine
Portugal
Aromatic and Medicinal Plants ZJKawasaki Cut Machinery
Serbia
Harvester Chamomile harverster
ompanies worldwide that provide machinery for automated aromatic and medicinal plant harvesting. They are well known in this sector and the products they provide are effective, and manufacture everything by themselves, from the machine mechanical parts to the software. In general these companies build other kinds of machines, such as planting machines, tree pruning machines (resizing in pyramid, cone and round ent, fertilization, etc. About the tea harvesting machines some are hand-held and others are
shows some of the more important companies that are present in this market, as well as the type of € and 10000€
Special Products (PAM)
Held Tea Plucking Machine
Propelled Tea Harvester
Tea Sniffing and Pruning Machine
Aromatic and Medicinal ZJKawasaki Cut Machinery
Harvester-mowers Chamomile harverster
8
Ortomec
Italy
Self-propelled vegetable harvesters on tracks or wheels Shaker table Improver Cleaner
Ochiai
Japanese
Hand and self-propelled Tea HarvestersHarvester Concepts
New Zeland
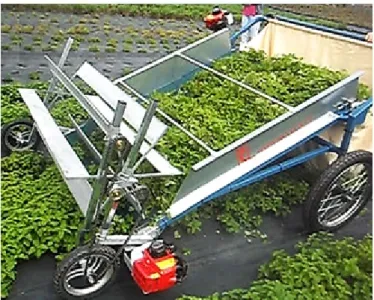
Tea harvesters: HT – KumaP, HT – Calla, HT – Cress, HT – Nursery Table 1: Commercial solutions review tableCurrently the best solution for small aromatics are the two types of machines shown in Figure 4 and Figure 5. The Two Man Plucking machine type, which is the most common solution of all amongst the PAM farmers, is based on a blade carried by two men and has a ventilation system which bows air with the harvested brunches into a bag in the back. The MAP harvesting machine can be carried by one single person but more often is carried and guided by two persons. It has a blade at the bottom that cuts the branches and a mill that lays the brunches on a rotating treadmill which, in turn, carries them up until they fall in a bag hanged in the back of the machine.
9
Figure 5: MAP harvesting machine by McLeça
2.2 Related Solutions Review
In the automation of the agriculture area there have been significant developments and interesting solutions for the harvesting process. To create solutions for the harvesting problem it involves a wide range of different disciplines, such as horticulture, horticultural engineering, machine vision, sensing, robotics, control, intelligent systems, software architecture, system integration, mechanics, and crop management.
This section presents some of the more advanced robotic solutions and research results for harvesting crops. This review focuses only on advanced automatic solutions.
The Sweet Pepper Harvesting Robot[7], is an advanced solution for harvesting Sweet-Pepper in a greenhouse. It is able to scan a line of crops, detect, recognize the ones ready for harvest and pick them with a robotic arm. It took 4 345 912 Euros to be developed. It runs on a PC running ROS to move the manipulator, process and control the 3D camera and for the LED flash modules. It uses Arduinos to control the moving platform and the knife. The database acquired to train the recognition image processing software was obtained through about a total of 4000 images, in three different greenhouses databases, one artificial database, two imaging sensors, and 14-15 viewpoints for each crop. A deep learning convolutional neural network was applied for sweet-pepper plant part segmentation with the objective to detect the plant main stem and so calculate an obstacle free approach direction for the robot. The success rate is around 60% and takes about 24 seconds to pick each crop.
Strawberry picker from Octinion is an advance solution for harvesting strawberries in greenhouses[8]. It has a robotic arm, with a soft touch gripper designed to pick without cutting the stem and put the strawberry into the final package. It has a success rate is of 70%. It picks one strawberry every three seconds, in average.
10
MAGALI Project is a project going for years. The basic idea was developed at Montpellier France which originated the first working laboratory prototype in 1984 to pick apples[9]. The concept is based on a system where there is an arm and a camera fixed on a pathway, with a picking tool at the hand. The prototype has a three degrees of freedom, but the arm itself has a straight line movement. Figure 6 illustrates a representation of the model. The camera was positioned in a way where the coordinates of the vision system coincide with the position of the arm in a straight line alignment. The detection workflow would start with taking images, analyze of the data and classify the images in order to recognize the fruits with the central camera. After that the prototype would align itself to the fruit. The picking system would use an effecter with a suction cup to detach the fruit from the tree. This prototype had a success detection rate of more than 50% and took about four seconds to harvest each fruit in average. This prototype was very innovative, although it had a main strong weakness called “line of sight” caused by the hand being in the way.
Figure 6: Basic design of the robotic arm developed in the MAGALI Project [9]
Florida Citrus Picking Robot[10] was the following project after MAGALI by another team that addressed the issue of “line of sight” by using a color camera attached at the end of the effecter with an ultrasonic transducer to compensate for the distance of the fruit calling this system “eye-in-hand”. The camera would detect and classify the image using the contrast colors between the fruits and the background. The main function of machine vision in this system is to detect the location of the fruit target in the image. The step after is to obtain information of the depth between the effecter and the fruit. In reality this step is a challenging problem to solve because of all the external dynamic conditions, and also because it is harder to discriminate the fruit from the background. For this issue this project explored and used a solution based on a
11
pattern recognition system by visual perception[11]. It uses two-dimensional projections to produce feature abstractions from geometrical properties in order to extract useful information from the scene[12]. This prototype was able to produce results of harvesting each fruit from three to seven seconds with a detection success rate of 75% in average.
Another innovative project is EUREKA[13], whose purpose is to harvest citrus fruits, being composed by an arm with a spherical manipulator, a gripper and a camera at the center of the manipulator. Its machine vision system uses an efficient threshold algorithm applied to the data acquired from a camera with a grey level scheme with a filter of 630nm of wavelength. The obtained result was a detection success rate of 80%. Later they experimented with two other cameras, one with a 630nm and another with 560nm wavelength filters on both cameras. The image classification algorithm uses the Bayesian classifier as discrimination function to detect mature fruits, and the success rate improved to over 90%. The main issues and causes for failure in this solution were leaves that could be in between and occlude the fruits, and the measurement of the distance when approaching the fruit when it was close.
The Agribot Project is a solution designed to combine the human function working with the aid of the machine, to create an aided harvesting strategy[14]. Figure 7 illustrates this system which is composed by vehicle with two picking arms mounted and a human guiding and commanding the vehicle. A human operator sitting in the cabin does the detection. His job is to drive the vehicle and put the picking arms in close range with targeted fruits. Once placed in a good position he is in charge to point a laser telemeter to the targeted fruit, by controlling a joystick that sets a pan/tilt with two-degrees of freedom. This laser measures the distance to the fruit, as well as the horizontal and the vertical angle, determining its coordinates relatively to the vehicle. While the operator marks the fruits, the control computer is in charge to determine the best picking sequence of the arms while they are going for the coordinates and picking the fruits. The main factors that limit the effectiveness, productivity and efficiency are related to the way of dealing with: detection, localization, the structure of the manipulator, the environment conditions and the operation mode. The solution to these problems was focused around developing a specific solution and design for the mechanical structure. They achieved a harvesting time of two seconds per fruit in average.
12
Figure 7: General system scheme concept of the harvester Agribot.[14]
Researchers and collaborators from the University came up with the solution CRAM Citrus Picking Robot[ 15]. This robot was based on a Cartesian manipulator mounted on a caterpillar to maximize the fruit picking reachability. The machine vision system uses Red and Green colors from the RGB (Red Green Blue) model do detect and distinguish the fruits from the background. The fruit position in the images was determined using the diameter of the classified fruits. The fruits in a cluster are selected in the approaching stage as the manipulator gets closer to the fruit. The distance was estimated based on the movement of the manipulator. With the algorithm Kalman filter it estimates the fruit dimensions. It is an algorithm designed to make exact inferences on a dynamic linear system, and all the space-state variables are continuous and have a normal distribution, both the observed and the non-observed ones. This prototype achieved a picking time of 5.93 seconds in average.
AGROBOT was a solution created in Italy designed to harvest tomatoes. It was composed by a six degrees of freedom picking arm, a hand with a grip and two micro cameras. Regarding the image processing this prototype used the components hue and saturation from the model HSV (Hue Saturation Value) color space to perform the threshold to make the segmentation of the image. Figure 8 illustrates the HSV model.
13
Figure 8: HSV model: hue (H), saturation (S), Value (V)
2.3 Evaluation
This section is destined to make a review evaluation related to the solutions presented in “Commercial Solutions Review” and “Related Solutions Review” section.
The solutions presented in section “Commercial Solutions Review” have all mainly similar limitations. These machines still require handwork in order to operate the machines. The type of solution illustrated in Figure 4 requires two or three workers to operate properly. One supporting each side of the plucking machine and position correctly, while another optional worker can support the bag behind to help, in case the bag gets too heavy or gets stuck to the plants. The type of solution illustrated in Figure 5 uses one or two workers, to guide and pull the machine. The second main limitation is related to the kind of harvest cut. Both have a horizontal cut. Section “Motivations” explains the influence on the type of cut.
In section “Related Solutions Review” the Sweet Pepper Harvesting Robot main limitation is the time it takes to pick each strawberry. In a greenhouse with 20m length and 425 plants, produces around 2550 strawberries per harvest and 5525-11475 in one year (data collected from a greenhouse in non-intensive cultivation in Mira, Portugal). If it would take in average 24 seconds to pick each crop, it takes 17h to make one harvest in this greenhouse. This harvest time would be an accurate estimation if the success rate was 100%. The second main limitation is the success rate of 60% which is considerably low. In the example of this greenhouse it means that on each harvest 1020 crops were left for a second manual harvest.
The solution for strawberry picking provided by Octinion limitation is the success rate of 70%, which may be considerably low.
MAGALI Project, designed to pick apples, has two considered main limitations. One is the success rate of 50%. The other is the “line of sight”, which is the fact that the robotic arm is in the way of the camera used for recognition. These two limitations may be related to one another.
Florida Citrus Picking Robot solved the “line of sight” limitation. The success rate is of 75% which is significantly higher, although there is always room for improvement and can still be considered a low success rate.
14
EUREKA project was also designed to pick citrus. It has an improved success rate of 90%. The main issues and causes for failure in this solution were leaves that could be in between and occlude the fruits, and the measurement of the distance when approaching the fruit when it was close.
Agribot project, designed to pick citrus crops, combines the human and machine function. Its main limitations are related to the extreme sensibility to external factors. Due to the fact that the recognition and picking phase are separated and may take some time between one and the other. The picking phase works in open-loop. The precision of the mechanical structure may be also a big limitation.
CRAM Citrus Picking Robot limitation is related to the fact that the distance between the manipulator and the fruit is calculated through the diameter of the fruit. Irregularities of the fruits dimensions may affect the success rate.
2.4 Control Systems
The purpose of a control system is to take a certain input signal, or set of signals, and create a desired behavioral on a target system, by means of actuator(s). There are open loop control systems and closed loop systems. An open loop control system is a system that has a controller that takes a certain input signal, and computes an output signal, according to a given model, that is then applied to the actuator. Figure 9 presents a representation of an open loop controller.
Figure 9: Open loop concept model [19]
An open loop controller is simple to implement and to test, but it has several limitations that arise from the fact that it does not take the results of its actions into account to make correction in the control signal. This causes a lot of unwanted consequences such as the frequent presence of an error between the desired output and the obtained one. In case of external or internal noise that changes the output of the system there is no feedback loop to take this into account and correct the control signal. The same happens for natural changes of the environment.
These problems are addressed by closed loop control systems, which have a feedback loop. The controller and actuator concepts are the same as before, but there is a measurement unit which measures the system’s output, treats and inserts it into the system again. Figure 10 represents the model of this system. The negative feedback loop allows, for many systems, design a stable system which aims to produce a controlled behavioral. An example of a behavioral window that illustrates how the system might work follows. The objective is to control the angle of a motor. It takes an angle as input and outputs a voltage to the motor as control signal. The motor is at an angle of 50º and the input is at 40º, thus the error between the desired angle
15
and the current one is -10º, which means that the input of the controller is -10º. Depending on the type of model this controller can have, it takes this -10o error and reacts with a certain voltage at its output that will actuate on the motor with the aim to make the angle equal to the input value and minimize the error.
Figure 10: Close loop concept model [19]
2.4.1 PID controller
One of the most used control systems used are the PID controllers, which stands for Proportional-Integral-Derivative [19].
Each one of the parts (Proportional-Integral-Derivative) has a different role, so first let’s look into the proportional controller. Figure 10 represents the model of a PID control system with its components. The proportional controller is a controller with a proportional gain applied to the error signal e(t). This means that the expression for the proportional controller can be described as in Equation 1, being u(t) the control signal.
= 0 + ∗
Equation 1: Control signal expression of a proportional controller
The error is zero in the stationary state if the gain is infinite or if the signal u0 = u(t). The first condition corresponds to controller with a similar behavioral as an ON-OFF controller. The second condition implies that the signal u0 is variable in a way that the error in the stationary state is always zero for any value of the input.
The automatic acquisition of a u0 variable capable of producing an error zero in the stationary position for any input value introduces to the Proportional-Integral (PI) controller. In system based on a PI controller, there is the proportional and the integral part acting at the same time and the block diagram is shown in Figure 11 without the derivative term. The control signal is obtained by the Equation 2.
= ∗ + ∗
16
The control signal depends on the gain of the proportional controller, on the instant value of the error and on the integral value of this error affected by a factor of Ki. The factor Ki can be expressed as Kp/Ti, being Ti called integration time. The expression that describes the error is = , so error in the stationary state is zero if Kp is infinite or u0 = u(t). The first condition is similar to an ON-OFF controller, the second implies a variable u0 signal. The automatic acquirement of a variable u0 is made through the integral influence in Equation 3.
0 =
Equation 3: Expression describing the component u0 of a PI controller
If the error is positive, the value of the u0 component is constantly increasing, while if it is negative then u0 decreases. If the error is zero u0 maintains a constant value. This behavior eliminates the error in the stationary state.
Figure 11: PID controller diagram
In a controller that includes the integral action combined with an actuator that may suffer saturation (real-world actuators have this property), unwanted dynamics behavioral in closed loop may result. For example, a valve saturates when completely open or completely closed. Another example when the control signal is a PWM(Pulse-Width Modulation) signal, then it saturates when the duty cycle is at 0% or at 100%. When the actuator saturates the system changes from a closed loop to an open loop and if the integrator term is continuously accumulating the value of the error signal its output increases in an uncontrollable way (windup effect) until the error signal of its value changes. This behavior can lead to an increased overshoot of the output signal. It has to be noticed too that the integral term has a pole in the origin and therefore is unstable in open loop.
The solution to this problem consists in limiting the integral in order to assure that the system never turns in an open loop system and this involves using an extra feedback loop for the integral term. There are some ways to implement it. In practice a quick implementation is to compare the error with a defined threshold in
17
which the integral is active. Another is to compare the value of the saturation level and introduce this value divided by a factor and subtract with the gain of the integral term decreasing it.
In a PID control system there is also the derivative component influencing the controller behavioral present in the Figure 11. This component counteracts some of the integral limitations related to the fact that the integral term can’t act on the derivative value of the error creating some possible oscillations when the error is close to zero. It basically calculates the derivative value of the error and predicts the error value (useful when approaches zero) and creates a fast error behavior when the error value changes fast. The behavior of a PID controller can be described by the Equation 4 where Td is designated as differentiation time.
= ∗ + ∗ + ⇔
= ∗ + 1 ∗ + "
Equation 4: Control signal expression of a PID controller
2.5 DC Motor
A DC motor is nothing more than a motor powered up by direct current. The energy can be applied through brushes or it can be brushless. A DC motor can be controlled just by changing the (average) voltage, differently from an AC motor which its speed is controlled by changing the voltage frequency. A DC motor consists in an axis coupled to the rotor, which is the rotating part of the motor. In Figure 12, the stator consists in two magnets, and the commutator has the function to transfer the energy from the power supply to the rotor.
In Figure 13 the stator consists in the magnets (N and S). The rotor is represented by the coil which is powered by the commutator where there is a certain current flowing. By powering the commutator with direct voltage, there is a direct current generated which is transferred to the coil through the contact with the brushes of the commutator with this coil. The commutator function is to make the link between the power supply and the rotor of the motor. It consists in brushes that make the contact with the rotating motor axis. The magnetic field is generated between the poles north and south of the magnets and have a direction starting from the north and going to the south. The Torque is going to boost the coil which boosts the rotor.
18
Figure 12: Schematics of a DC motor [20]
Figure 13: DC motor concept [21]
Basic and derived specifications of a DC motor[28]. -Speed of the axis.
There is a DC voltage (V) applied to the motor in order to make it rotate into a certain direction into a proportional rotating speed (ω). The specifications of the speed of the axis refer to the speed without load in general, which is the maximum speed that the motor can achieve without torque applied.
-Output torque.
The rotation of the axis generates a rotation force called torque. The torque is given in units of force-distance (ex. N-m) it can be of two types: initial/static torque and continuous/dynamic torque. The static torque corresponds to the one to where the motor is stationary and dynamic torque to the maximum value in normal functioning conditions. The torque value is proportional to the induction current.
-Available voltage.
DC motors can be designed to operate in a specific voltage, however most of the times it represents the maximum voltage in which the motor can operate without being damaged.
A common and important specification is the nominal output power (P) which is represented by the product of the torque with the speed. P = τ*ω. The max output power occurs when the motor is at 50% of its max speed without load and 50% of the stopped torque.
-Dissipated power.
The current absorbed by DC motors are subject to losses and generate heat. The value of these losses are related to the total resistance of the system and include also the losses through friction on the
2.6 H-bridge
An H-bridge is an electronic power circuit of the type chopper of the class E
class E converts a constant direct current supply from a power supply, into a variable direct current supply opening and closing gates. That way it is possible to control the direction of the current flow, the polarity of the voltage and the voltage on a certain system or component.
The H-bridge circuit is used to define the direction of the current flow and the value of the voltage in the control of a DC motor. Figure 14
bridge. Activating both switches S1 and S4, a positive voltage from the right to the left side of the motor is applied, allowing the current flow from the right to the left. The motor rotates in a certain direc
configuration. When the switches S3 and S2 are activated, the voltage applied to the motor is the reverse and the rotating direction and current flow too.
When the goal is to break or slow down a motor in movement activated and there is a short circuit in one side of the motor
the motor starts behaving like a generator when its axis is in rotating. The necessary torque to maintain or make the motor in rotation raises because the necessary current demanded by the motor stops the movement.
Figure 14: Electric diagram of an H
The switches S1 and S2 or S3 and S4 can’t be activated at the same time because it causes a short circuit on the power supply. There are some ways to assure this
circuit. Some solutions are based on protection circuits tha
time by using logic gates, specific drivers or any other device or circuit that avoids this situation. In some of these solutions there is even the possibility to add a time difference between the deactivat
and the activation of the other, called dead time.
19
A common and important specification is the nominal output power (P) which is represented by the product of the torque with the speed. P = τ*ω. The max output power occurs when the motor is at 50% of its max
oad and 50% of the stopped torque.
The current absorbed by DC motors are subject to losses and generate heat. The value of these losses are related to the total resistance of the system and include also the losses through friction on the
bridge is an electronic power circuit of the type chopper of the class E [23,29,30]
class E converts a constant direct current supply from a power supply, into a variable direct current supply closing gates. That way it is possible to control the direction of the current flow, the polarity of the voltage and the voltage on a certain system or component.
bridge circuit is used to define the direction of the current flow and the value of the voltage in the 14 shows the general architecture representation and way of working of an H bridge. Activating both switches S1 and S4, a positive voltage from the right to the left side of the motor is applied, allowing the current flow from the right to the left. The motor rotates in a certain direc
configuration. When the switches S3 and S2 are activated, the voltage applied to the motor is the reverse and the rotating direction and current flow too.
hen the goal is to break or slow down a motor in movement, the switches S1 and S3 or
activated and there is a short circuit in one side of the motor. This effect occurs because in this configuration the motor starts behaving like a generator when its axis is in rotating. The necessary torque to maintain or otation raises because the necessary current demanded by the motor stops the movement.
: Electric diagram of an H-bridge, in the rest position (left), in the two possible active positions (others) [23] S2 or S3 and S4 can’t be activated at the same time because it causes a short circuit on the power supply. There are some ways to assure this does not happen to avoid the problem of damaging the circuit. Some solutions are based on protection circuits that avoid both switches to be activated at the same time by using logic gates, specific drivers or any other device or circuit that avoids this situation. In some of these solutions there is even the possibility to add a time difference between the deactivat
and the activation of the other, called dead time.
A common and important specification is the nominal output power (P) which is represented by the product of the torque with the speed. P = τ*ω. The max output power occurs when the motor is at 50% of its max
The current absorbed by DC motors are subject to losses and generate heat. The value of these losses are related to the total resistance of the system and include also the losses through friction on the stator and rotor.
[23,29,30]. A chopper of the class E converts a constant direct current supply from a power supply, into a variable direct current supply closing gates. That way it is possible to control the direction of the current flow, the polarity of
bridge circuit is used to define the direction of the current flow and the value of the voltage in the ure representation and way of working of an H-bridge. Activating both switches S1 and S4, a positive voltage from the right to the left side of the motor is applied, allowing the current flow from the right to the left. The motor rotates in a certain direction with this configuration. When the switches S3 and S2 are activated, the voltage applied to the motor is the reverse and
, the switches S1 and S3 or S2 and S4 are . This effect occurs because in this configuration the motor starts behaving like a generator when its axis is in rotating. The necessary torque to maintain or otation raises because the necessary current demanded by the motor stops the movement.
bridge, in the rest position (left), in the two possible active positions (others) [23] S2 or S3 and S4 can’t be activated at the same time because it causes a short circuit on
happen to avoid the problem of damaging the t avoid both switches to be activated at the same time by using logic gates, specific drivers or any other device or circuit that avoids this situation. In some of these solutions there is even the possibility to add a time difference between the deactivation of one switch
20
Another kind of issue is that by activating the motor there are some reverse currents and voltages that can appear and may cause damage to the switches. To avoid such damages there are some measures that can be taken such as using fast diodes in anti-parallel with the switches which is the most common (fly back diodes), and the use of TVS (Transient Voltage Suppressor).
2.7 Control of the DC Motor with PWM
PWM (Pulse-Width Modulation) of a signal involves modulation in duty cycle to transport any information through a channel or to control the power supply value delivered to the load. In power delivery, PWM is used to deliver a certain amount of power to a certain load without the losses that would occur if e.g. the voltage was modified by means of resistors. In a PWM system, the switch (IGBT(Insulated Gate Bipolar Transistor), MOSFET(metal-oxide-semiconductor field-effect transistor) or BJT(Bipolar Junction Transistor)) is used to control the current flow, by conducing or not. This is done with a low voltage range, because the instant dissipated power by the switch gate is the product of the current and voltage in a certain moment. That means that no power is dissipated if the switch was an “ideal” switch. With a sufficiently high modulation rate, simple RC(Resistor-Capacitor) filters are frequently used to soften the impulse train in a stable analogic voltage. This method is usually used in DC motors speed control.
To put the concept in perspective lets imagine a simple gate that turns on and off. When off no voltage and power are applied to the load. Conversely, when the gate is on the voltage is the nominal one and therefore the power delivered to the load is maximum. With the control of the time in which the gate is on or off, the average power delivered to the load is controlled and is variable. Because the motor speed is proportional to the applied voltage, the motor speed can be controlled. For example, if the PWM has a duty cycle of 50%, it means that the gate is half of the time on and the other half off and, by consequence, the power delivered to the motor is approximately half of the maximum. The motor speed has a corresponding speed according to that new average voltage level.
2.8 Encoders for DC Motors
An encoder is an electro-mechanical sensor which transform the rotary motion into electric signals. This functionality is usually used for the purpose of quantify distances, speed, measure angles, number of rotations, etc. [22,31]
An encoder is basically composed by a disc with marks, an emitter and a receptor components. Optical encoders use a led as the emission component and a photo-detector as a receptor. These marks have the functionality to interfere with the light that gets from the source to the receptor. This way when the disk is rotating, the photo-detector that connects to the circuit and generates a square signal proportional to the number of marks according to the resolution of the encoder. The resolution of the encoder corresponds to the number of marks on the disk, which corresponds to the amount of square signals. Encoders can have one, two
21
or more channels, which can be located with different phases, increasing the resolution and allowing to detect the movement direction. This is how incremental encoders work.
The disk can also have multiple levels of marks on the disk for different channels (bits) making it also possible to read the absolute angle of the disk. These are called absolute encoders.
Detecting technologies can be physically of two types. Can either work using a Led as source and a photo-detector as photo-detector (optical encoders) or using a magnet as source and a Hall Effect sensor as photo-detector. When using a two channel encoder there are different ways to use the signal of the channels to count the increments, and this affects the resolution. Figure 15 illustrates a representation of the output signals.
Simple resolution uses the computing system to sync with one channel each time the signal rises or decreases and measures the value of the other signal at that instant. This gives a resolution of one count per cycle of one channel.
With a maximum resolution approach the system takes full use of the wheel resolution. Each rise and fall from both channels is counted and detected by the computing system. This gives a resolution of four counts per cycle of one channel.
Figure 15: Representation of the signal on the two channels in the two different directions [22]
2.9 Servo Motors
A servo motor is an electro-mechanic system that consists in a rotary linear actuator and has an angular movement proportional to a certain command. As a closed loop feedback control device (as explained in section “Control Systems”), it receives a control signal, verifies the current position and responds accordingly, in order to control the movement going to the desired position. The feedback loop controls this externally, the measurement unit in Figure 10 can either be a tachometer, an encoder or a resolver, depending
22
on the type of servomotor and application. The most used sensor for servomotors is a potentiometer connected to the servo axis because of their cheapness and reasonable precise and quick behavior. The value of the potentiometer varies accordingly to the motor’s angle. In contrast with the DC motors which rotate indefinitely, the axis of the servomotors has a limited and defined freedom. Most of them are limited to 180º degrees, but they are usually precise and quick.
The actuator consists in an electric motor, which usually has a set of gears designed to create a long relation ratio that allows to attain a higher torque.
2.10 Classification
and
interpretation
methods
in
image
recognition
There were many different methods developed for image recognition. They can all mainly be divided in two categories, local based and shape based processing [17]. In general the steps of the image processing are: processing, feature extraction, segmentation, classification of the pixels in classes and interpretation. In pre-processing the goal is to assure reasonable general conditions of the image for further pre-processing, such as brightness and geometry/distortions compensation. Feature extraction is the extraction of properties that can be useful for the next phase and depend on the algorithm used. In this thesis the features extracted were mean and covariance of the pixel distribution. It is a three dimension feature extraction vector for the mean, one dimension extracted from each of the RGB model, and nine dimensions for the covariance (3x3). Segmentation is the process of simplification of pixels with similar properties into “super-pixels” or segments for easier classification and interpretation. Classification is the process of classifying each pixel in different classes with concrete real meanings. For example, a certain pixel in this phase can be classified as a pixel belonging to the class of plant and not any other such as class ground. The interpretation phase is where the image gets real useful meaning, such as the position of the plant for example.
2.10.1 Statistical based analysis - Bayesian Classifier
Many problems in which there are machine learning methods applied can be described as supposing the existence of a particular set of data and a set of different classes and make the question of how to associate the data to the classes. Speaking in a more technical and mathematic language, a particular data x belongs to class Ci. One example of this concept applied to this project is determining for one pixel x if it belongs to the class plant or not plant (which is a composition of non-plant classes).
Equation 5 describes the Bayesian decision theory approaches this problem using the Bayes theory or Bayes rule.
# $|& =# $, &# &
![Figure 6: Basic design of the robotic arm developed in the MAGALI Project [9]](https://thumb-eu.123doks.com/thumbv2/123dok_br/15822480.1081948/24.892.249.673.458.797/figure-basic-design-robotic-arm-developed-magali-project.webp)
![Figure 7: General system scheme concept of the harvester Agribot.[14]](https://thumb-eu.123doks.com/thumbv2/123dok_br/15822480.1081948/26.892.235.672.127.438/figure-general-scheme-concept-harvester-agribot.webp)
![Figure 15: Representation of the signal on the two channels in the two different directions [22]](https://thumb-eu.123doks.com/thumbv2/123dok_br/15822480.1081948/35.892.227.689.546.792/figure-representation-signal-channels-different-directions.webp)