ACPD
12, 23219–23260, 2012Assessment of the Level 3 MODIS AOD
J. A. Ruiz-Arias et al.
Title Page
Abstract Introduction
Conclusions References
Tables Figures
◭ ◮
◭ ◮
Back Close
Full Screen / Esc
Printer-friendly Version Interactive Discussion
Discussion
P
a
per
|
Dis
cussion
P
a
per
|
Discussion
P
a
per
|
Discussio
n
P
a
per
|
Atmos. Chem. Phys. Discuss., 12, 23219–23260, 2012 www.atmos-chem-phys-discuss.net/12/23219/2012/ doi:10.5194/acpd-12-23219-2012
© Author(s) 2012. CC Attribution 3.0 License.
Atmospheric Chemistry and Physics Discussions
This discussion paper is/has been under review for the journal Atmospheric Chemistry and Physics (ACP). Please refer to the corresponding final paper in ACP if available.
Assessment of the Level-3 MODIS daily
aerosol optical depth in the context of
surface solar radiation and numerical
weather modeling
J. A. Ruiz-Arias1,2,3, J. Dudhia3, C. A. Gueymard4, and D. Pozo-V ´azquez1,2
1
Solar Radiation and Atmosphere Modeling Group, Physics Department, University of Ja ´en, Ja ´en, Spain
2
Center of Advanced Studies in Energy and Environment, University of Ja ´en, Ja ´en, Spain
3
Mesoscale and Microscale Meteorology Division, National Center for Atmospheric Research, Boulder, Colorado, USA
4
Solar Consulting Services, Colebrook, New Hampshire, USA
Received: 15 June 2012 – Accepted: 29 August 2012 – Published: 7 September 2012
Correspondence to: J. A. Ruiz-Arias ([email protected])
ACPD
12, 23219–23260, 2012Assessment of the Level 3 MODIS AOD
J. A. Ruiz-Arias et al.
Title Page
Abstract Introduction
Conclusions References
Tables Figures
◭ ◮
◭ ◮
Back Close
Full Screen / Esc
Printer-friendly Version Interactive Discussion
Discussion
P
a
per
|
Dis
cussion
P
a
per
|
Discussion
P
a
per
|
Discussio
n
P
a
per
|
Abstract
The Level-3 MODIS aerosol optical depth (AOD) product offers interesting features for surface solar radiation and numerical weather modeling applications. Remarkably, the Collection 5.1 dataset extends over more than a decade, and provides daily values of AOD over a global regular grid of 1◦×1◦ spatial resolution. However, most of the
val-5
idation efforts so far have focused on Level-2 products (10-km, at original resolution) and only rarely on Level-3 (at aggregated spatial resolution of 1◦×1◦). In this contri-bution, we compare the Level-3 Collection 5.1 MODIS AOD dataset available since 2000 against observed daily AOD values at 550 nm from more than 500 AERONET ground stations around the globe. One aim of this study is to check the advisability of
10
this MODIS dataset for surface shortwave solar radiation calculations using numerical weather models. Overall, the mean error of the dataset is 0.03 (17 %, relative to the mean ground-observed AOD), with a root mean square error of 0.14 (73 %, relative to the same), albeit these values are found highly dependent on geographical region. For AOD values below about 0.3 the expected error is found very similar to that of the
Level-15
2 product. However, for larger AOD values, higher errors are found. Consequently, we propose new functions for the expected error of the Level-3 AOD, as well as for both its mean error and its standard deviation. Additionally, we investigate the role of pixel count vis- `a-vis the reliability of the AOD estimates. Our results show that a higher pixel count does not necessarily turn into a more reliable AOD estimate. Therefore, we
rec-20
ommend to verify this assumption in the dataset at hand if the pixel count is meant to be used. We also explore to what extent the spatial aggregation from Level-2 to Level-3 influences the total uncertainty in the Level-3 AOD. In particular, we found that, roughly, half of the error might be attributable to Level-3 AOD sub-pixel variability. Finally, we use a radiative transfer model to investigate how the Level-3 AOD uncertainty
propa-25
ACPD
12, 23219–23260, 2012Assessment of the Level 3 MODIS AOD
J. A. Ruiz-Arias et al.
Title Page
Abstract Introduction
Conclusions References
Tables Figures
◭ ◮
◭ ◮
Back Close
Full Screen / Esc
Printer-friendly Version Interactive Discussion
Discussion
P
a
per
|
Dis
cussion
P
a
per
|
Discussion
P
a
per
|
Discussio
n
P
a
per
|
5 % for GHI (for a solar zenith angle of 30◦). However, the uncertainty in AOD is highly
spatially variable, and so is that in irradiance.
1 Introduction
Aerosols play a major role in the earth’s energy budget. Predicting the climate system invariably requires an evaluation of the aerosol’s radiative forcing, and this, in turn,
re-5
quires knowledge of the spatial distribution, temporal evolution and optical properties of atmospheric aerosols (Kiehl and Ramanathan, 2006). Currently, the scientific un-derstanding of the aerosols effect on climate is limited (IPCC, 2007), and the climatic perturbations they produce are a source of major uncertainty.
Aerosols are mainly generated at sources near the ground but also in the
atmo-10
sphere (by clouds and gas-to-particle conversion). A detailed description of the diff er-ent emitting sources of aerosols can be found in Jaenicke (1993). Near the ground, aerosols are advected into the lower layers of the atmosphere from many diff er-ent sources such as biogenic emissions, oceans, deserts or human activities. The largest concentrations generally occur in urban and desert areas. These
concentra-15
tions rapidly decrease with height in the troposphere (Liou, 2002) and can experience abrupt changes in their spatial distribution. Due to their short tropospheric residence times, aerosols generated near the ground mainly act at regional or local scales, albeit their influence can be also extended to broader scales when they are advected into upper layers of the atmosphere (e.g. Chen et al., 2010).
20
The mesoscale variations of tropospheric aerosols have been studied by Anderson et al. (2003). Based on aerosol optical data, they showed that mesoscale variabil-ity (specifically, for horizontal scales of 40–400 km and temporal scales of 2–48 h) is a common and perhaps universal feature of lower-tropospheric aerosol light extinction. Very recently, based on empirical measurements gathered from the AERONET network
25
ACPD
12, 23219–23260, 2012Assessment of the Level 3 MODIS AOD
J. A. Ruiz-Arias et al.
Title Page
Abstract Introduction
Conclusions References
Tables Figures
◭ ◮
◭ ◮
Back Close
Full Screen / Esc
Printer-friendly Version Interactive Discussion
Discussion
P
a
per
|
Dis
cussion
P
a
per
|
Discussion
P
a
per
|
Discussio
n
P
a
per
|
variability. The use of monthly data, which is a common practice, is becoming a limit-ing factor for many current solar applications, such as solar energy utilization in power plants, which require an accurate determination of the available solar resource for opti-mal sizing of the production facilities, annual production estimates, and plant operation. Moreover, most current research in solar energy focuses on concentrating technologies
5
(both concentrating photovoltaics and concentrating solar thermal). These rely com-pletely on direct normal irradiance (DNI), which is highly sensitive to aerosol optical depth (AOD). In particular, some studies have concluded that both the demonstrated large inter-annual variability in DNI (Lohmann et al., 2006; Pozo-V ´azquez et al., 2011) and the large differences between the current DNI databases ( ˇS ´uri et al., 2009) can be
10
partially explained by a misrepresentation of the aerosol optical properties (Cebecauer et al., 2011; Gueymard, 2011), particularly when they are represented by monthly cli-matologies. In fact, Gueymard (2012) also showed that to correctly reproduce the daily variations in DNI over areas strongly impacted by desert dust or smoke, where the induced effect on the inter-annual variability in DNI is estimated to reach 10–30 %,
ir-15
radiance predictions with radiative models should rely on daily AOD rather than on the more usual monthly-averaged AOD data.
Kaufman et al. (2000) used 7 yr (1993–1999) of AOD data from 50–70 AERONET ground stations to check to what extent measurements acquired at specific times of the day (such as current measurements from satellites Terra and Aqua) could represent the
20
daily average aerosol forcing of climate. For all these stations, they calculated the ratio of the averaged AERONET AOD for the virtual overpass of the satellites (10:00–11:30 local time for Terra’s overpass, and 12:00–13:30 local time for Aqua’s overpass) to the daily averaged AERONET AOD. They concluded that measurements at these specific times of the day could represent the annual average value within 2 %, independently of
25
the particle size and range of AOD.
ACPD
12, 23219–23260, 2012Assessment of the Level 3 MODIS AOD
J. A. Ruiz-Arias et al.
Title Page
Abstract Introduction
Conclusions References
Tables Figures
◭ ◮
◭ ◮
Back Close
Full Screen / Esc
Printer-friendly Version Interactive Discussion
Discussion
P
a
per
|
Dis
cussion
P
a
per
|
Discussion
P
a
per
|
Discussio
n
P
a
per
|
measurement networks, such as AERONET, and by satellite sensors, such as the MODerate-resolution Imaging Spectroradiometer (MODIS) or the Multi-angle Imaging SpectroRadiometer (MISR), aboard the Terra and Aqua satellites. The length of the MODIS database and the number of AERONET stations worldwide make it possible to address a similar question to that of Kaufman et al. (2000) by a direct validation of the
5
daily MODIS AOD retrievals using ground measurements.
In this contribution, we present a global validation of the combined land and ocean Level-3 (L3) MODIS AOD product (Collection 5.1) at 550 nm from the Terra satellite. Small differences are expected with respect to the Aqua satellite (Levy et al., 2010) Then, based on the results of this validation, we investigate how the L3 MODIS AOD
10
uncertainty propagates into the calculated DNI and GHI when L3 MODIS AOD is used as input to a radiative transfer model. The motivations of this study will become clearer in Sect. 1.2 after a brief introduction to the MODIS dataset in Sect. 1.1. The dataset evaluated here spans all the available daily AOD data from the Terra launch (February 2000) to December 2011. For ground truth, we use the complete dataset of daily AOD
15
observations from all possible stations of the AERONET network (Level 2.0; see Sect. 2.2) that have reported data during the 12-yr period of the satellite observations. The dataset thus encompasses a total of 525 stations, but the number of available stations operating any given day is variable.
1.1 MODIS aerosol optical depth
20
The L2 MODIS dataset is a collection of aerosol optical properties, particularly includ-ing the spectral AOD at 550 nm, as well as particle size information. The aerosol is evaluated at the time of the satellite overpass with an un-gridded 10-km nominal reso-lution. It is derived from MODIS radiances using either one of three different algorithms: one over ocean (Remer et al., 2005) and two over land, the Dark-Target (Levy et al.,
25
ACPD
12, 23219–23260, 2012Assessment of the Level 3 MODIS AOD
J. A. Ruiz-Arias et al.
Title Page
Abstract Introduction
Conclusions References
Tables Figures
◭ ◮
◭ ◮
Back Close
Full Screen / Esc
Printer-friendly Version Interactive Discussion
Discussion
P
a
per
|
Dis
cussion
P
a
per
|
Discussion
P
a
per
|
Discussio
n
P
a
per
|
reach exceptional values or reach some error threshold in the intermediate steps of the retrieval algorithm. Lastly, these flags are summarized into a quality assurance confi-dence (QAC) flag, with values from 0 (no-conficonfi-dence) to 3 (best quality). Prior to the Terra and Aqua satellites launch, some sensitivity studies (Kaufman et al., 1997; Tanr ´e et al., 1997) estimated the expected error of MODIS AOD retrievals as±(0.03+0.05τ)
5
over ocean and ±(0.05+0.20τ) over land, where τ is the AOD. (By τ and AOD we mean the AOD at 550 nm, unless otherwise stated). Subsequently, Chu et al. (2002) suggested that the expected error over land could be reduced to±(0.05+0.15τ). This has been globally confirmed by Levy et al. (2010) for the Collection 5 and the Dark-Target algorithm.
10
The L3 MODIS product (Hubanks et al., 2008) is a global daily aggregation of L2 MODIS data into an equal-angle latitude-longitude grid with a spatial resolution of 1◦× 1◦. Each L3 MODIS grid cell value is calculated from the L2 MODIS pixels that fall into its cell boundaries, the number of which is known as pixel count. (Note that several 1◦×1◦cells are covered by a single L2 MODIS swath.) The actual area of each 1◦×1◦
15
grid cell shrinks when moving from the equator (≈12 321 km2) to the poles (≈107 km2). Besides, there is a change in the size of the L2 MODIS pixels due to the viewing distortion at high sensor scan angles. As a result, there are fewer pixels to include in the computation of each L3 MODIS cell over regions swept with high sensor scan angles and/or near the poles. In addition, mostly due to overlapping orbits toward the
20
poles, but also to viewing distortion at high sensor scan angles, the L3 MODIS values poleward of 23◦ actually become a time average. Between approximately 23◦S and 23◦N, the reported values are rather a spatial average of all L2 MODIS values obtained
during a single satellite overpass every day. Finally, there is no minimum pixel count to derive the L3 MODIS product statistics. Typically, for the aerosol products considered
25
ACPD
12, 23219–23260, 2012Assessment of the Level 3 MODIS AOD
J. A. Ruiz-Arias et al.
Title Page
Abstract Introduction
Conclusions References
Tables Figures
◭ ◮
◭ ◮
Back Close
Full Screen / Esc
Printer-friendly Version Interactive Discussion
Discussion
P
a
per
|
Dis
cussion
P
a
per
|
Discussion
P
a
per
|
Discussio
n
P
a
per
|
1.2 Motivations and objectives
The relatively high spatio-temporal resolution, and the large (near-global) coverage of the L3 MODIS dataset make it especially suitable for use with Numerical Weather Pre-diction (NWP) models (Lara-Fanego et al., 2011; Ruiz-Arias et al., 2010, 2011, 2012). It is very convenient for surface solar radiation studies because of the high impact of
5
AOD on DNI. We will focus here only on AOD because it is the most important aerosol optical property driving solar extinction, and thus the incident surface shortwave irra-diance. In particular, at the end of this report we analyze how the uncertainty in the L3 MODIS AOD estimates propagates into the uncertainty in modeled values of GHI and DNI. To this end, we conduct an initial global evaluation of the L3 MODIS AOD
10
uncertainty based on ground measurements. The Angstr ¨om exponent, an important parameter in determining the AOD spectral dependence, is also provided within the L3 MODIS dataset. However, it is not considered here, since its use has been discouraged by Levy et al. (2010).
So far, most of the MODIS validation exercises only involved the L2 MODIS dataset
15
(Mishchenko et al., 2008; Remer et al., 2008; Hoelzemann et al., 2009; Jethva et al., 2010; Levy et al., 2010; Li et al., 2010; Mei et al., 2012, to mention just a few). But the L3 MODIS dataset has a number of peculiarities that differentiate it from the L2 MODIS dataset. Usually, L2 MODIS AOD (hereafter, also referred to as L2 AOD) val-idation studies employ the Ichoku approach (Ichoku et al., 2002) to verify collocation,
20
i.e. when a ground measurement matches a satellite observation. The Ichoku approach compares the spatial average of a grid of 5×5 L2 MODIS pixels (in the middle of which the ground station stands) to the temporal average of the data collected by the ground station within ±30 min of the satellite overpass. At least 5 L2 MODIS pixels and 2 ground observations are required to accept the collocated data pair. This approach
25
ACPD
12, 23219–23260, 2012Assessment of the Level 3 MODIS AOD
J. A. Ruiz-Arias et al.
Title Page
Abstract Introduction
Conclusions References
Tables Figures
◭ ◮
◭ ◮
Back Close
Full Screen / Esc
Printer-friendly Version Interactive Discussion
Discussion
P
a
per
|
Dis
cussion
P
a
per
|
Discussion
P
a
per
|
Discussio
n
P
a
per
|
the annual average daily AOD value. Since the L3 MODIS product is updated daily, it makes sense to validate the L3 MODIS AOD dataset (hereafter, also referred to as L3 AOD) using daily AOD averages acquired at ground stations. In such a case, the vali-dation time window widens to the daylight hours (and cloudless conditions) relative to the ground station, and the spatial average spreads over a region of 1◦×1◦, i.e. roughly
5
4 times coarser than for the validation of the L2 AOD product following the Ichoku ap-proach. It is important to know to what extent this broadened time-space correlation assumption affects the performance of the L3 AOD data, and whether the expected error (EE) of the L2 AOD also holds for the L3 AOD data.
We also explore the influence of the L2 AOD pixel counts on the L3 AOD reliability
10
and address the relative importance of the spatial uncertainty caused by the 1◦
×1◦ AOD sub-pixel variability, also known as spatial representativeness uncertainty. More specifically, the question here is how the spatial representativeness uncertainty com-pares to the total L3 AOD error. The outcome of this analysis is important because it might suggest the use of an increased spatial resolution in future releases of the L3
15
MODIS AOD product. Based on the results obtained in the validation exercise, we fi-nally explore how the L3 AOD uncertainty propagates into the irradiance prediction (of GHI and DNI). This result is important to determine the usability and possible benefits of the L3 AOD dataset for surface solar resource assessments, in particular.
In Sect. 2, we describe the L3 MODIS AOD and observational datasets used to
con-20
duct this study, as well as the collocation approach to match pairs of data. We also present a brief exploratory analysis of the datasets. Section 3 shows the results of the validation, both globally and constrained by geographical region. In Sect. 3.3 we provide a simple model to estimate the mean error and uncertainty of the L3 AOD mea-surements. Section 4 investigates the role of pixel count in the reliability of the L3 AOD,
25
ACPD
12, 23219–23260, 2012Assessment of the Level 3 MODIS AOD
J. A. Ruiz-Arias et al.
Title Page
Abstract Introduction
Conclusions References
Tables Figures
◭ ◮
◭ ◮
Back Close
Full Screen / Esc
Printer-friendly Version Interactive Discussion
Discussion
P
a
per
|
Dis
cussion
P
a
per
|
Discussion
P
a
per
|
Discussio
n
P
a
per
|
2 Data
Here, we describe both the L3 MODIS and the AERONET AOD datasets used in the study. Additionally, we offer a brief description of the collocation approach and some comments on the spatial distribution of the experimental stations used from the AERONET network.
5
2.1 Level 3 MODIS AOD dataset
This validation covers the period since the deployment of the MODIS instrument aboard Terra satellite (February 2000) to the end of December 2011. The dataset belongs to the Collection 5.1 combined land and ocean L3 MODIS AOD at 550 nm from the Terra satellite (variable name “Optical Depth Land And Ocean Mean”, available from
10
ftp://ladsweb.nascom.nasa.gov/allData/51/MOD08 D3/).
Overall, the dataset spans 12 yr, totaling data over 4209 days. On average, about 33 % of the earth’s surface is tiled every day with AOD measurements. But if the surface is restricted to only latitudes between 60◦ S and 60◦ N (higher latitudes are typically covered with snow and thus prone to missing values), the dataset covers about 46 % of
15
the surface. Missing tiles are mostly caused by clouds and high reflectance surfaces, such as deserts or snow.
Figure 1 shows the mean AOD value and the mean pixel count at each grid cell over the entire validation period. The mean AOD over the whole grid is 0.18 and the standard deviation is 0.09 (i.e. 50 % relative to the mean value). There exists a large
dif-20
ference between the minimum and maximum mean AOD,−0.05 and 2.78, respectively (negative AOD values are non physical for solar radiation applications, and therefore are not considered further). Interestingly, 95 % of all the AOD values are smaller than 0.35, due to the generally low aerosol burden over oceans. The remaining 5 % of all cases, where AOD can be considerably larger than 0.5, mostly corresponds to land
25
ACPD
12, 23219–23260, 2012Assessment of the Level 3 MODIS AOD
J. A. Ruiz-Arias et al.
Title Page
Abstract Introduction
Conclusions References
Tables Figures
◭ ◮
◭ ◮
Back Close
Full Screen / Esc
Printer-friendly Version Interactive Discussion
Discussion
P
a
per
|
Dis
cussion
P
a
per
|
Discussion
P
a
per
|
Discussio
n
P
a
per
|
part), the Hymalayas and the Indus river basin. In Africa, the mean AOD is specially high in the central rain-forests and the Gulf of Guinea, due to the seasonal burning of biomass, and the Sahel area, due to the dust drag from the desert. Figure 1a shows a deep intrusion of African aerosol into the Central Atlantic Ocean that extends up to the Caribbean Sea. Seasonally high values of mean AOD are also found in the
Amazo-5
nian region, due to biomass burning. Finally, a hot spot appears over the Southwestern USA. The high AOD values there completely disagree with the low values of ground truth, as will be discussed in more details in Sect. 3. The incorrect MODIS retrievals in this region are likely due to a misrepresentation of the land surface and/or assumed aerosol properties in the Dark-Target algorithm (Levy et al., 2010).
10
Figure 1b shows the mean L2 pixel count used in the computation of the L3 AOD values. The mean pixel count over the entire grid is 24.9. On average, 20 % of the L3 AOD values were calculated using no more than 15 pixel counts, and 90 % of them were derived using less than 35 pixel counts. At very high latitudes (poleward of about ±60◦) the pixel-count number is generally less than 10. A very reduced number of
15
L2 pixels is also found over highly reflective surfaces such as deserts and mountains (for instance, Central Australia, Central Asia, Middle-East or Sahara) or regions with high cloudiness (Northern South-America, Alaska or British Isles). The regions with the highest pixel count are mainly distributed along the equatorial belt area and the Southern Hemisphere.
20
2.2 Observational dataset: AERONET network
The ground truth dataset is part of the AERONET federated network (http://aeronet. gsfc.nasa.gov). AERONET provides optical and microphysical properties of aerosols at high temporal resolution and three data quality levels: Level 1.0 (raw, unscreened), Level 1.5 (cloud-screened), and Level 2.0 (cloud screened and quality-assured). In this
25
ACPD
12, 23219–23260, 2012Assessment of the Level 3 MODIS AOD
J. A. Ruiz-Arias et al.
Title Page
Abstract Introduction
Conclusions References
Tables Figures
◭ ◮
◭ ◮
Back Close
Full Screen / Esc
Printer-friendly Version Interactive Discussion
Discussion
P
a
per
|
Dis
cussion
P
a
per
|
Discussion
P
a
per
|
Discussio
n
P
a
per
|
are done routinely for (normally) eight different spectral bands, but none of them is centered at 550 nm. Therefore, the AOD at 550 nm is calculated here from the AOD at 675 nm and the Angstr ¨om exponent derived from the 440 and 870 nm channels. The AOD uncertainty is about 0.01–0.02 (Eck et al., 1999). The collocation between one ground measurement and satellite is assumed to occur only when the ground
5
measurement is within the boundaries of a satellite grid cell that has a non-missing value. In the rare cases where two or more AERONET sites exist inside the same MODIS grid cell, all the ground observations are considered independently.
The total number of stations with collocations during the analyzed period is 525. The availability of ground-truth data changes every day for several reasons, such as
cloud-10
screening, temporary campaigns, experimental problems, or regular off-site calibration. As a result, the average number of collocations per day is only 65.8; 90 % of the days have at least 34 collocations, and 44.6 % of the 525 stations have at least one year of collocations.
Many validation studies have found regional differences in the performance of the
15
L2 AOD (e.g. Levy et al., 2010). Consequently, the results of any validation will be in-variably bound to the spatial distribution of the experimental stations. In this dataset, up to 290 stations are located in North America and Europe, whereas South Amer-ica, Africa and Asia have only a total of 164 stations. The remainder (71 stations) is located in Australia and small islands. These regional differences mean that our global
20
results will be more representative of the North American and European conditions. However, we have also conducted a regional validation in order to achieve meaningful results for each region (Sect. 3.2). Overall, the use of the entire dataset of available AERONET stations during the complete period of L3 AOD data from Terra guarantees the maximum possible significance of the results.
ACPD
12, 23219–23260, 2012Assessment of the Level 3 MODIS AOD
J. A. Ruiz-Arias et al.
Title Page
Abstract Introduction
Conclusions References
Tables Figures
◭ ◮
◭ ◮
Back Close
Full Screen / Esc
Printer-friendly Version Interactive Discussion
Discussion
P
a
per
|
Dis
cussion
P
a
per
|
Discussion
P
a
per
|
Discussio
n
P
a
per
|
3 Comparison against AERONET observations
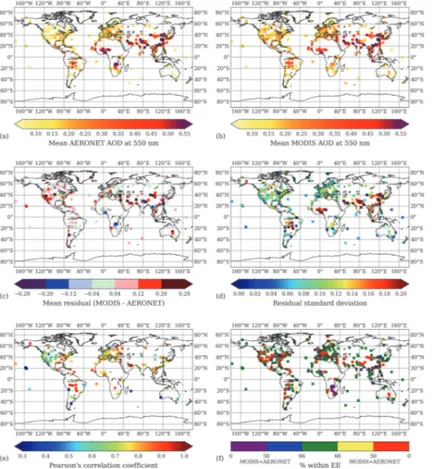
Figure 2 shows some statistical scores calculated from all the AERONET and L3 AOD collocations during the entire study period. Figure 2a, b shows that the mean AERONET and L3 AOD values at 550 nm, respectively, have very similar spatial pat-terns in general. The most striking difference occurs over the Southwestern US, where
5
L3 AOD mean values are significantly larger than AERONET’s, as mentioned earlier. Figure 2c, d, respectively, shows the residual (L3 AOD minus AERONET) and the resid-ual standard deviation (STDe). Overall, most of the European, African and Eastern US locations have a bias below 0.12 (≈20–30 %). MODIS overestimates over the South-western US, Middle East and some Central and Coastal Asian locations. The
overesti-10
mation is high in relative terms (≈100 %, not shown here) over the Southwestern US, since the measured AOD in this region is very small (0.10–0.15). As suggested by Levy et al. (2010), this could result from a misrepresentation of the surface reflectance. The overestimation over the Middle East and Asia is more likely related to deficiencies in the aerosol model, as also reported by Levy et al. (2010). Some occasional
overesti-15
mation is found over other regions as well. For instance, over Hawaii and some other coastal areas, some representativeness problems of the local topography at the (rela-tively coarse) L3 AOD spatial resolution might exist. In Asia and Southern Africa, there are areas with large underestimations, up to≈50 %.
The regions with higher AOD (Asia, Central Africa and South America) are also
20
those with higher STDe (above 0.16). This can be explained by the known fact that MODIS estimates do not cover all the AOD dynamic range for high values. However, when STDe is normalized by the mean AERONET AOD value (not shown here), the result is about 40–50 %, which is not the highest relative STDe. The highest values are actually reached over the Southwestern US and Australia, where they are close
25
ACPD
12, 23219–23260, 2012Assessment of the Level 3 MODIS AOD
J. A. Ruiz-Arias et al.
Title Page
Abstract Introduction
Conclusions References
Tables Figures
◭ ◮
◭ ◮
Back Close
Full Screen / Esc
Printer-friendly Version Interactive Discussion
Discussion
P
a
per
|
Dis
cussion
P
a
per
|
Discussion
P
a
per
|
Discussio
n
P
a
per
|
over some oceanic and coastal locations, Central Asia and the Western US, where it is less. Interestingly, sites with high AOD and STDe (Figs. 2b and 2d) have also a high correlation coefficient, which means that changes in AOD are concomitant in sign but not in magnitude.
3.1 Expected error in the L3 MODIS AOD dataset
5
In the literature so far, L2 MODIS AOD estimates have been typically evaluated in relationship with the expected error (EE) defined as±(0.05+0.15τ) whereτis the true AOD value. If at least 66 % of the MODIS AOD values are concentrated within the interval defined above by EE, the MODIS retrieval algorithm is considered to behave well. The question is whether this EE still holds for the L3 AOD dataset. Figure 2f
10
shows the rate of points within the L2 AOD EE interval at each experimental site, with a distinction between overestimation and underestimation. Overall, there are many stations over the entire dataset where the L2 AOD EE contains even less than 50 % of the data, usually where MODIS overestimates. This result justifies the necessity of a revision of EE for the L3 AOD dataset.
15
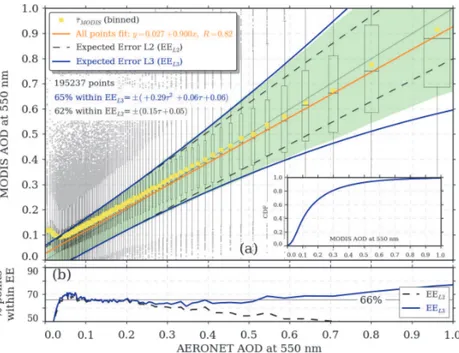
Many results are summarized in Fig. 3a. In particular, it highlights the interval (green shaded area) that contains 66 % of the L3 AOD estimates as a function of the AERONET AOD for the entire study period and all experimental stations. The L3 AOD values were binned into 100 AERONET AOD intervals with an approximately equal number of samples (about 1950 collocations per bin). For each interval, Fig. 3a shows
20
a box representing some exploratory scores of the data: the vertical limits of the box extend from the lower to the upper quartiles, the median is indicated by the horizontal line in the middle of the box, and the yellow square is the mean L3 AOD value in the interval. The whiskers extend to the most extreme point within the (75 %–25 %) data range. That is, the whiskers are as long as the box for each bin. The horizontal position
25
ACPD
12, 23219–23260, 2012Assessment of the Level 3 MODIS AOD
J. A. Ruiz-Arias et al.
Title Page
Abstract Introduction
Conclusions References
Tables Figures
◭ ◮
◭ ◮
Back Close
Full Screen / Esc
Printer-friendly Version Interactive Discussion
Discussion
P
a
per
|
Dis
cussion
P
a
per
|
Discussion
P
a
per
|
Discussio
n
P
a
per
|
the AERONET measurements for a ground-truth AOD below 0.4 and underestimate above 0.5. This effect is also apparent in the all-point fit (orange line). Additionally, since the (theoretical) dynamic range of AOD only sweeps positive values, the spread of the data increases with the mean value for both the MODIS and AERONET mea-surements. This is shown by the increase of the length of the whiskers and the width
5
of the boxes.
In Fig. 3a, the black dashed line is the EE for the L2 AOD dataset. If the EE limits fitted the boundaries of the green shaded region, the L2 AOD EE would also hold for the L3 AOD dataset. From Fig. 3a, it is clear that the L2 AOD EE indeed fits the L3 AOD EE interval only for AOD values below about 0.3–0.4. For AODs greater than 0.3
10
the interval containing 66 % of the L3 AOD measurements becomes larger than what the L2 AOD EE predicts, meaning that the L3 AOD product is more uncertain than the L2 AOD product. This is also apparent in Fig. 3b, which plots the amount of points (as a percentage) within the EE limits. The reason for the uncertainty increase at large AODs may be found in the fact that the averaging process involved to obtain the L3 data
15
from the L2 dataset actually removes some of the L2 spatio-temporal variability. This is particularly important for large AODs because the departures from the mean value are greater, and so are the errors caused by the averaging process. Nevertheless, according to the inset plot in Fig. 3a, up to 80 % of the data points are below an AOD of 0.3, for which the L2 AOD EE is still valid.
20
The observed increased uncertainty in the L3 dataset for large AOD values cannot be accommodated with linear EE limits over the whole AOD range. Instead, we pro-pose a quadratic model that fits the L3 data better overall (in the least squares sense): ±(0.29τ2+0.06τ+0.06), which is plotted as the blue line in Fig. 3a. Note that the L2 AOD EE and the L3 AOD EE match well for small AODs. In contrast, the L3 AOD
25
ACPD
12, 23219–23260, 2012Assessment of the Level 3 MODIS AOD
J. A. Ruiz-Arias et al.
Title Page
Abstract Introduction
Conclusions References
Tables Figures
◭ ◮
◭ ◮
Back Close
Full Screen / Esc
Printer-friendly Version Interactive Discussion
Discussion
P
a
per
|
Dis
cussion
P
a
per
|
Discussion
P
a
per
|
Discussio
n
P
a
per
|
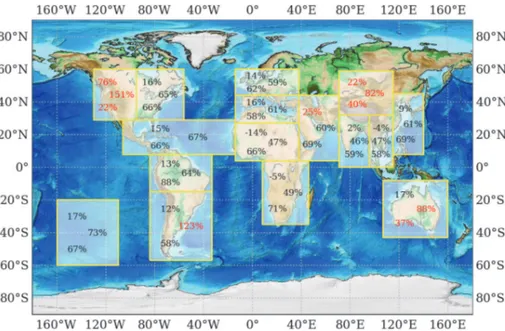
3.2 Regional analysis
It is instructive to study the behavior of the L3 AOD dataset over different regions, so as to provide a more detailed and organized general description than what is summarized in Fig. 2. In this respect, the experimental dataset has been divided into 15 different geographical regions. These are based on previous analyses and global studies, such
5
as those of Remer et al. (2008) and Levy et al. (2010), and are depicted in Fig. 4. For each region, Fig. 4 provides (from top to bottom) the mean bias error (MBE, obtained as L3 AOD minus AERONET), the root mean square error (RMSE), both normalized to the averaged measured value, and the squared Pearson correlation coefficient (R2). All these values were calculated using all the stations in each region over the entire study
10
period. Poor results (MBE values above 20 %, RMSE values above 80 %, andR2below 50 %) are highlighted in red. Western North America, Central Asia and Australia show such poor results. Particularly, Western North America has the poorest performance, with a MBE of 76 %, a RMSE of 151 %, and aR2of only 22 %. For all the other regions, the MBE is below 17 %, except in the Middle East, where it reaches 25 %; the RMSE
15
remains in the range 46–67 %, except in South America (123 %), whereasR2is always around or above 60 %.
Table 1 provides some additional statistics: number of experimental points (N), MBE and RMSE (AOD unit), as well as the rate of samples within the EE intervals of the L2 and L3 AOD datasets. The last column displays the quadratic expression obtained for
20
the L3 AOD EE limits of each region. Overall, the MBE is always below 0.1 (in absolute terms), whereas RMSE exceeds 0.20 only in those regions with a mean AERONET AOD above 0.30, such as over the Amazon, Sahara, Middle East, or some Asian re-gions. Note that, compared to the mean AERONET AOD, the RMSE is high over West-ern North America, South America, Australia and Central Asia. More particularly, over
25
ACPD
12, 23219–23260, 2012Assessment of the Level 3 MODIS AOD
J. A. Ruiz-Arias et al.
Title Page
Abstract Introduction
Conclusions References
Tables Figures
◭ ◮
◭ ◮
Back Close
Full Screen / Esc
Printer-friendly Version Interactive Discussion
Discussion
P
a
per
|
Dis
cussion
P
a
per
|
Discussion
P
a
per
|
Discussio
n
P
a
per
|
Amazon. Conversely, the newly proposed L3 AOD EE always defines an interval en-compassing between 65 % and 68 % of the data, for all regions. Overall, and for all regions, the L3 AOD EE indicates a higher EE of the L3 AOD dataset for large AODs. However, for small AODs in some regions, their EE is less than for the L2 AOD dataset, such as over Eastern North America, Europe, Africa or Australia. Globally, the EE for
5
small AODs is about 0.06, in similarity with the L2 AOD EE (0.05).
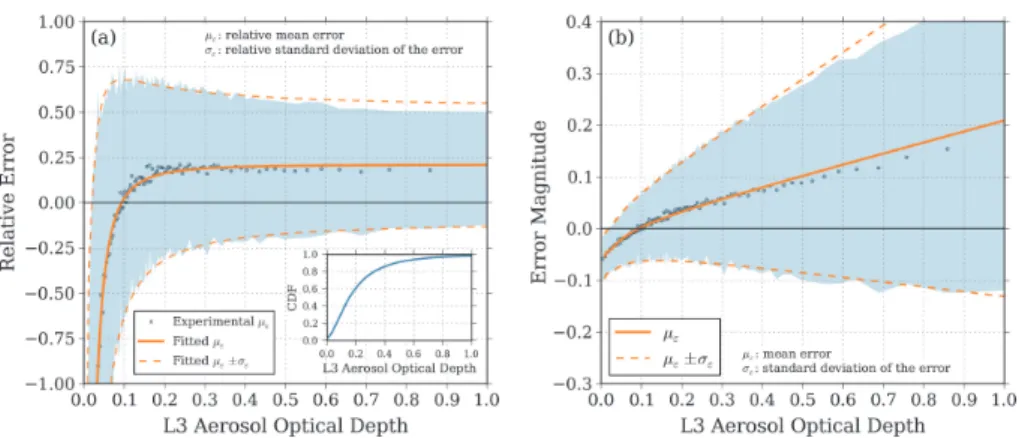
3.3 Uncertainty as a function of the L3 AOD value
For some applications the uncertainty associated with the AOD data is needed. How-ever, a description based on EE (Table 1) is not always useful because it is based on the “true” AOD value (in practice, ground sunphotometric measurements), which is
10
rarely known. It is possible to follow a similar approach to that in the previous section, this time expressing the uncertainty as a function of the retrieved L3 AODs. To that ef-fect, the L3 AOD residuals (L3 AOD minus AERONET AOD) have been grouped in 100 equal-sized intervals of L3 AOD. In each bin, their mean and standard deviation have been calculated and normalized by the mean L3 AOD for that bin. Figure 5a shows
15
the relative mean error (blue points) and the uncertainty interval defined as the relative mean error plus or minus one relative standard deviation of the error (shaded region), for the entire dataset, as a function of the L3 AOD value. A justification for character-izing the uncertainty with the standard deviation of the error rather than the EE as in Sect. 3.2 is offered in Sect. 5.
20
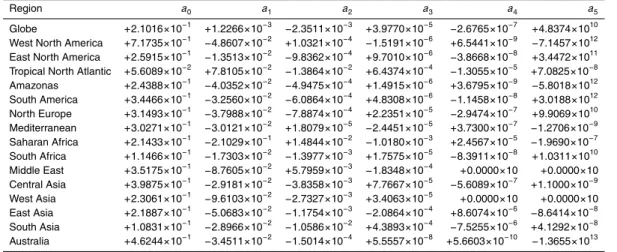
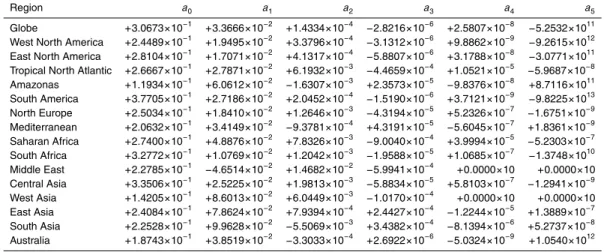
Both the relative mean error and relative standard deviation of the error can be mod-eled using a fifth-order polynomial, such as:
∆L3=a0+a1η+a2η2+a3η3+a4η4+a5η5, (1)
where∆L3is either the relative mean error or the relative standard deviation of the error,
andη=1/τ, withτbeing the L3 AOD value. The coefficientsai are listed in Tables A1
25
ACPD
12, 23219–23260, 2012Assessment of the Level 3 MODIS AOD
J. A. Ruiz-Arias et al.
Title Page
Abstract Introduction
Conclusions References
Tables Figures
◭ ◮
◭ ◮
Back Close
Full Screen / Esc
Printer-friendly Version Interactive Discussion
Discussion
P
a
per
|
Dis
cussion
P
a
per
|
Discussion
P
a
per
|
Discussio
n
P
a
per
|
(R2) above 92 %. For the case shown in Fig. 5, i.e. the entire dataset, the fitted curves (orange lines) are very close to those experimental points whose L3 AOD is below 0.5, thus representing≈90 % of the dataset (inset of Fig. 5a).
Figure 5a shows a rapid increase of the relative underestimation when the L3 AODs are below 0.1. Above that threshold, a fairly constant relative overestimation is typical
5
in the satellite retrievals. This is also true for the relative standard deviation of the error. In Fig. 5b, this translates into a linear increase of both the mean error and the standard deviation for L3 AODs larger than 0.1. For smaller values, the satellite retrievals tend to be too low compared to ground truth. This underestimation increases when AOD decreases. This behavior is general, even for the Western US. In this particular case
10
(not shown here), the overestimation becomes noticeable above≈0.05, whereas the asymptotic relative error exceeds 50 % beyond 0.2.
4 The role of pixel count
Section 1.1 describes how the L3 AOD dataset is derived from the L2 AOD data. This procedure intrinsically defines the number of L2 AOD points – or pixel count – used
15
to calculate each L3 AOD value. Levy et al. (2009) conducted a detailed study on the impact that different strategies of averaging could have on spatio-temporal aggre-gations of L2 AOD values such as for L3 AOD. They concluded that the differences between different averaging approaches may be greater – or, at least, of the same or-der – than differences between different measurement sensors. One of the cases they
20
analyzed was a weighting scheme based on pixel-count values. The use of pixel count as a weight is reasonable by assuming a higher reliability for those L3 AOD values derived with a greater pixel-count number. However, the direct relationship between pixel count and L3 AOD reliability has apparently not been analyzed in the literature yet. Nonetheless, this relationship can be important for subsequent aggregations of L3
25
ACPD
12, 23219–23260, 2012Assessment of the Level 3 MODIS AOD
J. A. Ruiz-Arias et al.
Title Page
Abstract Introduction
Conclusions References
Tables Figures
◭ ◮
◭ ◮
Back Close
Full Screen / Esc
Printer-friendly Version Interactive Discussion
Discussion
P
a
per
|
Dis
cussion
P
a
per
|
Discussion
P
a
per
|
Discussio
n
P
a
per
|
in the data quality assurance procedure, or in a weighting scheme to combine L3 AOD values, for instance. A pixel count is provided for every grid cell in the L3 AOD dataset, and this information is used in what follows.
Figure 6 shows the joint histogram of the L3 AOD residuals (L3 AOD minus AERONET AOD) binned by either a combination of pixel count and AERONET AOD
5
(Fig. 6a), or of pixel counts and cloud fraction (Fig. 6b), for all available collocations during the studied period. The mean residual for all points forming each column bin (green line), and the fraction of points in that bin (grey bars), both appear in the plot above each joint histogram. Likewise, the plot to the right of each joint histogram con-tains the mean residual for all the points forming each pixel-count bin (green line) and
10
the fraction of points in that bin (grey bars). The joint histogram in Fig. 6a, similarly to Fig. 3, shows that the L3 MODIS retrievals are too high for small AODs and too low for high AODs. This was a known issue in the L2 AOD dataset, which therefore propagates to the L3 product. Overall, since≈80 % of the data have a L3 AOD below 0.3, MODIS retrievals are too high in general. According to Fig. 4, MODIS only underestimates in
15
Africa and some parts of Asia. Possible causes of these biases are discussed by Levy et al. (2010).
Interestingly, a trend in the residual is also observed for the pixel counts (right plot in Fig. 6a). L3 AODs calculated with less than 50 pixel counts (about 90 % of the dataset) tend to overestimate, whereas they underestimate in the case of larger pixel counts.
20
According to Fig. 6b, there is no L3 grid point with both a high cloud fraction and a large pixel count. Thus, the underestimation for points calculated with a large pixel count is dominated by cloudless conditions, whereas the low pixel count in the other L3 grid points is partly caused by the cloud screening algorithms. It is known that clouds cause an overestimation of AOD in the MODIS algorithm retrievals. This can partially
25
ACPD
12, 23219–23260, 2012Assessment of the Level 3 MODIS AOD
J. A. Ruiz-Arias et al.
Title Page
Abstract Introduction
Conclusions References
Tables Figures
◭ ◮
◭ ◮
Back Close
Full Screen / Esc
Printer-friendly Version Interactive Discussion
Discussion
P
a
per
|
Dis
cussion
P
a
per
|
Discussion
P
a
per
|
Discussio
n
P
a
per
|
all regions, but with more or less magnitude depending on regional climatic conditions. A simple third-order polynomial could be used to remove the trend. However, the re-gional variability of the trend prevents the use of a unique function. Instead, we suggest to analyze the dataset at hand to derive a correction function for that specific dataset or region. For instance, using the entire dataset in this study, the L3 AOD EE after the
5
pixel-count trend correction becomes±(0.21τ2+0.12τ+0.05), which slightly reduces the EE error for AODs below 0.25 and above 0.5. The correction could be better if applied, as mentioned, at a regional scale. When aggregating L3 AOD values, another possibility is to discard all AODs corresponding to pixel counts larger or smaller than certain limits.
10
The consequence of the pixel-count trend just described is that great care must be taken when the pixel count is used as a weighting parameter to combine L3 AOD values. In particular, it is interesting to examine the use of the pixel-count weighting average as method to aggregate L3 AOD over time. As discussed earlier, the L3 AOD dataset tends to underestimate for large pixel counts. The use of pixel count as weight
15
would therefore assign more relative importance to AOD values that are systematically smaller than ground-truth. Furthermore, since the MODIS AOD retrievals generally tend to overestimate ground-truth (Fig. 4), the overall overestimation happens to be corrected just by cancellation of errors. However, this general MODIS overestimation does not occur over all regions. In particular, over any specific region where the satellite
20
retrievals tend to underestimate, the use of the pixel-count weighting scheme would result in less accurate AODs than those from an unweighted average.
5 Spatial representativeness uncertainty
Section 3.3 provided an estimate of the total mean bias and uncertainty of L3 AODs by comparison with daily AERONET measurements. This uncertainty is mainly caused by
25
ACPD
12, 23219–23260, 2012Assessment of the Level 3 MODIS AOD
J. A. Ruiz-Arias et al.
Title Page
Abstract Introduction
Conclusions References
Tables Figures
◭ ◮
◭ ◮
Back Close
Full Screen / Esc
Printer-friendly Version Interactive Discussion
Discussion
P
a
per
|
Dis
cussion
P
a
per
|
Discussion
P
a
per
|
Discussio
n
P
a
per
|
temporal resolutions of the L3 MODIS dataset. These errors are also known as spa-tial and temporal representativeness uncertainties, respectively. One particular aspect of this issue is that L3 AOD values representative of a 1◦×1◦ grid cell are compared to spot ground-truth measurements. It can be expected that the importance of this is-sue increases with topographic complexity and average cell elevation. It is important to
5
know how much these representativeness errors contribute to the overall uncertainty, and whether the spatio-temporal resolution of the L3 AOD product is a limiting factor in achieving a smaller uncertainty.
Kaufman et al. (2000) showed that, for any single location, the instantaneous re-trievals at overpass times could be used to represent the daily AOD average at that
10
location within reasonable accuracy. Here, we compare the (daily) L3 AOD product at a coarse 1◦×1◦ spatial resolution against daily averages at specific AERONET sites (i.e. spot measurements). Can such a large pixel size represent the spatial variability of AOD, and be appropriate for the comparison with spot ground measurements?
Along with the AOD at 550 nm and pixel count, the L3 AOD product provides the
15
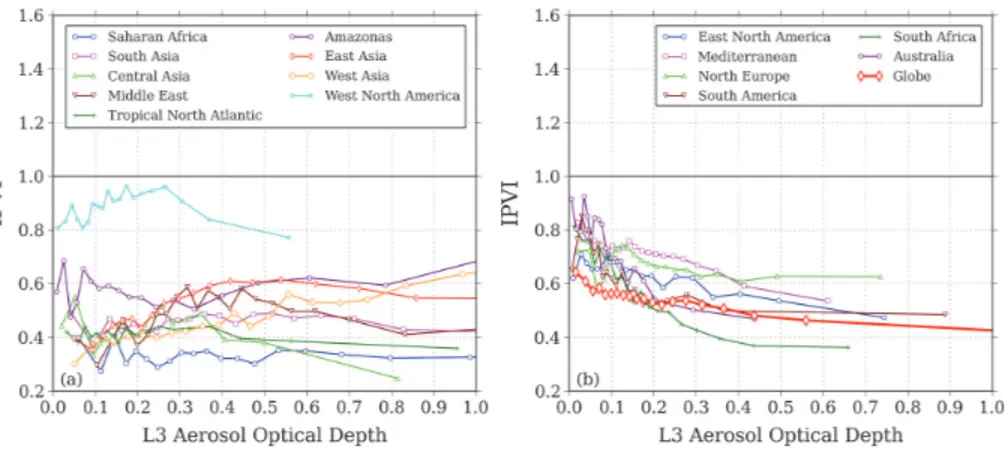
standard deviation of the L2 AOD values used in the aggregation leading to the L3 product. This standard deviation can be used as an estimate of the intra-pixel vari-ability of AOD. By doing this, we are intrinsically assuming that the L2 AOD retrievals capture the intra-pixel variability of AOD, even though this does not necessarily mean a negligible overall mean error. Figure 7 shows the “intra-pixel variability index” (IPVI),
20
i.e. the ratio of the standard deviation of the intra-pixel L2 AOD values,σs, provided as part of the L3 AOD product, to the standard deviation of the L3 AOD error as compared to ground AERONET measurements,σε, (Sect. 3.3). Note that this ratio should never
be larger than unity, because the spatial representativeness uncertainty is part of the total uncertainty.
25
ACPD
12, 23219–23260, 2012Assessment of the Level 3 MODIS AOD
J. A. Ruiz-Arias et al.
Title Page
Abstract Introduction
Conclusions References
Tables Figures
◭ ◮
◭ ◮
Back Close
Full Screen / Esc
Printer-friendly Version Interactive Discussion
Discussion
P
a
per
|
Dis
cussion
P
a
per
|
Discussion
P
a
per
|
Discussio
n
P
a
per
|
spatial representativeness uncertainty. This might be a consequence of the problems of the Dark-Target MODIS retrieval algorithm over that region, discussed earlier. On the other hand, in those regions with lower aerosol load and high relative importance of the fine aerosol mode (Fig. 7b), such as Eastern North America, Europe, South America and Southern Africa, IPVI decreases from≈80 % down to≈50 % when the L3
5
AOD increases. The entire dataset, as a region (Globe), is also in this group. Australia, however, seems to be a notable exception to this pattern.
In rough terms overall, the spatial representativeness uncertainty contributes≈50 % to the total uncertainty of the L3 AOD. The remaining ≈50 % is attributable to other errors. The only exception to this rule is for AODs below 0.1 over fine-mode-dominated
10
regions, where the importance of the spatial representativeness error increases.
6 Induced uncertainty in surface solar irradiance
AOD is the main variable driving DNI under cloudless skies. Its impact is about 3 to 4 times larger on DNI than on GHI (Gueymard, 2012). Therefore, AOD is a key el-ement in DNI modeling. Numerical Weather Prediction and radiative transfer models
15
are applied to vast areas, so that an accurate prediction of DNI (and, to a lesser ex-tent, GHI) requires a gridded AOD dataset with sufficient spatio-temporal resolution and geographical coverage. Gueymard (2012) indicated the convenience of daily AOD to capture the daily DNI variations. Moreover, Sect. 5 showed that the spatial represen-tativeness uncertainty associated with the L3 AOD is about half of the total uncertainty.
20
ACPD
12, 23219–23260, 2012Assessment of the Level 3 MODIS AOD
J. A. Ruiz-Arias et al.
Title Page
Abstract Introduction
Conclusions References
Tables Figures
◭ ◮
◭ ◮
Back Close
Full Screen / Esc
Printer-friendly Version Interactive Discussion
Discussion
P
a
per
|
Dis
cussion
P
a
per
|
Discussion
P
a
per
|
Discussio
n
P
a
per
|
A sensitivity analysis can be conducted with the help of the REST2 broadband solar radiation model (Gueymard, 2008), using uncertainty propagation theory:
∆Eb=
∂Eb
∂τ
∆
τ, (2)
whereEbis the DNI,∆τis the AOD uncertainty and∆Ebis the uncertainty in DNI due
to∆τalone.
5
Figure 8a shows the relative uncertainty in DNI (∆Eb/Eb) as a function of AOD
for each geographical region. It is obtained from Eq. (2), using the AOD uncertainty expressed as the EE provided in the last column of Table 1. The sensitivity term
∂Eb ∂τ
is calculated numerically with the REST2 model, while keeping all the inputs
to the model fixed to standard values and varying only AOD. The chosen standard
10
values are: solar zenith angle,θ=30◦ and 60◦, atmospheric pressure=1013.25 hPa,
precipitable water=1.5 cm, ozone amount=0.35 atm cm (350 DU), nitrogen dioxide=
0.0002 atm cm, and Angstr ¨om exponent=1.3. Forθ=30◦, a similar relative uncertainty in DNI is found over all regions, i.e. below 15 % for AOD smaller than 0.5. For larger AODs, differences between regions increase. In the case of Western North America,
15
a large increase of the relative uncertainty occurs for AODs larger than 0.4. However, AOD in this region hardly exceeds 0.5, thus the relative uncertainty is usually below 20 %.
Figure 8b shows the magnitude and relative value of the DNI uncertainty for the entire dataset and the two solar zenith angles (30◦ and 60◦). The relative uncertainty
20
increases by 30–40 % when the solar zenith angle increases from 30◦to 60◦. However, the absolute uncertainty (blue-shaded region) does not simultaneously increase.
Whereas both DNI and GHI are essential in energy applications, and particularly solar resource assessments, GHI is the normal (if not only) radiative output of NWP, reanalysis or climate models. Figure 9 shows the same sensitivity analysis as in Fig. 8
25
ACPD
12, 23219–23260, 2012Assessment of the Level 3 MODIS AOD
J. A. Ruiz-Arias et al.
Title Page
Abstract Introduction
Conclusions References
Tables Figures
◭ ◮
◭ ◮
Back Close
Full Screen / Esc
Printer-friendly Version Interactive Discussion
Discussion
P
a
per
|
Dis
cussion
P
a
per
|
Discussion
P
a
per
|
Discussio
n
P
a
per
|
contrarily to DNI, the uncertainty now decreases as AOD increases. This is due to the opposite effect of AOD on DNI and diffuse irradiances: an increase of AOD reduces DNI and simultaneously enhances diffuse irradiance. Therefore, uncertainties in DNI and diffuse irradiance due to AOD tend to cancel each other. The smaller relative impact of AOD on GHI, comparatively to DNI, appears in Fig. 9b: when AOD increases from 0 to
5
1, GHI decreases by only≈13 %, whereas DNI decreases by≈50 %.
Based on this analysis, Fig. 10 further shows the relative uncertainties in DNI and GHI caused by L3 AOD errors but, this time, at AERONET sites. These results are calculated from the mean measured AOD values at each site (Fig. 2a) and with the same approach as in Figs. 8 and 9, i.e., considering the AOD uncertainty as the L3
10
AOD EE. The highest relative uncertainties in DNI (≈12–15 %) occur in Asia, Northern and Southern Africa (Fig. 10a), coinciding with the highest measured AODs, as could be expected from the results in Fig. 8a. Note that, according also to Fig. 8a, the DNI relative uncertainty over Western North America is larger (per unit AOD) than in the rest of regions, at high AODs. However, when using measured AODs (Fig. 10a), the
15
relative uncertainty in DNI is only around 8 %, far from the regions with the highest uncertainty. An explanation is that the measured AOD over Western North America is typically low (with a mean of 0.10), and thus the uncertainty in DNI also remains low. In parallel, the sudden change in DNI uncertainty from the Western to the Eastern North America is a direct consequence of the much poorer L3 AODs in the former region.
20
Figure 10b shows the relative uncertainty in GHI. Now, and contrarily to the DNI case, Western North America is the region with the highest relative uncertainty (about 5 %). Again, this is a consequence of the very low mean measured AODs. By comparison with Fig. 9a, it can be seen that the relative uncertainty in GHI is maximum for an AOD value of about 0.10. The large difference between Western and Eastern North America
25
ACPD
12, 23219–23260, 2012Assessment of the Level 3 MODIS AOD
J. A. Ruiz-Arias et al.
Title Page
Abstract Introduction
Conclusions References
Tables Figures
◭ ◮
◭ ◮
Back Close
Full Screen / Esc
Printer-friendly Version Interactive Discussion
Discussion
P
a
per
|
Dis
cussion
P
a
per
|
Discussion
P
a
per
|
Discussio
n
P
a
per
|
in GHI decreases as AOD increases, and consequently the GHI uncertainty is low in those regions.
7 Conclusions
We have presented a global validation of the combined land and ocean Level-3 MODIS AOD product (Collection 5.1) at 550 nm from the Terra satellite, and investigated its
suit-5
ability for surface solar radiation calculations in numerical weather or radiative transfer modeling.
The study has been conducted at both global and regional scales, based on the Terra satellite dataset (2000–2011) and the collocated daily measurements from the AERONET radiometric network at 525 stations, used as ground truth. Globally, the L3
10
AOD dataset overestimates by 17 %, with a RMSE of 73 % and a squared Pearson correlation coefficient of 67 %. On a regional basis (using 15 distinct geographical re-gions), the MBE varies between 2 % (Eastern Asia) and 76 % (Western North America). In parts of Northern and Southern Africa and Asia, the L3 AOD is too low, whereas too large values are found over Central Asia, Middle East and (most particularly) Western
15
North America. The regional RMSE is always larger than 50 %, with specially high val-ues for Western North America (151 %), South America (123 %), Central Asia (82 %) and Australia (88 %).
The Level-3 MODIS AOD consists of a spatial aggregation of the Level-2 MODIS AOD, so a key question addressed in this study is about the L3 AOD reliability
com-20
pared to that of the original L2 AOD. This comparison uses the expected error, EE, which is defined as the interval around the true AOD that contains 66 % of the MODIS AOD estimates. Overall, the aggregation from L2 AOD to L3 AOD increases EE for AODs greater than about 0.3, which approximately correspond to 20 % of the highest values. For the remaining 80 %, the L2 AOD EE and the L3 AOD EE are very similar.
25
ACPD
12, 23219–23260, 2012Assessment of the Level 3 MODIS AOD
J. A. Ruiz-Arias et al.
Title Page
Abstract Introduction
Conclusions References
Tables Figures
◭ ◮
◭ ◮
Back Close
Full Screen / Esc
Printer-friendly Version Interactive Discussion
Discussion
P
a
per
|
Dis
cussion
P
a
per
|
Discussion
P
a
per
|
Discussio
n
P
a
per
|
EE provides an estimate of the MODIS AOD uncertainty in terms of the AOD deter-mined from ground truth. Since, in general, this ”true” AOD is unknown, we developed a model for the L3 AOD uncertainty that provides both the mean error and standard deviation of the error as a function of the L3 AOD. This model shows that, for the entire dataset and AODs greater than 0.1, the L3 AOD overestimates. Furthermore, both the
5
mean error and the standard deviation of the error increase linearly with L3 AOD. For L3 AODs below 0.1, the satellite retrievals underestimate, and both this underestima-tion and the standard deviaunderestima-tion of the error increase as the L3 AODs decrease. We provide error functions for the entire dataset and for each region separately.
We have also investigated the role of the pixel count in the reliability of the L3 AOD.
10
Even though one might expect a higher reliability for larger pixel counts, the L3 AODs derived with small pixel counts tend to overestimate. Conversely, L3 AODs derived with large pixel counts tend to underestimate. This occurs in both the global dataset and for each individual region. However, each region has its peculiarities. Consequently, the assumption of a higher reliability in the L3 AODs for larger pixel counts must be adopted
15
only with caution and, ideally, should be checked for each spatio-temporal dataset. We have explored the relative contribution of the spatial representativeness uncer-tainty to the overall unceruncer-tainty of the L3 AOD. We used the standard deviation of the L2 AOD values used to calculated the L3 AOD as an estimate of the spatial represen-tativeness uncertainty in the L3 AOD. By comparing this against the standard deviation
20
of the error obtained in Sect. 3.3 we found that, overall, the spatial representativeness uncertainty is roughly similar to the other errors associated with the L3 AOD. Therefore, the L3 AOD’ spatial representativeness uncertainty is not a limiting factor of its reliabil-ity. However, this result suggests that, when the quality of the AOD retrievals eventually improves (as can be anticipated), the spatial resolution of the L3 AOD should be
en-25
hanced.
ACPD
12, 23219–23260, 2012Assessment of the Level 3 MODIS AOD
J. A. Ruiz-Arias et al.
Title Page
Abstract Introduction
Conclusions References
Tables Figures
◭ ◮
◭ ◮
Back Close
Full Screen / Esc
Printer-friendly Version Interactive Discussion
Discussion
P
a
per
|
Dis
cussion
P
a
per
|
Discussion
P
a
per
|
Discussio
n
P
a
per
|
smaller than≈15 % for AOD values below 0.5 (90 % of the global dataset) and a solar zenith angle of 30◦. Under this same condition, the relative uncertainty induced in GHI is always below 5 %. At regional scale, the L3 AOD is therefore of sufficient overall quality to produce good-enough GHI estimates, but, conversely, this is not generally the case for DNI. In spite of this significant AOD-induced uncertainty in DNI, we
con-5
sider the daily L3 AOD dataset very valuable because it has the advantage to generate a correct daily variability in DNI, which is important in solar energy applications. Of course, any monthly AOD dataset derived from the daily L3 AOD will also be affected by the uncertainties discussed here.
Acknowledgements. The authors would like to thank the AERONET Science Team for
estab-10
lishing and maintaining the sites used in this investigation, and the MODIS Science Team for the processing and public availability of the Collection 5.1 Level-3 aerosol products. J.A. Ruiz-Arias and D. Pozo-V ´azquez were funded by a Marie Curie Action under the project PIOF-GA-2010-273648 within the 7th European Community Framework Programme, the Spanish Ministry of Science and Innovation under the project CGL2011-30377-C02-01 and the University of Ja ´en
15
and Caja Rural de Ja ´en under the project R1/13/2010/01.
References
Anderson, T., Charlson, R., Winker, D., Ogren, J., and Holm ´en, K.: Mesoscale variations of tropospheric aerosols, J. Atmos. Sci., 60, 119–136, 2003. 23221
Cebecauer, T., ˇS ´uri, M., and Gueymard, C.: Uncertainty sources in satellite-derived direct
nor-20
mal irradiance: how can prediction accuracy be improved globally?, in: Proc. SolarPACES Conf., Granada, Spain, 2011. 23222
Chen, S., Wang, S., and Waylonis, M.: Modification of Saharan air layer and environmental shear over the Eastern Atlantic Ocean by dust-radiation effects, J. Geophys. Res., 115, D21202, doi:10.1029/2010JD014158, 2010. 23221
25
ACPD
12, 23219–23260, 2012Assessment of the Level 3 MODIS AOD
J. A. Ruiz-Arias et al.
Title Page
Abstract Introduction
Conclusions References
Tables Figures
◭ ◮
◭ ◮
Back Close
Full Screen / Esc
Printer-friendly Version Interactive Discussion
Discussion
P
a
per
|
Dis
cussion
P
a
per
|
Discussion
P
a
per
|
Discussio
n
P
a
per
|
Gueymard, C.: Uncertainties in modeled direct irradiance around the sahara as affected by aerosols: are current datasets of bankable quality?, J. Sol. Energy Eng., 133, 031024, doi:10.1115/1.4004386, 2011. 23222
Gueymard, C.: Temporal variability in direct and global irradiance at various time scales as affected by aerosols, Sol. Energy, doi:10.1016/j.solener.2012.01.013, in press, 2012. 23221,
5
23222, 23239
Gueymard, C. A.: REST2: High-performance solar radiation model for cloudless-sky irradiance, illuminance, and photosynthetically active radiation – validation with a benchmark dataset, Sol. Energy, 82, 272–285, doi:10.1016/j.solener.2007.04.008, 2008. 23240
Hoelzemann, J., Longo, K., Fonseca, R., Do Rosario, N., Elbern, H., Freitas, S., and Pires, C.:
10
Regional representativity of AERONET observation sites during the biomass burning season in South America determined by correlation studies with MODIS Aerosol Optical Depth, J. Geophys. Res., 114, D13301, doi:10.1029/2008JD010369, 2009. 23225
Holben, B., Eck, T., Slutsker, I., Tanre, D., Buis, J., Setzer, A., Vermote, E., Reagan, J., Kauf-man, Y., Nakajima, T., Lavenu, F., Jankowiak, I., and Smirnov, A.: AERONET – a federated
15
instrument network and data archive for aerosol characterization, Remote Sens. Environ., 66, 1–16, 1998. 23221
Hsu, N., Tsay, S., King, M., and Herman, J.: Aerosol properties over bright-reflecting source regions, Geosci. Remote Sens. IEEE Trans., 42, 557–569, 2004. 23223
Hubanks, P., King, M., Platnick, S., and Pincus, R.: MODIS atmosphere L3 gridded product
20
algorithm theoretical basis document Collection 005 Version 1.1, Tech. Rep. ATBD-MOD-30, NASA, 2008. 23224
Ichoku, C., Chu, D., Mattoo, S., Kaufman, Y., Remer, L., Tanr ´e, D., Slutsker, I., and Holben, B.: A spatio-temporal approach for global validation and analysis of MODIS aerosol products, Geophys. Res. Lett., 29, 8006, doi:10.1029/2001GL013206, 2002. 23225
25
IPCC: Contribution of Working Group I to the Fourth Assessment Report of the Intergovern-mental Panel on Climate Change, in: Climate Change 2007: The Physical Science Basis, edited by: Solomon, S., Qin, D., Manning, M., Marquis, M., Averyt, K. M. B., Tignor, M., Miller, H. L., and Chen, Z., Cambridge University Press, Cambridge, UK, 2007. 23221 Jaenicke, R.: Aerosol-cloud-climate interactions, Chap. Tropospheric aerosols, International
30
Geophysics Series, Academic Press, San Diego, California, 1993. 23221