THE IMPACT OF USER-GENERATED CONTENT ON
FACEBOOK ADVERTISING PERFORMANCE
Francisco de Bivar Velho da Costa Campos
Dissertation submitted in partial fulfilment of the requirements for the degree of MSc in Business Administration at CATÓLICA LISBON School of Business & Economics
ADVISOR: Ana Isabel Almeida Costa December 2015
2 The Impact of User-generated Content on Facebook Advertising Performance.
Francisco de Bivar Velho da Costa Campos. ABSTRACT
Social media have strengthened the role of each consumer who have now multiple ways to create content, through product reviews, and rates, for instance. These contents, also known as user-generated content (UGC) have become one of the most important communication channels about brands, since, through it, peers can greatly influence other consumers in their purchase decisions.
Particularly on social networks, namely on Facebook, UGC, which may take the form of post likes, post comments, shares and page mentions, is rapidly diffused among Facebook friends, making users that were not initially targeted by companies being exposed to their advertising campaigns.
This dissertation analyzes the individual impact that Facebook UGC has on advertising performance. The findings from our research complement the academic literature and support the importance of social WOM for companies’ advertising performance. Also, firms can use our results in order to optimize their Facebook advertising campaigns and thus achieve better results. In particular, firms should engage Facebook followers to interact through post likes and post shares. However, we conclude that post comments are not a driver of Facebook advertising performance.
On the other hand, several content design decisions should be undertaken by companies. Our analysis suggests that using a sense of urgency on the post image has a positive impact on advertising performance, whereas the same content written on the post description is expected to negatively impact advertising performance. Additionally, our research shows that writing a discount price or a discount percentage on post images also contributes to advertising performance.
3 The Impact of User-generated Content on Facebook Advertising Performance.
Francisco de Bivar Velho da Costa Campos. SUMÁRIO
O marketing digital veio reforçar o papel do consumidor, o qual passou a dispor de múltiplas alternativas para produzir conteúdos através, por exemplo, de reviews e avaliações de produtos. Estes conteúdos, conhecidos na literatura internacional como user-generated content (UGC), constituem um dos canais de comunicação mais importantes para as empresas, influenciando eficazmente as decisões de compra de outros consumidores.
Nas redes sociais, nomeadamente no Facebook, o UGC, isto é, os likes, comentários, partilhas e menções de um utilizador, é automaticamente partilhado com os seus amigos, chegando os anúncios das empresas a uma audiência muito superior ao inicialmente previsto.
Esta dissertação analisa o impacto que o UGC, em resposta a campanhas publicitárias no Facebook, produz na performance das mesmas.
Os resultados obtidos complementam a literatura existente e reafirmam a importância do social WOM na performance dos anúncios no Facebook. Por outro lado, as empresas poderão utilizar os resultados no sentido de otimizarem as suas campanhas e, assim, atingirem melhores resultados. Nomeadamente, as empresas deverão incentivar a sua audiência a gostar e a partilhar as mesmas. Contudo, conclui-se que os comentários numa publicação não contribuem para a sua performance.
Por outro lado, a nossa análise sugere que o uso de uma mensagem de urgência na imagem das campanhas contribui positivamente para a sua performance, enquanto que, quando inserida na descrição da publicação, conduz a efeitos adversos. Adicionalmente, a nossa investigação sugere que incluir um preço promocional ou uma percentagem de desconto na imagem das campanhas contribui para a performance das mesmas.
4 ACKNOWLEDGEMENTS
The submission of this dissertation is the end of an important stage of my life. As such, this is the time to show my gratitude to all the persons who have supported me through this long journey. Starting with my family and friends, who have always helped and supported me. Without them I wouldn’t be submitting this dissertation.
I would also like to express my gratitude to Professor Ana Isabel Almeida Costa for her continued support, guidance, dedication and invaluable input. Finally, I would like to further thank VAN, particularly Pedro Rosa, for providing all the data for my analysis.
5 TABLE OF CONTENTS 1.1 Background ...8 1.2 Problem statement ...9 1.3 Aim ...9 1.4 Scope ...9 1.5 Research method ...10 1.6 Relevance ...11 1.7 Dissertation outline ...12
2.1 e-WOM and UGC in Social Networks ...13
2.2 Facebook Ads...15
2.3 Metrics used to evaluate Facebook Advertising Performance ...15
2.4 Social Networks in Portugal ...16
2.5 Conclusions and Research Hypothesis ...17
3.1 Research Approach and Methods ...19
3.2 Quantitative Secondary Research ...19
3.2.1 Dataset and Sample ...19
3.2.2 Dependent Variables ...20
3.2.3 Independent Variables ...20
3.2.4 Control Variables ...21
3.2.5 OLS Models ...21
3.2.6 Dataset Preparation ...23
3.2.7 Descriptive statistics of secondary data ...23
3.3 Quantitative Primary Research – A/B Testing...24
4.1 Econometric analysis of secondary campaign data ...25
4.2 Quantitative Primary Research – A/B Testing...29
5.1 Conclusions ...31
6 TABLE OF TABLES
TABLE 1 – RELEVANT METRICS FOR SOCIAL MEDIA APPLICATIONS. ADAPTED FROM
HOFFMAN, DONNA L., AND MAREK FODOR (2010) ...16
TABLE 2 – METRICS CHOSEN TO ANALYZE THE PERFORMANCE OF FACEBOOK ADVERTISING CAMPAIGNS. ADAPTED FROM FACEBOOK INSIGHTS AND ACQUISIO BLOG (2012) ...16
TABLE 3 – DESCRIPTIVE STATISTICS OBTAINED FROM THE SECONDARY DATASET (N=102) ...23
TABLE 4 – OLS REGRESSIONS FOR MODELS 1, 2 AND 3 (N=111) ...25
TABLE 5 – INDICATORS OF THE REGRESSIONS’ MODEL QUALITY ...25
TABLE 6 – DESCRIPTIVE STATISTICS OF A/B TESTING (N=11 DAYS) ...29
7 TABLE OF ANNEXES
ANNEX 1 – FREQUENCIES OF THE NUMBER OF POST COMMENTS (A), POST SHARES (B) AND POST LIKES (C) (N=102) ...36 ANNEX 2 – CORRECTION FOR SKEWED DISTRIBUTIONS OF THE DEPENDENT VARIABLES SOCIAL_REACH, SOCIAL_IMPRESSIONS, AND REACH (N=102) ...37 ANNEX 3 – BOX PLOTS OF VARIABLES REACH, POST_COMMENTS, POST_SHARES AND POST_LIKES ...38 ANNEX 4 – VERSIONS A, B AND C OF THE A/B TEST ...39
8 CHAPTER 1:
INTRODUCTION
1.1 Background
Social media has led to profound changes in the way people communicate and interact with each other (Wu, Sun and Tan, 2013) and also on how firms communicate with their customers (Rishika, Kumar, Janakiraman and Bezawada, 2013). As a matter of fact, Internet increased word-of-mouth (WOM), opening new ways for people to express and share with others their brand-related personal interests, opinions and experiences (Trusov, Bucklin and Pauwels, 2009).
Consumers who in traditional marketing played a passive role, assume now a very active and important role in content production, in what is best known as user-generated content (UGC) (Tirunillai and Tellis, 2012). This may take the form of comments, rates and reviews on websites, for instance, which in this way become part of the WOM concept. UGC has become one of the most important communication channels about brands, since, through it, peers can greatly influence other consumers in their purchase decisions.
Many researchers and scholars became interested in studying the WOM phenomenon and its impact on consumer behaviour during the last decades, either from the traditional marketing standpoint and more recently applied to social media. Research findings from Chevalier and Mayzlin (2006), Trusov, Bucklin and Pauwels (2009), and Stephen and Galak (2012), for instance, show that WOM has an influence on consumers’ purchasing behaviour and consequently on firm sales.
The role of each consumer in producing and diffusing content has been strengthened with the emergence and growth of social networks. In these social communities, social WOM has, compared with traditional WOM, an amplifier effect. This is also known as the megaphone effect because it allows consumers views to reach a much broader community (McQuarrie, Miller and Phillips, 2013). This megaphone effect is due in particular to the fact that social WOM is characterized not by a one-to-one oral communication but rather a one-to-many written communication (Eisingerich, Chun, Liu, Jia and Bell, 2014). Furthermore, such communication is public, with third-parties being exposed also to it, including other consumers.
Social network sites such as Facebook further enable the megaphone effect. Facebook users can engage and interact with a brand post, namely through comments, shares, or other user contributions, rapidly spreading the firm’s content through his or her network, also known as Facebook friends. This confers a viral reach to firm content (Gallaugher and Ransbotham, 2010).
9 1.2 Problem statement
Previous research on WOM has investigated its effects on brand performance, particularly on sales (Chevalier and Mayzlin, 2006, Trusov, Bucklin and Pauwels, 2009, and Stephen and Galak, 2012). More recently, Brettel and colleagues (2015) have analysed data collected from a top German e-commerce retailer to determine the relative impact of the four types of responses to Facebook ads – impressions, page views, likes and user contributions – have on short and long-term brand sales. However, hardly any studies have yet investigated the specific impact of different types of UGC (such as comments on posts and likes) on Facebook advertising performance, due to the megaphone effect. Thus, this reason motivated us to contribute to deepen the literature on this topic, which we believe to be at the same time in the best interests of business managers and, in particular, of marketers and digital marketing agencies. In fact, companies would benefit from decoding this new paradigm. By realizing how they can optimize Facebook marketing campaigns, firms would engage their followers to interact with the most effective type of content which ultimately leads to better advertising performance.
1.3 Aim
This dissertation aims to expand current knowledge on the impact of the megaphone effect of UGC – here driven by Facebook advertising campaigns -, on advertising performance. In this way, it is intended to better understand what are the most relevant and effective types of UGC for firms’ adverting performance, and which are the best practices companies can implement in order to optimize their Facebook communication and advertising campaigns.
In order to meet these objectives, this dissertation addresses the following research questions:
RQ1: What types of UGC, in response to a Facebook advertising campaign, generate a higher megaphone effect?
RQ2: What is the impact that each type of UGC, in response to a Facebook advertising campaign, has on its performance?
1.4 Scope
This dissertation focuses on the impact that UGC, in particular user comments on brand posts, post shares, post likes and page mentions reacting to a Facebook advertising campaign, has on the advertising performance of a Portuguese firm, whose identity cannot be disclosed for confidentiality reasons. This firm is a service-based B2C company which operates in the transportation industry in Portugal.
10 The choice of Facebook is due to the fact that it is the marketing channel most commonly used by the company. Through Facebook Ads, the company aims to raise brand awareness, and to encourage users to visit the firm’s landing page and ultimately subscribe their services. Also, we decided to analyse Facebook since it is the largest and most popular social network worldwide, with over 1,4 billion active users in August 2015 (Statistica, 2015).
Regarding the type of UGC addressed, we were first interested in studying the impact of brand post comments, as they are complex interactions whose effects on firm advertising performance are yet to be studied. Notwithstanding, given that Facebook Insights provides an easy source of information about other types of UGC, this research extended to post shares, post likes and page mentions. Other types of UGC, produced on Facebook or in other social networks, as well as in other digital marketing channels, may have a different impact on advertising performance, and were not considered for the purpose of this work.
This research was conducted in collaboration with VAN, an experienced Portuguese digital marketing agency that manages the SNS presence of several firms from different industries. The choice of VAN was due to the research collaboration that this digital marketing agency maintains with Católica-Lisbon. We considered that this collaboration was a unique opportunity for the intended research. Namely, it allowed the collection of detailed and reliable secondary field data. Most importantly, it enable us to test findings from secondary data analysis in a real Facebook advertising campaign, which confers greater robustness to our conclusions.
1.5 Research method
With the purpose of answering the research questions above mentioned, quantitative secondary data was collected from one VAN’s client, whose identity cannot be disclosed, for confidentiality reasons. A total of ten Facebook campaigns, corresponding to thirteen Facebook ads, was collected, since February to November 2015, in order to statistically conclude, through OLS regressions, which UGC is more impactful on firm’s advertising campaign performance.
Daily quantitative data regarding each type of UGC, namely brand post comments, post shares, post likes and page mentions, in response to the referred marketing activities, was collected in detail during the above-mentioned period. Moreover, we analysed and collected data on several content design features.
Furthermore, various relevant advertising performance metrics were then analysed, in order to understand the contribution of each UGC to advertising performance caused thanks to the megaphone effect previously explained.
11 In Chapter 2, we present the key performance metrics that were used to assess advertising performance and we explain in more detail all the data collected.
The collected field data was organized by type of UGC in order to be possible to conclude what is the individual impact on advertising performance of each user contribution in response to a Facebook advertising campaign.
Moreover, this dissertation also collected and analysed primary field data. In this sense, based on the collected data and results obtained from the secondary research, we found interest in conducting an experiment, where an A/B test approach was used. Three versions, each corresponding to a single ad, were shown to the company’s Facebook followers, where we manipulated a design variable, leaving all the remainder variables constant. The purpose of this experiment, which was also conducted by VAN, from December 10th till December 20th, 2015, was to test and corroborate our previous findings
and acquired knowledge, in order to better understand which best practices can and should be followed so that companies can optimize their Facebook advertising campaigns.
1.6 Relevance
In the age of social network sites, social WOM, which influences consumers’ purchasing behaviour and consequently firm sales, benefits from an amplifier or megaphone effect that allows consumers to communicate and spread their critical opinions to a much broader community (McQuarrie, Miller and Phillips, 2013).
Despite the invaluable previous findings from Brettel and colleagues (2015), the individual impact that different types of Facebook UGC, such as user comments on posts, have on firm advertising performance was not yet been investigated in-depth. Thus, the development of additional academic knowledge in this area of study will complement previous studies and research, and will also open new horizons and motivate further research.
On the other hand, understanding the impact that Facebook UGC has on advertising performance is, in our perspective, crucial for both marketers and digital marketing agencies, as it will allow a better Facebook advertising optimization. In this sense, firms will be able to adapt their Facebook marketing campaigns in order to engage users to interact with the brand in the most effective way, which ultimately will lead to best advertising effectiveness and performance.
Therefore, this dissertation aims to provide a relevant contribution to the academic and managerial knowledge on a subject that still needs to be deepened.
12 1.7 Dissertation outline
The remainder of this dissertation is followed by Chapter 2, where we provide a review of the most relevant literature related with our research topic and the conceptual framework used for this study. In Chapter 3, we present our methodology. In Chapter 4, we analyse the data collected and discuss the implications of our findings. Finally, in Chapter 5, we summarize our results and conclusions, as well as the limitations and opportunities for further research.
13 CHAPTER 2:
LITERATURE REVIEW AND CONCEPTUAL FRAMEWORK
Findings from relevant studies on the impact of Facebook UGC on firm’s advertising performance are here reviewed. First and foremost, we start by analysing the concept of e-WOM and UGC applied to social networks and their importance on consumer purchase decisions. Subsequently, we analyse how firms can implement advertising campaigns on Facebook. We then discuss the most relevant metrics firms can use to evaluate their marketing activities’ performance and, as our analysis was conducted in the Portuguese market, we will briefly address in specific the panorama of social networks in this country. Lastly, we formulate several statistical hypotheses which, once tested, are expected to help us answering our research questions.
2.1 e-WOM and UGC in Social Networks
Extant research has been focused on the importance of WOM over the past decades. There is a very wide consensus throughout the academic community regarding the important role of WOM in influencing consumers purchase decisions. For instance, Chevalier and Mayzlin (2006) considered online book reviews as a proxy for WOM, and their findings suggest that there is a positive impact of online user book reviews on firm’s relative sales.
Following the same line of reasoning, Bughin and colleagues (2010) concluded that WOM is responsible for 20 to 50 percent of all purchase decisions. According to these authors, the influence of WOM is expected to be much bigger with the increasing importance of social media, since there is an amplifier effect, also called the megaphone effect (McQuarrie, Miller and Phillips, 2013). This is due to the fact that social media enable consumers to communicate and diffuse information to a much broader community, leveraging in this way the power of social WOM.
Consequently, and contrary to what occurs in traditional media, managers have now less power to directly control the diffusion of their marketing communications, which depends on the users’ willingness to interact with the firms. Companies need, thus, more than ever, to influence their followers to engage with social WOM (Mangold and Faulds, 2009; Peters, et al., 2013).
In the particular case of social networks, namely Facebook, companies create brand communities and produce content to engage their followers, who consequently have at their disposal several ways to interact with a brand post. As a matter of fact, Facebook users can express their feelings, share their opinions as well as their consumption experiences with other users, mainly through post comments, shares and likes. These users’ interactions, also known as brand post popularity (De Vries, Gensler
14 and Leeflang, 2012) not only appear on firm’s Facebook page and on the content producer newsfeed, but will also be exposed on the newsfeed of some of their Facebook friends, based on their affinity score. Once created, Facebook UGC rapidly spreads through users’ followers (Brettel and colleagues, 2015). These contents may actually contribute to more effective advertising campaigns, since users, on behalf of the firm, act as a brand ambassadors and speak with their followers that share similar interests.
Unfortunately, little research has been conducted on the impact that UGC has on the megaphone effect and, thus, on Facebook advertising performance. The above mentioned authors suggest that these UGC contribute, in fact, for an increase on firm sales, especially in the long run, thanks to high carryover effects. Specifically, the authors came to the conclusion that Facebook likes are the most effective content towards firm’s long term sales. One of the reasons that can explain this finding is that likes are easily perceived and processed by other users than post comments.
But, although it remains unclear which UGC is the most relevant for firm’s advertising performance, previous scholars have shown how companies can engage users to interact with a particular type of UGC. For example, findings from De Vries, Gensler and Leeflang (2012) show that the usage of vivid and medium interactive brand post characteristics engage users to like the posts. For instance, the usage of images and videos, the announcement of events, as well as the usage of links to a website, call to actions, contests and competitions (interactivity), are expected to engage users to like the posts, and don’t have an impact on the number of comments. On the other hand, when companies use highly interactive brand post characteristics, such as posting questions to their audience, people tend to engage with the brand through comments, instead of liking the post.
Apart from the contribution of UGC to firm’s advertising performance, it should be noted that there are other factors that play an important role and which have been studied in recent years. For instance, Kirkpatrick (2012), suggests that the urgency, length of a message, images, and colours have an impact in e-mail marketing performance. Vaughan (2012), on the other hand, presents a set of content variables, such as the existence of calls-to-action, number of images, to name a few, which have an effect in driving traffic to a website. Thus, and although not much is known about what drives advertising success in social networks (Brettel and colleagues, 2015), one can conclude that content and design variables are crucial to the success of advertising campaigns, and that the findings, above-mentioned, can also be applied to social networks.
15 2.2 Facebook Ads
Firms are increasingly present and communicate with their customers on social networks. Facebook, the largest social network worldwide, is referred as a powerful social media channel for marketing activities (Lee, Hosanagar, and Nair, 2014), and a way for companies to easily reach a broader target audience.
One way for firms to reach their customers is through Facebook Ads, by which people can be segmented based on their demographic characteristics, including age and gender, based on their location, interests, to name a few. Regarding their pricing model, Facebook Ads functions like an auction, where companies are constantly competing against with each other for the same target users. Firms can define their daily budget, and set the bid they are available to pay in order to reach their audience (Facebook for business, 2015).
A major advantage for firms using Facebook as a marketing communication channel is the sophisticated algorithm of this social network, named EdgeRank. This algorithm is able to choose which users will see the firm’s ads, as well as other non-sponsored posts, on the top of their newsfeed, that is, which users will be exposed to brand posts. This decision depends on three main factors – the affinity score, the edge rank, and time decay (EdgeRank, 2015). In what concerns the first factor, which is strictly linked with the topic of this dissertation, Facebook will choose the users that have a high affinity level with the firm. In fact, Facebook knows that people who have previously interacted in some way with the brand are the ones that will probably be more interested with its content, and therefore will enhance the impact and cost-effectiveness of advertising campaigns (Facebook for business, 2015). Moreover, when a target user interacts with a certain brand post and shares its content with his friends, Facebook knows that probably the users that will engage more with that post are the ones that share similar interests and characteristics with the target user, and consequently have a higher affinity score with that person.
2.3 Metrics used to evaluate Facebook Advertising Performance
Several metrics can be used in order to evaluate and monitor the performance and success of an advertising campaign on Facebook. These metrics have the advantage of being relatively easy to decode, helping companies to better understand how their marketing activities are being perceived by their target audience, and to make, therefore, more proper and effective marketing decisions. In Table 1, presented below, we summarize some of the key statistic and metrics firms can use in order to evaluate their advertising performance.
16 Moreover, several other metrics can be useful when monitoring the performance of an advertising campaign, as shown in Table 2. These metrics were used for the purposes of our research, as they are useful to analyse the campaigns’ performance from the social point of view, that is, they comprise the megaphone effect caused by Facebook UGC.
Table 2 - Metrics chosen to analyse the performance of Facebook advertising campaigns (Adapted from Facebook Insights and Acquisio Blog (2012)
Metric Definition
Reach The number of users the brand post was shown to.
Social Reach The number of users the brand post was shown to with social information. That is, the number of users who saw the brand post, including their friends who liked the page or that have somehow have interacted with the brand post. This social information refers, in this sense, to people whose friends are brand followers and have endorsed the brand post.
Social Impressions The number times the brand post was viewed, with social information.
2.4 Social Networks in Portugal
Social networks have seen their popularity grow exponentially all over the world. As previously mentioned, Facebook is the largest social network worldwide, with over 1,4 billion active users in August 2015 (Statista, 2015). According to Esperança Afonso, project coordinator at Marktest Consulting, a business unit that belongs to a prestigious market research organization called Marktest,
Social Media Application Brand Awareness Brand Engagement Word of Mouth
Social Networks
(Facebook) Number of members/fansNumber of impressions
Number of comments Number of active users
Number of "likes" on friends' feeds Number of user-generated items (photos, threads, replies)
Impressions-to-interactions ratio
Frequency of appearances in timeline of friends
Number of posts on wall Number of reposts/shares Number of responses to friend referral invites Table 1 - Relevant metrics for social media applications. Adapted from Hoffman, Donna L., and Marek Fodor (2010)
17 this popularity also occurs in Portugal. As a matter of fact, the usage of social networks has grown about 51% in 2010, 33% in 2011 and 27% in 2012. A study published in 2015 by this organization (Marktest, G., 2015; Computer World, 2015), concluded that Facebook is the most used social network in Portugal, where 94% of social networking users owns a Facebook account. On the other hand, about 69% follows brands on social networks and 13% considers that following a brand or company on social networks has much influence on purchase decisions. These data is highly relevant for firms, since it reaffirms the importance and benefits for companies to be present on social communities and take advantage of this social media marketing channel.
2.5 Conclusions and Research Hypothesis
Previous research suggest a positive impact of WOM, and Social WOM in particular, on firm performance and ultimately on sales. However, few researchers have studied the impact of UGC on Facebook advertising performance, which gives us confidence to add fresh insights to existing knowledge.
Consistently with the research findings from Brettel and colleagues (2015), we expect to see a positive impact of Facebook UGC on firms’ advertising performance, particularly on the key metrics previously defined in Table 2.
Taking into account our two research questions formulated in chapter 1:
RQ1: What types of UGC, in response to a Facebook advertising campaign, generate a higher megaphone effect?, and
RQ2: What is the impact that each type of UGC, in response to a Facebook advertising campaign, has on firm performance?, we can now formulate the following research hypotheses, to be statistically tested:
H1: Brand post comments in response to a Facebook adverting campaign contributes to a growth in advertising performance, specifically in reach, social reach and social impressions.
H2: Brand post likes in response to a Facebook adverting campaign contributes to a growth in advertising performance, specifically in reach, social reach and social impressions.
H3: Brand post shares in response to a Facebook adverting campaign contributes to a growth in advertising performance, specifically in reach, social reach and social impressions.
H4: Brand page mentions in response to a Facebook adverting campaign contributes to a growth in advertising performance, specifically in reach, social reach and social impressions.
In the following chapter, it is presented the methodology for collecting both primary and secondary data in order to statistically test the hypothesis formulated above, which are expected to help us
18 answering the research questions of this dissertation. In Chapter 4, we present the findings of our analysis, and in Chapter 5 we end up our research by summarizing our results and presenting as well the limitations and suggestions for an agenda for further research.
19 CHAPTER 3:
METHODOLOGY
3.1 Research Approach and Methods
Our research follows a deductive approach, according to which it is intended to contribute to a deep understanding of previous literature findings and past contributions on the impact that UGC has on the performance of Facebook advertising campaigns.
Following the formulation of the research hypotheses in Chapter 2, we collected and analysed quantitative secondary data from past Facebook advertising campaigns, which was provided by VAN, a Portuguese digital marketing agency that is devoted, in particular, to manage their clients’ social networks, in case, Facebook brand pages.
With these data, and taking into consideration the research methods advocated by Saunders, Mark NK, et al. (2011), we undertook an explanatory research which aims to test relationships between variables under study, to thus statistically test the above mentioned research hypotheses, as well as to draw conclusions that allow us to obtain answers to the research questions formulated in Chapter 1.
After analysing the quantitative secondary data, we used the research results in a real Facebook advertising campaign with the purpose of testing the acquired knowledge. Thus, it is intended, in parallel to the collection of secondary data, to collect primary field data to corroborate the findings of our research.
3.2 Quantitative Secondary Research 3.2.1 Dataset and Sample
As stated in Chapter 1, the secondary dataset used for the purpose of this dissertation comes from several Facebook advertising campaigns conducted by VAN on behalf of a Portuguese company, henceforth referred to as ‘Company’, whose identity cannot be disclosed.
The brand posts were typically targeted at two distinct geographic locations, from now on referred to as ‘location A’ and ‘location B’. With respect to the demographic segmentation determined for the advertising campaigns, VAN typically targeted people with more than 18 years old (which is the Portuguese minimum legal age to drive the majority of the vehicles), up to 60 years old.
Regarding the content of each Facebook brand post, both message and images used were very consistent and similar with each other, with no material changes. In fact, VAN used images related to both location A and location B, and the colours used in the posts were consistent with the Company
20 branding colours. As for the post description, it typically contains a sense of urgency, where the Company tries to engage users to subscribe their services with limited promotional offers.
3.2.2 Dependent Variables
As stated in the preceding chapter, we are interested in studying the impact that UGC has on Facebook advertising performance. As such, we have selected three advertising performance metrics, which in our view best comprehend the megaphone effect of UGC in response to a particular ad. In this way, these metrics, in case, reach, social reach and social impressions, are expected to be influenced by Facebook UGC, and therefore constitute the dependent variables of our OLS model.
3.2.3 Independent Variables
As previously mentioned, VAN chosen to use a relatively similar content in all the brand posts during the period under analysis, in particular regarding the image, colours and the written content, both on the post image and on the post description. This makes our analysis more reliable, since significant changes in content can lead to very different results. Thus, it is not expected that our analysis will be skewed by content variations.
Nevertheless, VAN occasionally changed the content of the brand posts, in order to obtain better advertising performance results and to get more interaction from the target Facebook users. In fact, one of the most common changes conducted by VAN was the inclusion of a sense of urgency on the post description, offering special offers to users that bought the Company’s subscriptions until a certain limited period of time. This sense of urgency was sometimes also included on post images, highlighted in the upper right part.
Also, VAN decided to include on the post image the discount, in percentage, that users would benefit if they subscribe the Company’s services, and in other campaigns, VAN opted to include the discount price, in euros. These two subtle actions are expected to produce an effect on the performance of the advertising campaigns. Therefore, we have chosen to include in our analysis four dummy variables. In specific, we created variables which accounts for the presence or absence of the referred sense of urgency on post images (variable Image_text_urgency), the presence or absence of the referred discount, in percentage, on post images (variable Image_text_discount), the presence or absence of the discount price on post images (variable Image_text_price) and, finally, the presence or absence of the sense of urgency on post description (variable Post_description_urgency).
As VAN included written content in all post images, the dummy variable Image_text, originally considered by us, was for this reason excluded from the dataset.
21 Regarding the age of the target audience, in some brand posts VAN has targeted users aged from 20 to 55 years old, while in other campaigns users were aged from 20 to 60 years old. Since there are no significant demographic changes, we have not added a variable Age to our analysis.
With regard to the place of residence of the target Facebook users, VAN has targeted people located in two distinct locations, location A and location B. As such, an additional dummy variable was included in our model (variable Location_A).
3.2.4 Control Variables
For each of the selected Facebook advertising campaigns - since it was intended to study the effect that each type of Facebook UGC has in the performance of the campaigns -, we collected data on the number of post comments, post shares, post likes and page mentions. Given that these variables are not continuous, as it may be observed in Annex 1, which presents the frequencies of the number of post comments, post shares, and post likes, we have created one dummy variable of each type of Facebook UGC (Post_comments_high, Post_shares_high and Post_likes_high), which equals to one for values above the mean of each variable.
As it was not observed any secondary data concerning page mentions during the time period under analysis, this specific UGC was not considered for the purposes of our study. Hence, it was not possible to test H4, as stated in Chapter 2.
3.2.5 OLS Models
Before estimating our models, we plotted our dependent variables and concluded that they do not follow a normal distribution, but were rather right skewed. In order to correct for skewing, we used the square root of each of the dependent variables. The results are shown in Annex 2.
With these linear transformations in mind, we conducted an OLS regression on three OLS models, which can be expressed as follows:
Model (1): √𝑆𝑜𝑐𝑖𝑎𝑙_𝑟𝑒𝑎𝑐ℎ𝑗 = 𝛽1+ 𝛽2𝐼𝑚𝑎𝑔𝑒_𝑡𝑒𝑥𝑡_𝑢𝑟𝑔𝑒𝑛𝑐𝑦𝑗+ 𝛽3𝐼𝑚𝑎𝑔𝑒_𝑡𝑒𝑥𝑡_𝑑𝑖𝑠𝑐𝑜𝑢𝑛𝑡𝑗 +
𝛽4𝐼𝑚𝑎𝑔𝑒_𝑡𝑒𝑥𝑡_𝑝𝑟𝑖𝑐𝑒𝑗+ 𝛽5𝑃𝑜𝑠𝑡_𝑑𝑒𝑠𝑐𝑟𝑖𝑝𝑡𝑖𝑜𝑛_𝑢𝑟𝑔𝑒𝑛𝑐𝑦𝑗+ 𝛽6𝐿𝑜𝑐𝑎𝑡𝑖𝑜𝑛_𝐴𝑗+ 𝛽7𝑃𝑜𝑠𝑡_𝑐𝑜𝑚𝑚𝑒𝑛𝑡𝑠_ℎ𝑖𝑔ℎ𝑗+ 𝛽8𝑃𝑜𝑠𝑡_𝑠ℎ𝑎𝑟𝑒𝑠_ℎ𝑖𝑔ℎ𝑗+ 𝛽9𝑃𝑜𝑠𝑡_𝑙𝑖𝑘𝑒𝑠_ℎ𝑖𝑔ℎ𝑗+ 𝜀𝑖𝑗
22 Model (2): √𝑆𝑜𝑐𝑖𝑎𝑙_𝑖𝑚𝑝𝑟𝑒𝑠𝑠𝑖𝑜𝑛𝑠𝑗 = 𝛽1+ 𝛽2𝐼𝑚𝑎𝑔𝑒_𝑡𝑒𝑥𝑡_𝑢𝑟𝑔𝑒𝑛𝑐𝑦𝑗+ 𝛽3𝐼𝑚𝑎𝑔𝑒_𝑡𝑒𝑥𝑡_𝑑𝑖𝑠𝑐𝑜𝑢𝑛𝑡𝑗 + 𝛽4𝐼𝑚𝑎𝑔𝑒_𝑡𝑒𝑥𝑡_𝑝𝑟𝑖𝑐𝑒𝑗+ 𝛽5𝑃𝑜𝑠𝑡_𝑑𝑒𝑠𝑐𝑟𝑖𝑝𝑡𝑖𝑜𝑛_𝑢𝑟𝑔𝑒𝑛𝑐𝑦𝑗+ 𝛽6𝐿𝑜𝑐𝑎𝑡𝑖𝑜𝑛_𝐴𝑗 + 𝛽7𝑃𝑜𝑠𝑡_𝑐𝑜𝑚𝑚𝑒𝑛𝑡𝑠_ℎ𝑖𝑔ℎ𝑗+ 𝛽8𝑃𝑜𝑠𝑡_𝑠ℎ𝑎𝑟𝑒𝑠_ℎ𝑖𝑔ℎ𝑗+ 𝛽9𝑃𝑜𝑠𝑡_𝑙𝑖𝑘𝑒𝑠_ℎ𝑖𝑔ℎ𝑗+ 𝜀𝑖𝑗 Model (1): √𝑅𝑒𝑎𝑐ℎ𝑗 = 𝛽1+ 𝛽2𝐼𝑚𝑎𝑔𝑒_𝑡𝑒𝑥𝑡_𝑢𝑟𝑔𝑒𝑛𝑐𝑦𝑗+ 𝛽3𝐼𝑚𝑎𝑔𝑒_𝑡𝑒𝑥𝑡_𝑑𝑖𝑠𝑐𝑜𝑢𝑛𝑡𝑗 + 𝛽4𝐼𝑚𝑎𝑔𝑒_𝑡𝑒𝑥𝑡_𝑝𝑟𝑖𝑐𝑒𝑗+ 𝛽5𝑃𝑜𝑠𝑡_𝑑𝑒𝑠𝑐𝑟𝑖𝑝𝑡𝑖𝑜𝑛_𝑢𝑟𝑔𝑒𝑛𝑐𝑦𝑗+ 𝛽6𝐿𝑜𝑐𝑎𝑡𝑖𝑜𝑛_𝐴𝑗+ 𝛽7𝑃𝑜𝑠𝑡_𝑐𝑜𝑚𝑚𝑒𝑛𝑡𝑠_ℎ𝑖𝑔ℎ𝑗+ 𝛽8𝑃𝑜𝑠𝑡_𝑠ℎ𝑎𝑟𝑒𝑠_ℎ𝑖𝑔ℎ𝑗+ 𝛽9𝑃𝑜𝑠𝑡_𝑙𝑖𝑘𝑒𝑠_ℎ𝑖𝑔ℎ𝑗+ 𝜀𝑖𝑗 where
𝑆𝑜𝑐𝑖𝑎𝑙_𝑟𝑒𝑎𝑐ℎ𝑗 The amount of social reach per brand post j,
𝑆𝑜𝑐𝑖𝑎𝑙_𝑖𝑚𝑝𝑟𝑒𝑠𝑠𝑖𝑜𝑛𝑠𝑗 The amount of social impressions per brand post j,
𝑅𝑒𝑎𝑐ℎ𝑗 The amount of reach per brand post j,
𝐼𝑚𝑎𝑔𝑒_𝑡𝑒𝑥𝑡_𝑢𝑟𝑔𝑒𝑛𝑐𝑦𝑗 Dummy variable if the text written on the image post has a sense of
urgency,
𝐼𝑚𝑎𝑔𝑒_𝑡𝑒𝑥𝑡_𝑑𝑖𝑠𝑐𝑜𝑢𝑛𝑡𝑗 Dummy variable if the text written on the image post contains a
discount percentage,
𝐼𝑚𝑎𝑔𝑒_𝑡𝑒𝑥𝑡_𝑝𝑟𝑖𝑐𝑒𝑗 Dummy variable if the text written on the image post contains a
discount price,
𝑃𝑜𝑠𝑡_𝑑𝑒𝑠𝑐𝑟𝑖𝑝𝑡𝑖𝑜𝑛_𝑢𝑟𝑔𝑒𝑛𝑐𝑦𝑗 Dummy variable if the text written on the post description has a sense
of urgency,
𝐿𝑜𝑐𝑎𝑡𝑖𝑜𝑛_𝐴𝑗 Dummy variable if the target audience is located near location A,
𝑃𝑜𝑠𝑡_𝑐𝑜𝑚𝑚𝑒𝑛𝑡𝑠_ℎ𝑖𝑔ℎ𝑗 Dummy variable if the number of post comments on brand post j, is
higher than the mean of total post comments,
𝑃𝑜𝑠𝑡_𝑠ℎ𝑎𝑟𝑒𝑠_ℎ𝑖𝑔ℎ𝑗 Dummy variable if the number of post shares on brand post j, is
higher than the mean of total post shares,
𝑃𝑜𝑠𝑡_𝑙𝑖𝑘𝑒𝑠_ℎ𝑖𝑔ℎ𝑗 Dummy variable if the number of post likes on brand post j, is higher
than the mean of total post likes,
𝜀𝑖𝑗 Error term for dependent variables 𝑆𝑜𝑐𝑖𝑎𝑙_𝑟𝑒𝑎𝑐ℎ𝑗,
𝑆𝑜𝑐𝑖𝑎𝑙_𝑖𝑚𝑝𝑟𝑒𝑠𝑠𝑖𝑜𝑛𝑠𝑗, 𝑅𝑒𝑎𝑐ℎ𝑗.
All the models were corrected for heteroscedasticity, in order to prevent that the variance of the estimators are biased, which could lead to wrong conclusions when testing our research hypotheses.
23 3.2.6 Dataset Preparation
We have collected and empirically analysed 10 past Facebook advertising campaigns from February 12th 2015 till November 24th 2015 which were organized in a panel data. A total of 111 observations
(the cumulative number of days each ad was shown) was collected, with an aggregate reach of about 1,9 million users.
We first found that our dataset had missing data, which would have to be addressed prior to the statistical test of our hypotheses and OLS regressions. These missing data referred to campaigns that on a given day, at least one type of Facebook UGC was not collected. However, we are dealing with days where the observation of a particular UGC was zero, and not with real missing observations. Therefore, we replaced this data by the value of zero.
On the other hand, our preliminary analysis suggested the existence of outliers, that is, observations which are too distant from the other values and thus may distort our results. Hence, these outliers, whose existence was confirmed by the box plots presented in Annex 3, were removed from our dataset, reducing our total observations to 102.
3.2.7 Descriptive statistics of secondary data
The following table shows the descriptive analysis of the collected dataset.
Table 3: Descriptive statistics obtained from the secondary dataset (N=102)
Variables Min Max. Mean Std. Dev.
Image_text_urgency Independent Variables 0 1 0.196 0.399 Image_text_discount 0 1 0.069 0.254 Image_text_price 0 1 0.755 0.432 Post_description_urgency 0 1 0.353 0.480 Location_A 0 1 0.804 0.399 Post_comments_high Control Variables 0 1 0.343 0.477 Post_shares_high 0 1 0.451 0.500 Post_likes_high 0 1 0.412 0.495 Reach Dependent Variables 11 38,353 15,701.620 9,925.797 Social_reach 2 2,285 772.608 642.582 Social_impressions 2 2,285 794.912 657.654
24 3.3 Quantitative Primary Research – A/B Testing
Having analysed the quantitative secondary research, the results of which are discussed in the following chapters, our research proceeded with the implementation of a Facebook advertising campaign for the same company. To this end, an A/B test approach was used, according to which three versions, or posts, of the same campaign were showed to the Company’s Facebook followers (see Annex 4). In each of the three post images, a design variable on the image post was manipulated (variable Image_text_price for Version A, and variable Image_text_discount for Version B), while the remainder variables were controlled, namely in what concerns with the age of the target audience, location and post description.
As such, the following manipulations were conducted:
Version A: Insert a written content on the image post, containing a discount price Version B: Insert a written content on the image post, containing a discount percentage. Both versions mentioned above were then compared with a third Facebook ad, which was very similar than the previous ones, except that the image post was free of any written content:
Version C: Remove any written content on the image post.
The objective of this experiment was to conclude to what extent these two ad design variables contribute to an increase in Facebook advertising performance metrics (social reach, social impressions and reach), and compare the results with the ones obtained in our quantitative secondary research.
To this end, we conducted the Kruskal-Wallis test, a non-parametric procedure in order to assess if the means of the performance metrics are significantly different in each ad version.
We expect to achieve different performance outcomes in each post version, and hence corroborate the results obtained in the secondary data analysis.
The referred Facebook advertising campaigns, as in the past, were conducted by VAN for a time period of 11 days, from December 10th till December 20th, 2015. A cumulative reach of 176,595 users was
obtained.
In Chapter 4, we present the results of quantitative secondary research, which will be used to optimize a real Facebook advertising campaign. In Chapter 5 we summarize our conclusions and findings from both secondary and primary research, as well as the limitations and suggestions for an agenda for further research.
25 CHAPTER 4:
RESULTS AND DISCUSSION
4.1 Econometric analysis of secondary campaign data
After formulating the econometric models in the previous chapter, we conducted three linear regressions, whose findings are presented in Table 4.
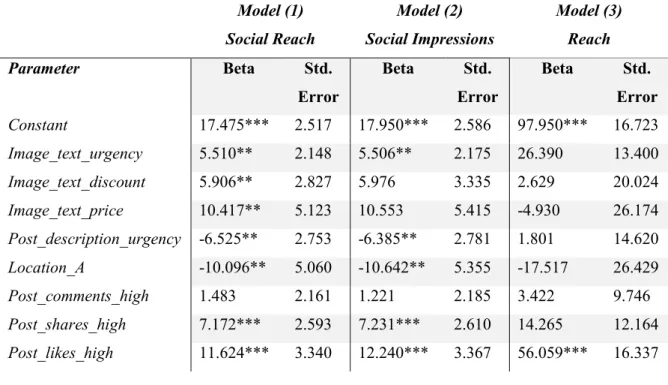
Table 4: OLS Regressions for Models 1, 2 and 3 (N=111)
Model (1) Social Reach Model (2) Social Impressions Model (3) Reach Parameter Beta Std. Error Beta Std. Error Beta Std. Error Constant 17.475*** 2.517 17.950*** 2.586 97.950*** 16.723 Image_text_urgency 5.510** 2.148 5.506** 2.175 26.390 13.400 Image_text_discount 5.906** 2.827 5.976 3.335 2.629 20.024 Image_text_price 10.417** 5.123 10.553 5.415 -4.930 26.174 Post_description_urgency -6.525** 2.753 -6.385** 2.781 1.801 14.620 Location_A -10.096** 5.060 -10.642** 5.355 -17.517 26.429 Post_comments_high 1.483 2.161 1.221 2.185 3.422 9.746 Post_shares_high 7.172*** 2.593 7.231*** 2.610 14.265 12.164 Post_likes_high 11.624*** 3.340 12.240*** 3.367 56.059*** 16.337 *p<0.1; **p<0.05; ***p<0.01
Table 5: Indicators of the regressions’ model quality
Model 𝑅2 Adjusted 𝑅2 Residual Std.
Error
F Statistic
1 – Social Reach 0.687 0.660 7.200 25.467***
2 – Social Impressions 0.688 0.661 7.255 25.664***
26 It is noteworthy, first of all, that our OLS models 1 and 2 achieved a 𝑅2 higher than 68%, which gives
us confidence to believe that the variables chosen give a good explanation for social reach and social impressions behaviour. This is not surprising, since these performance metrics are closely linked to UGC. On the other hand, the 𝑅2 falls to about 44% in model 3. In our understanding, this decrease
was expected to happen, since reach is a much wider metric, being influenced by a broader universe of factors. Notwithstanding, this model still provides a satisfactory explanation for reach.
In order to interpret the Betas of our models, and assess the impact that an additional unit increase of an independent variable has on the dependent variable, it should be computed the formula 𝛽𝑒𝑡𝑎2, since
our models considered the square root of the dependent variables, as previously explained. 4.1 Effect of brand post comments on reach, social reach and social impressions
We hypothesized that brand post comments in response to a Facebook advertising campaign contributes to a growth in advertising performance (H1).
According to Table 4, post comments don’t have a statistically significant impact on Facebook advertising performance, at a confidence interval of 95%. For this reason, it was not possible to reject that the null hypothesis, that is, H1, is incorrect. Notwithstanding, we obtained positive betas, which suggest that the effect would be positive, as expected.
The results obtained are interesting, since we expected to find strong statistical evidence on the impact that this type of UGC has on advertising performance. In fact, Facebook comments are complex interactions and require a higher degree of involvement, since users need to put a bigger effort and spend more time to produce a comment, when compared with a post like or share.
4.2 Effect of brand post likes on reach, social reach and social impressions
We hypothesized that brand post likes in response to a Facebook advertising campaign contributes to a growth in advertising performance (H2).
Our findings from Table 4 suggest that not only users’ post likes on Facebook ads have a statistically significant positive impact on Facebook advertising performance, with a p-value under 0.05, but they are the most impactful type of UGC on advertising performance, which supports H2.
Also, results suggest that the existence of many users’ post likes (above the average) contribute, on average, to an increase in social reach of approximately 135 users, when compared with few post likes (below the average). On the other hand, it contributes, on average, to an increase of about 150 social impressions. Finally, findings show that the existence of many post likes causes, on average, an increase of about 3,143 in terms of reach.
27 4.3 Effect of brand post shares on reach, social reach and social impressions
We hypothesized that brand post shares in response to a Facebook advertising campaign contributes to a growth in advertising performance (H3).
The results from our analysis presented in Table 4 show that brand post shares have a statistically significant impact on Facebook advertising performance, with a p-value under 0.05., which supports H3. Specifically, our findings suggest that the existence of many Facebook post shares contribute, on average, to an increase in both social reach and social impressions metrics, in approximately 51 and 52, respectively, when compared with the existence of few post shares.
However, it should be mentioned that our regression failed to prove a statistical significant impact of post shares on the performance metric reach. Once again, given that reach is a much more comprehensive performance metric, and thus influenced by a larger universe of factors, this result is not surprising.
The results obtained from our analysis supports the importance of UGC in increasing several advertising performance metrics, even if some UGC, specifically, post comments and page mentions have not proven to have a statistically significant impact on Facebook advertising performance. As previously mentioned, our findings reveal that post likes and post shares are the most relevant UGC for Facebook advertising performance, in specific, for social reach and social impressions, which are metrics that comprise the megaphone effect generated by the target audience.
These results complement previous findings from Brettel and colleagues (2015). According to these authors, Facebook user contributions, herein referred to as UGC, in response to a brand post or ad, amplify companies’ communication in this social network, which contributes to a greater advertising efficiency and eventually to additional sales, especially in the long run. However, the authors of this research did not include in their analysis the individual impact that each UGC has in Facebook advertising performance, nor have discussed whether there are certain types of UGC that appear to be not statistically relevant to this performance, as it is suggested by our research.
4.4 Effect of control variables on reach, social reach and social impressions Image_text_urgency
On the other hand, our research suggests that there are other important factors that contribute to Facebook advertising performance, in particular, the use of images with written content with a sense of urgency. As we can observe from Table 4, the independent dummy variable Image_text_urgency is statistically significant, with a p-value under 0.05, which allows us to conclude that the existence of the type of written content in post images contributes, on average, to an increase in about 30.36 and
28 30.32, in social reach and social impressions, respectively. However, we came to the conclusion that this variable is not statistically significant enough, meaning that we have poor statistical evidence, to support a positive impact of the variable Image_text_urgency on reach.
Post_description_urgency
Additionally, from Table 4 we can also conclude that the existence of a sense of urgency in the post description, given by the dummy variable Post_description_urgency, has a statistically significant negative impact on social reach and social impressions, with a p-value under 0.05. As a matter of fact, results shown that using a sense of urgency in the post description contributes, on average, to a drop in about 42.58 and 40.77, in social reach and social impressions, respectively. These results are interesting, since our intuition would be that the impact of this type of content had a positive effect on Facebook advertising performance. In what respects the performance metric reach, we have no statistical evidence to extent this conclusion.
Image_text_discount
Also, we found that the dummy variable Image_text_discount is statistically significant to explain the behavior of social reach, with a p-value under 0.05. According to our results, the usage of a written content on the image post, containing a discount percentage, contributes, on average, to an increase in about 34.88 in social reach, while its impact in other advertising performance metrics was not statistically demonstrated.
Image_text_price
On the other hand, we found that the dummy variable Image_text_price is statistically significant to explain the behavior of social reach, with a p-value under 0.05. In this sense, we conclude that the usage of a written content on the image post, containing a discount price, contributes, on average, to an increase in about 108.51 in social reach, while we have no statistical evidence to extent this conclusion to the performance metrics social impressions and reach.
Location_A
Regarding the dummy variable Location_A, our results suggest that when the target audience is located near location A, instead of being located near location B, it contributes, on average, to a decrease in about 101.93 and 113.25 in social reach and social impressions, respectively. Regarding the performance metric reach, we don’t have enough statistical evidence to draw any similar conclusion. The results obtained from the estimation of this dummy variable makes no sense, since it is not plausible that the megaphone effect provoked by Facebook UGC has negative effects on advertising performance if the target audience lives near one specific location.
29 4.2 Quantitative Primary Research – A/B Testing
Table 6, below presented, provide the descriptive statistics obtained from the primary dataset. Table 6: Descriptive statistics of A/B testing (N=11 days)
Version A Version B Version C
Mean Standard Deviation Mean Standard Deviation Mean Standard Deviation Social Reach 351.182 135.809 124.273 66.364 212.091 96.593 Social Impressions 359.818 143.925 130.000 69.226 212.818 96.907 Reach 5,852.818 1,820.115 4,982.909 989.016 5,218.364 2,310.792 Post Comments 1.000 1.183 0.364 0.924 0.455 0.820 Post Shares 1.000 0.775 0.636 0.674 1.000 1.000 Post Likes 3.364 2.580 1.000 0.775 3.273 1.849
As we can observe in Table 6, it seems that writing a discount price on a post image leads to better advertising performance on Facebook, in specific in what concerns the performance metrics social reach, social impressions and reach, when compared with the scenario of not having any written content on the post image (version C). On the other hand, our descriptive statistics suggest that showing the discount percentage on the post image (version B) leads to worse advertising performance.
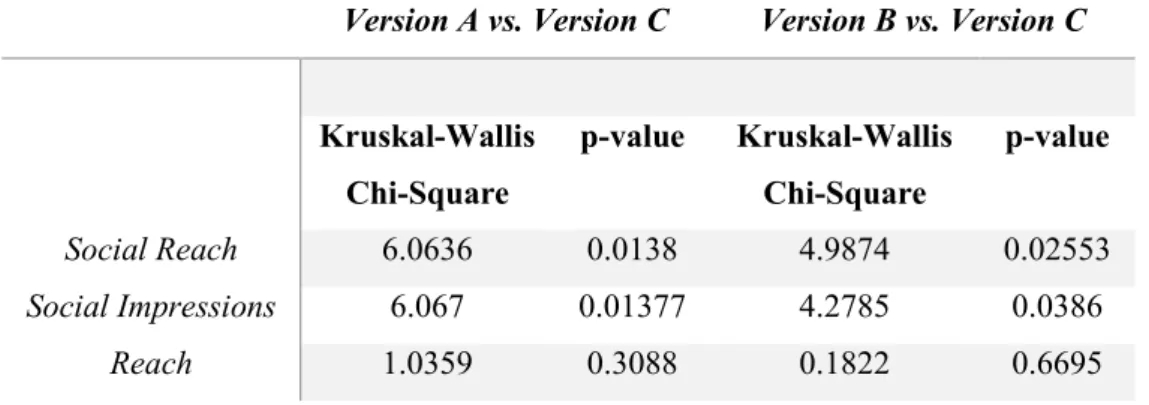
As previously referred, we have conducted a Kruskal-Wallis non-parametric procedure in order to test if the means of the performance metrics under study are statistically different. Results are presented below in Table 7.
Table 7: Kruskal-Wallis test
Version A vs. Version C Version B vs. Version C
Kruskal-Wallis Chi-Square p-value Kruskal-Wallis Chi-Square p-value Social Reach 6.0636 0.0138 4.9874 0.02553 Social Impressions 6.067 0.01377 4.2785 0.0386 Reach 1.0359 0.3088 0.1822 0.6695
30 As it can be concluded from Table 7, both performance metrics social reach and social impressions show differences amongst the means for all campaigns, as we obtained a p-value under 0.05, which confers statistical significance. However, we cannot extend the same conclusion to the performance metric reach, since the p-value obtained is greater than 0.05, hence for this metric the campaigns are not statistically different. This results support our previous finding that writing a discount price on a post image leads to better advertising performance.
Also, given that we obtained statistically significant differences in the performance metrics social reach and social impressions, but not in reach, we can conclude that the megaphone effect is a reality, contributing to Facebook advertising performance.
31 CHAPTER 5:
CONCLUSIONS AND LIMITATIONS
5.1 Conclusions
As opposed to traditional marketing, consumers play a much more active role in social media, in producing content (herein referred to as user-generated content – UGC), through comments, rates and reviews on websites, for instance. The diffusion of these personal interests, opinions and experiences to other consumers through social media, also known as social WOM, has been suggested in previous studies to influence other consumers’ purchase decisions and hence being an important communication channel for firms.
With the emergence of social networks, such as Facebook, firms benefit from a megaphone effect, since UGC, which may take the form of post comments, post shares, post likes and page mentions, can be easily spread to a much broader community. In fact, when Facebook users interact with a certain brand Facebook post or advertising, theirs followers (Facebook friends) will most likely be exposed to those interactions, and consequently to firms’ posts.
For this reason, past researchers have studied the impact that Facebook UGC has on firms’ performance, specifically on sales. However, it is yet to be studied the individual impact that each type of Facebook UGC has on advertising performance. Thus, we believe that it would be of great interest for both academic and managerial communities to better understand this phenomenon and which best practices can be undertaken in order to enhance the megaphone effect above-mentioned.
We consider that our results contribute significantly to a deeper understanding of what drives Facebook advertising performance, benefiting both literature with new insights on this topic and, on the other hand, marketers, who are now more apt to engage users to interact with the brand in the most effective way, which ultimately will lead to best advertising effectiveness and performance.
With the collaboration of VAN, a Portuguese digital marketing agency, it was collected quantitative secondary data from 10 past Facebook advertising campaigns, conducted between February and November, 2015. It was demonstrated with sufficient statistical evidence the positive impact of post likes and post shares in increasing the performance of Facebook advertising campaigns, herein represented in three metrics – social reach, social impressions and reach – which in our understanding best comprehend the megaphone effect. As such, marketers should design their advertising campaigns with the objective of collecting these two types of UGC, as they contribute significantly for the brand’s post diffusion. To do so, marketers should use for instance more images, videos and call to actions in order to engage users to like the brand posts, according to De Vries, Gensler and Leeflang (2012),
32 instead of asking questions to the brand’s audience, which were found by these authors to produce a negative impact in the number of Facebook likes. On the other hand, marketers should always try to engage users to share their advertising posts. The creation of contest could be a way to accomplish this objective.
Despite not being possible to find statistical evidence that allow us to support that post comments and page mentions produce a similar effect, our findings are in line with previous research, and highlight the importance of social WOM for companies’ advertising performance.
On the other hand, our research also allow us to suggest several content design optimizations that contribute to advertising performance. In particular, we conclude that the inclusion of a sense of urgency in the post image, encouraging users to make a purchase in a limited time frame, contributes to an increase in advertising performance, in specific on social reach and social impressions metrics. Moreover, the existence of such messages, when placed not on the image post, but rather in the post description, has an opposite effect, leading to a decrease of such performance metrics.
Additionally, findings from our research also suggest that the inclusion of a discount price or a discount percentage on Facebook post images contribute to an increase in social reach.
Finally, we have conducted two A/B tests, with the aim of strengthening previous findings from the quantitative secondary research, in specific the two latter conclusions above-mentioned, that is, the effect of the inclusion of a discount price or a discount percentage on post images on Facebook advertising performance.
The quantitative primary data analysis complements our conclusions, by suggesting that the inclusion of a discount price on the post image contributes to an increase in the performance metric social reach and social impressions.
5.2 Limitations and Future Research
Our research was intended to study to what extent Facebook UGC, in specific, post comments, post shares, post likes and page mentions, in response to an advertising campaign conducted in this social network, can amplify firms’ marketing content to other users who were not directly target by companies and, consequently, its contribution to advertising performance.
For the purposes of our research, it was selected a Portuguese service-based B2C company which operates in the transportation industry in Portugal. Therefore, it is relevant to state that, although it is not expected significant differences in the behaviour of Portuguese Facebook users with the behaviour of users from other countries, such differences may exist and lead to different results. Also, it would
33 be interesting for future research to replicate the same analysis to other industries, in order to see to what extend our conclusions remain the same.
On the other hand, it was not collected any data regarding page mentions. When users mention a friend in response to a brand post, they are directly engaging their followers to interact with the company’s message. For this reason, our intuition leads us to believe that this type of UGC has a positive effect on Facebook advertising performance. It would be of great interest to study this effect in future research.
Finally, it should be referred that our analysis focused on Facebook, the most popular social network worldwide. Nevertheless, it would be interesting to extend our research to other social networks, such as Instagram and Twitter, whose popularity is also significant in several countries. Compared with Facebook, these social networks are typically used differently by companies and, on the other hand, users have different possibilities to engage and produce content. Thus future research should also complement our findings and compare them with the impact that UGC on different social networks has on firms’ advertising performance.
34 REFERENCES
Acquisio Blog. (2012). Reach, Social Reach, Frequency and Connections in Facebook Advertising. Available: http://acquisio.com/blog/digital-marketing-beginners/reach-social-reach-frequency-and-connections-facebook-advertising/.
Brettel, M., Reich, J. C., Gavilanes, J. M., & Flatten, T. C. (2015). What Drives Advertising Success on Facebook? An Advertising-Effectiveness Model. Journal of Advertising Research, 55(2), 162-175.
Bughin, J., Doogan, J., & Vetvik, O. J. (2010). A new way to measure word-of-mouth marketing. McKinsey Quarterly, 2, 113-116.
Chevalier, J. A., & Mayzlin, D. (2006). The effect of word of mouth on sales: Online book reviews. Journal of marketing research, 43(3), 345-354.
Computer World. (2015). Redes sociais cada vez mais relevantes. Available: http://www.computerworld.com.pt/2015/09/17/redes-sociais-cada-vez-mais-relevantes/.
De Vries, L., Gensler, S., & Leeflang, P. S. (2012). Popularity of brand posts on brand fan pages: an investigation of the effects of social media marketing. Journal of Interactive Marketing, 26(2), 83-91.
EdgeRank. (2015). Available: http://edgerank.net/.
Eisingerich, A. B., Chun, H. H., Liu, Y., Jia, H. M., & Bell, S. J. (2015). Why recommend a brand face-to-face but not on Facebook? How word-of-mouth on online social sites differs from traditional word-of-mouth. J Consum Psychol, 25, 120-128.
Facebook for business. (2015). Available: https://www.facebook.com/business/.
Gallaugher, J., & Ransbotham, S. (2010). Social media and customer dialog management at Starbucks. MIS Quarterly Executive, 9(4), 197-212.
Hoffman, D. L., & Fodor, M. (2010). Can you measure the ROI of your social media marketing. MIT Sloan Management Review, 52(1), 41-49.
Kirkpatrick, D. (2012). Email Marketing: Factors that influence open rate. MarketingSherpa Blog. Lee, D., Hosanagar, K., & Nair, H. (2014). The effect of social media marketing content on consumer
engagement: Evidence from facebook. Available at SSRN 2290802.
Mangold, W. G., & Faulds, D. J. (2009). Social media: The new hybrid element of the promotion mix. Business horizons, 52(4), 357-365.
35 McQuarrie, E. F., Miller, J., & Phillips, B. J. (2013). The megaphone effect: Taste and audience in
fashion blogging. Journal of Consumer Research, 40(1), 136-158.
Peters, K., Chen, Y., Kaplan, A. M., Ognibeni, B., & Pauwels, K. (2013). Social media metrics—A framework and guidelines for managing social media. Journal of Interactive Marketing, 27(4), 281-298.
Rishika, R., Kumar, A., Janakiraman, R., & Bezawada, R. (2013). The effect of customers' social media participation on customer visit frequency and profitability: an empirical investigation. Information systems research, 24(1), 108-127.
Saunders, M. N., Saunders, M., Lewis, P., & Thornhill, A. (2011). Research methods for business students, 5/e. Pearson Education India.
Statista. (2015). Leading social networks worldwide as of November 2015, ranked by number of active users (in millions). Available: http://www.statista.com/statistics/272014/global-social-networks-ranked-by-number-of-users/.
Stephen, A. T., & Galak, J. (2012). The effects of traditional and social earned media on sales: A study of a microlending marketplace. Journal of Marketing Research, 49(5), 624-639.
Tirunillai, S., & Tellis, G. J. (2012). Does chatter really matter? Dynamics of user-generated content and stock performance. Marketing Science, 31(2), 198-215.
Trusov, M., Bucklin, R. E., & Pauwels, K. (2009). Effects of word-of-mouth versus traditional marketing: findings from an internet social networking site. Journal of marketing, 73(5), 90-102. Vaughan, P. (2012). An introduction to Inbound Marketing Analytics, Hubspot.
Wu, J., Sun, H., & Tan, Y. (2013). Social media research: A review. Journal of Systems Science and Systems Engineering, 22(3), 257-282.
36 ANNEX 1 – Frequencies of the number of post comments (a), post shares (b) and post likes (c) (N=102)
37 ANNEX 2 – Correction for skewed distributions of the dependent variables Social_reach, Social_impressions, and Reach (N=102)
38 ANNEX 3 – Box plots of variables Reach, Post_comments, Post_shares and Post_likes
39 ANNEX 4 – Versions A, B and C of the A/B Test
Version A
Version B