Development of an advanced
partition
model
dosimetry
system
for
hepatic
radioembolization using
90
Y-microspheres
Vera Catarina Marques Antunes
Mestrado em Física Médica
Departamento Física e Astronomia 2017Orientador
João António Miranda dos Santos, PhD
Assessor de Saúde (Física Médica) no Instituto Português de Oncologia Francisco Gentil, EPE;
Todas as correcções determinadas pelo júri, e só essas, foram efectuadas. O Presidente do Júri,
Acknowledgements
Foremost, I would like to express my deepest gratitude to my supervisor, Professor João Santos, for his expert advice and encouragement throughout this thesis.
I thank profusely all Service of Nuclear Medicine, especially to Dr. Hugo Duarte, director of the Service, for their kind help and co-operation throughout my study period. To my boyfriend and to all friends who in one way or another shared their support, either morally and physically. Thank you.
Finally and most importantly, I would like to thank my parents for allowing me the opportunity to realize my dreams, for their love and unconditional support throughout my years of study. My love for them is beyond words. Thank you.
Abstract
According to 2013/59/Euratom BSS, for all medical exposure of patients for radiotherapeutic purposes, including Nuclear Medicine, doses in target volumes shall be individually planned. Furthermore, doses to non-target volumes (e.g. organs-at-risk) shall be as-low-as-reasonably-achievable and consistent with the intended radiotherapeutic purposes. For 90Y-microspheres radioembolization, four methods of activity calculation to be administered are usually used. For resin microspheres are presented three: empirical, body-surface-area (BSA) and partition methods. For glass microspheres application, only an activity calculation method is available.
The 99mTc-MAA is primarily used for LSF analysis and evaluation of extrahepatic deposition, with the aim to predict intrahepatic post-therapy 90Y-microspheres distribution. Usually performed by planar and SPECT/CT imaging. In addition, treatment efficacy of radioembolization is assessed by the 90Y Bremsstrahlung SPECT imaging. However, Bremsstrahlung SPECT imaging demonstrates a poor image quality.
A total of sixty two patients were evaluated for radioembolization after the 99mTc-MAA procedure and were treated with resin microspheres using the BSA method for activity calculation. A retrospective evaluation indicates that more than 35% of the treated patients have hepatocellular carcinoma. This analysis also indicates that a large number of patients did not present a significant LSF (approximately 80%), and the average of resin microspheres activity was about 1.70 ± 0.42 GBq. However, the three cases analyzed show the limitation of the currently used BSA activity calculation method compared with a partition method.
In conclusion, caution regarding patient selection, treatment preparation including an appropriate dosimetry, and performance is particularly important to prevent toxicity to be associated with this treatment. Thus, the shift towards personalized radionuclide therapy should be the way forward.
Keywords: Radioembolization; 90Y; Internal dosimetry; Nuclear Medicine; Radiotherapy
Resumo
De acordo com a diretiva 2013/59/Euratom, para todas as exposições médicas de pacientes com fins radioterapêuticos, incluindo a Medicina Nuclear, as doses em volumes alvo devem ser planeadas individualmente. Além disso, as doses para volumes não visados (por exemplo, órgãos de risco) devem ser tão baixas quanto razoavelmente possível e consistentes com os propósitos radioterapêuticos pretendidos. Para a radioembolização com microesferas de 90Y, são utilizados geralmente quatro métodos de cálculo de atividade a ser administrada. Para as microesferas de resina são apresentados três: método empírico, método do BSA e método de partição. Para a aplicação de microesferas de vidro, apenas um método de cálculo de atividade está disponível.
99mTc-MAA é utilizado principalmente para análise de LSF e avaliação de deposição
extra-hepática, com o objetivo de prever a distribuição intra-hepática de pós-terapia com microesferas de 90Y. Geralmente realizado através de imagens planar e SPECT/CT. Além disso, a eficácia do tratamento da radioembolização é avaliada pela imagem SPECT de 90Y Bremsstrahlung. No entanto, a imagem SPECT de Bremsstrahlung demonstra uma baixa qualidade de imagem.
Um total de sessenta e dois pacientes foram avaliados para radioembolização após o procedimento de 99mTc-MAA e foram tratados com microesferas de resina usando o método BSA para o cálculo de atividade. Uma avaliação retrospectiva indica que mais de 35% dos pacientes tratados apresentam carcinoma hepatocelular. Esta análise também indica que um grande número de pacientes não apresentou LSF significativo (aproximadamente 80%), e a média da atividade administrada de microesferas de resina foi de cerca de 1,70 ± 0,42 GBq. No entanto, os três casos analisados mostram uma limitação do método BSA para o cálculo da atividade em comparação com um método de partição.
Em conclusão, o cuidado com a seleção do paciente, a preparação do tratamento, com uma dosimetria apropriada, e o desempenho são particularmente importantes para evitar que a toxicidade seja associada a este tratamento. Assim, a mudança para a terapia personalizada com radionuclídeos deve ser o caminho a seguir.
Palavras-chave: Radioembolização; 90Y, Dosimetria interna; Medicina Nuclear, Radioterapia
List of Publications Accepted Resulting
from the Developed Work
“Comparison of three dose calculation methodologies for Y-90 microspheres radioembolization”, V. Antunes, J.A.M Santos
Accepted as a poster in the 1º European Congress of Medical Physics, September 1-4, 2016, Athens Greece.
Contents
Acknowledgements ... iii
Abstract ... iv
Resumo ... v
List of Publications Accepted Resulting from the Developed Work ... vi
Contents ... vii
List of Tables... ix
List of Figures ... x
List Abbreviations and Acronyms ... xiii
1.
Introduction ... 1
1.1. Dissertation Context ... 1
1.2. Dissertation Aim ... 2
1.3. Dissertation Structure ... 2
2.
Nuclear Medicine Fundamentals ... 4
2.1. Quantitative Imaging ... 4
2.1.1. Radioactive decay ... 5
2.1.2. Radioactivity ... 9
2.1.3. Gamma camera imaging ... 11
2.1.3.1. Planar Imaging ... 18
2.1.3.2. Single photon emission computed tomography ... 18
2.1.3.2.1. Reconstruction methods... 19
2.2. Radionuclide Therapy ... 27
2.2.1. Radionuclides Selection ... 27
2.2.2. Radionuclide Application ... 30
2.3. Characteristics of 90Y emission ... 35
2.4. Internal Radionuclide Radiation Dosimetry ... 36
3.
90Y-microspheres Radioembolization ... 40
3.1. Treatment Planning ... 41
3.1.1. Patient Selection ... 42
3.1.2. Angiogram and Therapy Simulation with 99mTc-MAA ... 43
3.2. Activity and Dose Calculation ... 45
3.2.1. Glass microspheres ... 46
3.2.2. Resin microspheres ... 47
3.2.2.1. Empiric Method Calculation ... 47
3.2.2.2. Body Surface Area Method Calculation ... 48
3.2.2.3. Partition Method Calculation ... 48
3.2.2.4. Body Surface Area Method versus Partition Method ... 51
3.3. 90Y-microspheres Therapy ... 54
4.
Material and Methods ... 55
4.1. Pretreatment imaging and dosimetry ... 55
4.2. Evaluation of Bremsstrahlung imaging ... 58
4.2.1. Phantom study ... 59
5.
Results and Discussion ... 62
5.1. Pretreatment imaging and dosimetry ... 62
5.2. Evaluation of Bremsstrahlung imaging ... 70
5.2.1. Phantom and Patient study ... 70
6.
Conclusion and Future Work ... 75
6.1. Future work... 76
List of Tables
Table 1 - Variation of atomic number (Z) and number of nucleons (A) in decay process.
... 6
Table 2 - Radionuclides useful in targeted radionuclide therapy. ... 34
Table 3 - Properties of available commercially 90Y-microspheres. ... 41
Table 4 - Indications and contraindications for Radioembolization. ... 43
Table 5 - Percentage of shunting to the lungs. ... 45
Table 6 - Activity recommendations. ... 47
Table 7 - Advantages and disadvantages of the Body Surface Area method ... 52
Table 8 - Advantages and disadvantages of the partition method. ... 53
Table 9 - Static planar imaging and SPECT protocols, using 99mTc energy specification. ... 56
Table 10 - SPECT imaging protocol for 90Y Bremsstrahlung post-implanting studies. . 59
Table 11 - Patient characteristics... 62
Table 12 - Summary of the characteristics of the case 1. ... 65
Table 13 - Summary of the characteristics of the case 2. ... 66
Table 14 - Summary of the characteristics of the case 3. ... 67
Table 15 - Phantom reconstruction parameters. ... 71
Table 16 - Transversal slices of the patient 1 measurement. ... 74
Table 17 - Transversal slices of the patient 2 measurement. ... 74
List of Figures
Figure 1 - Shape of typical energy spectrum for β-particles (adapted from Podgorsak,
2010). ... 7
Figure 2 - Exponential radioactivity decay, showing relative activity, A, as a function of
time, t (adapted from Turner, 2007). ... 10
Figure 3 - Basic components of a scintillation camera (adapted from Ljungberg et al,
2016). ... 12
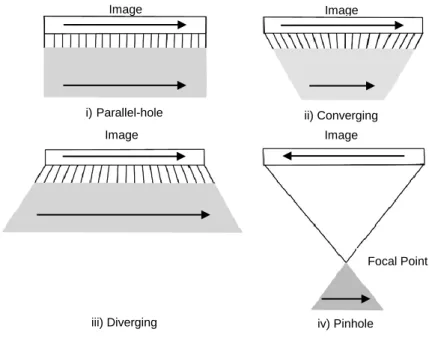
Figure 4 - Types of the gamma camera collimators: i) parallel-hole collimator, ii)
converging collimator, iii) diverging collimator and iv) pinhole collimator (Adapted from Sharp et al, 2005) ... 13
Figure 5 - Schematic cross-section of a NaI(Tl) crystal assembly for a gamma camera
(adapted from Cherry et al, 2012) ... 14
Figure 6 - Illustration of light photon sharing between PMTs. The PMT signal, S, is
inversely related to the distance of the interaction site, D, from the center of the PMT (adapted from Cherry et al, 2012). ... 15
Figure 7 - Energy spectrum of the 99mTc showing the location of the Compton edge and effect of scatter. I) Spectrum obtained with a gamma camera of point source. II) Spectrum obtained with a gamma camera from patient (adapted from Prekeges, 2013). ... 17
Figure 8 - Illustration of circular (I) and contoured (II) orbits for SPECT imaging
(adapted from Cherry et al, 2012). ... 19
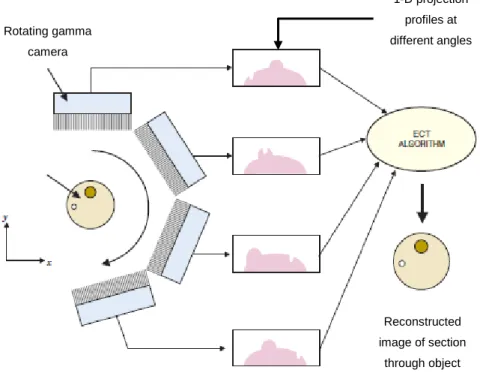
Figure 9 - Rotating the gamma camera around the object provides a set of 1-D
projection profiles for a 2D object, which are used to calculate the 2D distribution of radioactivity in the object. ECT, emission computed tomography (adapted from Cherry
et al, 2012). ... 20
Figure 10 - The (r,s) coordinate system is rotated by projection angle φ with respect to
the (x,y) coordinate system of the object and is fixed with respect to the gamma camera (adapted from Cherry et al, 2012). ... 21
Figure 11 - Sinogram. Each row of sinogram is projection of slice at given angular
Figure 12 - Basic principle of image reconstruction by the backprojection algorithm. (I)
Projection profiles for a point source of radioactivity for different projection angles. (II) Backprojection of one intensity profile across the image at the angle corresponding to the profile. This is repeated for all projection profiles to build up the projected image (adapted from Cherry et al, 2012). ... 22
Figure 13 - (I) Ramp filter in the spatial-frequency (k-space) domain. (II) Illustration of
the steps in filtered backprojection. The 1-D Fourier transforms of projection profiles recorded at different projection angles are multiplied by the ramp filter. After taking the inverse Fourier transform of the filtered transforms, the filtered profiles are backprojected across the image, as in simple backprojection (adapted from Cherry et
al, 2012). ... 24
Figure 14 - Schematic of general iterative reconstruction algorithm (adapted from
Cherry et al, 2012). ... 25
Figure 15 - Local density of ionization produce along track of energetic β-particles,
Auger electrons and α-particles 38. ... 30
Figure 16 - Decay scheme for 90Sr/90Y 35. ... 35
Figure 17 - Planar gamma camera with ROI draw. (I) Planar transmission/emission
image with planar phantom for anatomical location of the lungs. (II) Planar emission image for the calculation of the LSF. ... 44
Figure 18 - Planar gamma camera image with ROI. (I) Planar transmission/emission
image with planar phantom for anatomical location of the lungs. (II) Planar emission image for the calculation of the LSF. ... 56
Figure 19 - Pretreatment 99mTc-MAA SPECT image. ... 57
Figure 20 - (I) Segmentation of liver and tumor on CT scan. (II) Representative liver
from segmentation. (III) Representative tumor from segmentation. ... 57
Figure 21 - Representative axial SPECT image to calculate the T/N ratio. CT and
99mTc-MAA/SPECT images with ROI surrounding the entire liver and the treated tumor.
... 58
Figure 22 - (I) Line source with activity uniformly distributed. (II) Jaszczak Phantom
with line source used in physical experiment. ... 59
Figure 24 - Axial SPECT slice from experimental measurement for noise and contrast
measurements. ... 61
Figure 25 - Calculated activity from BSA method as function of tumor involvement. (I) For whole liver treatments. (II) For lobar treatments. ... 63
Figure 26 - LSF as function of tumor involvement. (I) For whole liver treatments. (II) For lobar treatments... 64
Figure 27 - Relative difference in calculated activities with PM and BSA method as a function of tumor involvement. ... 68
Figure 28 - Comparison between absorbed doses to tumor obtained from PM and BSA method as a function of tumor involvement. ... 68
Figure 29 - Comparison between absorbed doses to normal liver and lung obtained from PM and BSA method as a function of tumor involvement. ... 68
Figure 30 - (I) Representative slice from FBP reconstruction (Bwt, 0.4, 5). (II) 2D plot from axial profile of a 90Y line source in water. ... 73
Figure 31 - (I) Representative slice from iterative reconstruction (2D OSEM, 16i8s). (II) 2D plot from axial profile of a 90Y line source in water. (III) Comparative Gaussian profile. ... 73
Figure 32 - (I) Representative slice from iterative reconstruction (2D OSEM, 8i4s, 10mm Gaussian Filter). (II) 2D plot from axial profile of a 90Y line source in water. ... 73
Figure 33 - Schematic of general procedure of radioembolization. ... 76
Figure 34 - Simplified decay scheme for 90Y... 77
List Abbreviations and Acronyms
111
In
Indium-111
153
Sm-EDTMP
Samarium-153 ethylenediaminetetramethylenephosphonate
177
Lu
Lutetium-177
186
Re-HEDP
Rhenium-186 hydroxyethylidene diphosphonate
32
P
Phosphorus-32
89Sr
Strontium-89
90Y
Yttrium-90
99mTc-MAA
Technetium-99m-Macroaggregated Albumin
A
totalTotal activity
Bq
Becquerel
BSA
Body Surface Area
CT
Computed Tomography
D
LungDose to the lung
DNA
Deoxyribonucleic Acid
D
NLDose to the normal liver
D
TDose to the tumor
EANM
European Association of Nuclear Medicine
EC
Electron Capture
Euratom
European Atomic Energy Community
FBP
Filtered Backprojection
FDA
Food and Drug Administration
Gy
Gray
HCC
Hepatocellular Carcinoma
IPO-PORTO
Instituto Português de Oncologia Francisco Gentil, EPE do
Porto
I
TTumor involvement
LET
Linear Energy Transfer
LSF
Lung Shunt Fraction
MIRD
Medical Internal Radiation Dose
MLEM
Maximum Likelihood Expectation Maximization
MR
Magnetic Resonance
NET
Neuroendocrine Tumors
OSEM
Ordered Subsets Expectation Maximization
PET
Positron Emission Tomography
PHA
Pulse-Height-Analyzer
PM
Partition Method
PMT
Photomultipliers Tube
RIT
Radioimmunotherapy
ROI
Region-of-interest
SIRT
Selection Internal Radiation Therapy
SPECT
Single Photon Emission Computed Tomography
TRT
Targeted Radionuclide Therapy
V
LungVolume of the lung
V
NLVolume of the normal liver
1. Introduction
1.1. Dissertation Context
Liver cancer, from metastatic cancer to hepatocellular carcinoma (HCC), is a highly fatal disease being the second most common cause of death from cancer in the world
1. More than 700,000 new liver cancer cases throughout the world and accounting for
more than 600,000 deaths occurred worldwide each year 2.
One HCC option of treatment, being proposed to certain patients as a locoregional treatment, involves either chemoembolization or radioembolization. Radioembolization is based on the administration of a large quantity of microspheres labeled with yttrium-90 (90Y) in the arterial vasculature of the liver, commonly known as selective internal radiation therapy (SIRT), reaching (and depositing a required dose) the tissues intended to be treated 3,4. The 90Y transarterial radioembolization is a complex technique and requires a multidisciplinary approach to planning, delivering and reviewing cancer treatment 5.
According to 2013/59/Euratom BSS: For all medical exposure of patients for
radiotherapeutic purposes, exposures of target volumes shall be individually planned and their delivery appropriately verified taking into account that doses to non-target volumes and tissues shall be as low as reasonably achievable and consistent with the intended radiotherapeutic purpose of the exposure. That is, to ensure the safe use of
radioactively labeled drugs in medical practice, it is necessary to determine the radiation dose received by the patient (specially the treatment volume, sparing the healthy tissues) 6. For 90Y-microspheres radioembolization, four different models are available for planning the radiation activity for the tumor. For resin microspheres, the previously used activity calculation method was the empiric method. The empirical method is based uniquely on percentage of tumor mass, without any other patient-based factor. The second method, the body surface area (BSA), is the semiempiric method. This is the most widely used methodology for determination the amount of 90 Y-microspheres activity to be administrated to patients and is relatively simple, not taking into account significant variations such as tumor size, shape or location. This model assumes that the size of each patient‘s liver correlates with the BSA. A third, more sophisticated method is the partition method. It is based on tumor and normal liver volumes and expected activity distribution, predicted by single photon emission
computed tomography (SPECT) imaging. The partition model is more accurate, scientifically rigorous and personalized, but less popular due to its relative complexity. For glass microspheres application, only an activity calculation method is available 7–9. A simulation of the real treatment is performed prior radioembolization with technetium-99m-macroaggregated albumin (99mTc-MAA). 99mTc-MAA allows that planar and SPECT gamma-camera imaging and it is used to calculate the lung shunt fraction (LSF) and detect any extrahepatic deposition of activity. Moreover, 99mTc-MAA can also be used to predict the intrahepatic distribution of 90Y-microspheres and subsequently prescribe on an individualized treatment planning including a dosimetry step. Dosimetry can be used to optimize the tumor response and treatment efficacy with acceptable toxicity preventing complications by administration the highest possible activity to the tumor while maintaining low radiation dose to the sensitive and other healthy tissues 8–
11.
1.2. Dissertation Aim
Yttrium-90 radioembolization is a well-established therapy for the treatment of the liver diseases and also of metastatic liver deposits from other malignancies. The first aim this work was to make an evaluation be about 90Y-microspheres techniques and challenges facing it in terms of the dosimetry with focus on the Partition Method. In addition, in radionuclide therapy it is necessary to measure the distribution of the radiopharmaceutical in vivo. Measurements are usually performed by SPECT imaging. Thus, the second aim was to investigate the quality of Bremsstrahlung SPECT imaging using different reconstruction methods.
1.3. Dissertation Structure
This thesis is comprised of a background chapter and a series of chapters describing the findings and outcomes of this research.
The second chapter presents general concepts of Nuclear Medicine that will be needed throughout this work. Chapter 2 includes the physics behind the Nuclear Medicine, the components and operation of a gamma camera as well as the development of SPECT reconstruction methods. And still the concepts and the current practice of nuclide therapy and the fundaments of the internal radionuclide radiation.
The third chapter presents the methodology of 90Y-microspheres radioembolization including treatment planning, activity and dose calculation and therapy.
In chapter 4 is clarified the methodology used in this work with a pre-therapy and post-therapy evaluation.
Chapter 5 summarizes the results obtained as well as discussion of one of them. The last chapter presents the conclusions and discusses the future work.
2. Nuclear Medicine Fundamentals
Nuclear medicine is a medical specialty that involves the administration of radioactive tracers (radiopharmaceuticals) that are used to diagnostic information and treat diseases in a safe and painless way. The radiopharmaceutical has a radionuclide labeled with a pharmaceutical and the mode of tracer administration will depend on the disease process that will to be implemented. For most diagnostic studies in nuclear medicine, the radioactive tracer is administered to a patient by intravenous injection. However, the radiopharmaceutical may also be administered by inhalation, by oral ingestion, or by direct injection into an organ 12.
The type of radiation used is strongly linked with the purpose of the radiopharmaceutical. For diagnosis, the pharmaceutical is labeled with a gamma-ray-emitting radionuclide or positron-gamma-ray-emitting radionuclide. In therapy the radionuclide ideally has a pure negative beta-emitting or an alpha-emitting radionuclide. When the radionuclide decays, gamma-rays or high-energy photons are also emitted. Although some radiation interacts with body tissues by scatter and attenuation, a significant number can exit the body. The radiation that escapes can be externally detected by a sensitive gamma camera, and can be used to form an image of the distribution of the radiopharmaceutical in the body. The image of gamma-ray emission is performed with a single photon imaging (Planar imaging or SPECT with Anger camera) and the positron imaging (PET) is used when there is a positron emission.
This work focuses on a particular therapeutic use of radionuclides in modern medicine. Before discussing about radionuclide therapy, a brief introduction on important concepts will be presented.
2.1. Quantitative Imaging
Radionuclide therapy is gradually becoming more important as a therapy option in various diseases or as adjunct to external beam radiotherapy and chemotherapy 13. Nuclear medicine imaging plays an important role in this process, before, during and after the therapy. Prior to the therapy, imaging can be used to predict dose to the tumor and surrounding organs, using a surrogate radiopharmaceutical. During treatment can be used for delivery control and dose assessment. After therapy it is important to follow the patient‘s response 14.
Nuclear medical imaging is based on detection of radiation distribution emitted from the body after administering a radiopharmaceutical. Thus, radionuclides that emit photons with appropriate energy (typically in the 60 to 600 keV range) for imaging during decay, the activity distribution in vivo can be estimated by imaging these photons outside the body using a scintillation gamma-camera. At the same time, the energy should not be so high that it cannot be collimated or detected efficiently. Gamma-emission imaging may be subdivided into categories, planar scintigraphy and emission tomography in the form of single photon emission computed tomography (SPECT) 15.
2.1.1. Radioactive decay
Radiological physics began with the discovery of x-rays by Wilhelm Rontgen, of natural radioactivity by Henri Becquerel, and of Polonium and Radium by the Curies in the 1890s. The introduction of artificial radioactivity by I. Curie and Joliot prompted the invention of cyclotrons and reactors in which many radionuclides are now produced with different physical properties 16.
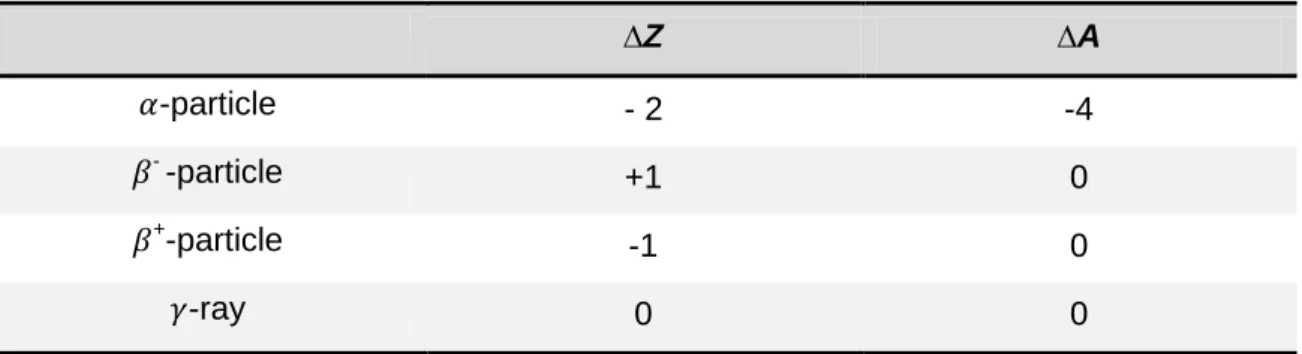
Radioactive decay is a spontaneous process in which an unstable nucleus (parent) transforms into a more stable configuration (daughter) through expulsion of energetic particles. In many cases, the daughter is also radioactive and undergoes further radioactive decay. This process results in the conversion of mass into energy and the total energy (mass, quantum and kinetic) of photons and other particles released by the disintegration process is equal to the net decrease in the rest mass of the neutral atom. Total energy, momentum, and electric charge are each conserved in the process 17. Each radionuclide has a set of characteristic properties that include the mode of radioactive decay and type of emissions. The radioactive nuclei, X, disintegration is characterized by changes in the atomic number, Z (number of protons) and mass number, A (number of nucleons) when decays into a daughter, Y (Table 1). The main disintegration processes are alpha decay ( ), electron decay ( -), positron decay ( +),
electron capture and gamma decay ( ). Several others processes can be also involved
18
Table 1 - Variation of atomic number (Z) and number of nucleons (A) in decay process. ∆Z ∆A -particle - 2 -4 - -particle +1 0 +-particle -1 0 -ray 0 0 ALPHA DISINTEGRATION
The α-decay occurs mainly in heavy nuclei such as uranium, plutonium and so forth. The α-particles consist in helium ions with two protons and two neutrons. The standard notation of the decay by an α-particle emission is represented as:
→ Equation 1 After decay, the mass number of the nucleus is reduced by 4 and the mass number by 2, resulting in a transformation of elements. The kinetic energy of the α-particle is, in general, between 4 and 8 MeV. Despite the high-energy of the -particles, they present several difficulties in diagnostic medical imaging, because the range is very short and cannot even penetrate the outer, dead layer of skin, Bremsstrahlung x-ray is also a major problem. However, α-particles have an increase medical interest for radiation therapy (e.g. Radium-223) 12,16.
BETA DISINTEGRATION Beta decay
When a radionuclide is neutron rich, it tends to emit an electron ( --particle), leaving
the nucleus with one less neutron and one more proton. Schematically, the process is:
̅ Equation 2
The --particle and the antineutrino ( ̅) are created at the moment of nuclear decay. The antineutrinos have no electric charge or mass, they do not interact with matter and therefore are essentially undetectable, unless in rather sophisticated experiments. In the --decay, a neutron is converted to a proton, thus the atomic number Z is increased
→ ̅ Equation 3
Mass number, A, does not change, this because the total number of nucleons (protons + neutrons) remains constant, so that the parent and daughter are isobars.
The energy released in the negative --decay, this is, the difference of energy between
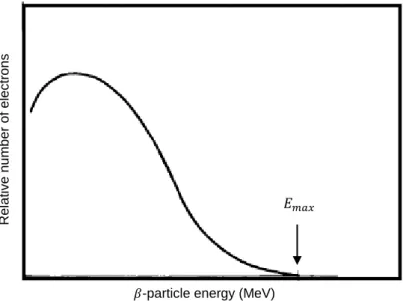
parent and daughter nuclides is called the transition energy ( ). The is the maximum possible --particle energy, may be also shared with antineutrino. This result
in a spectrum of energy as showed in Figure 1.
Figure 1 - Shape of typical energy spectrum for -particles (adapted from Podgorsak, 2010).
Pure beta-rays can penetrate only relative small thicknesses travelling a short distance inside the tissue. Thus they are not useful for diagnostic imaging, because it is impossible to detect -particles coming from a patient with a detector. Bremsstrahlung radiation is used, with poor image quality results. Nevertheless, a pure beta-emitter can be used in radionuclide therapy, as will be seen in section 2.2. In some cases, the beta-emitter radionuclides also emit gamma-rays. As mentioned, the high-energy of -
-particles can emit Bremsstrahlung x-ray. This can be the only radiation that is used for measurement in vivo 12,16,17.
Bremsstrahlung is the German term for ―braking radiation‖. In the Bremsstrahlung
process, a charged particle ( ) travelling in a material is slowed when it is deflected by another charged particle. As a high speed electron passes near atomic nucleus, its path of travel will be changed somewhat in the direction of the nucleus and, subsequently slow down and loses energy. In these cases, the energy lost is released in the form of electromagnetic radiation, called Bremsstrahlung.
𝐸𝑚𝑎𝑥
𝛽-particle energy (MeV)
Rel a ti v e n u m b e r o f e le c tr o n s
Positron decay
In the other hand, when the radionuclide has an excess of protons in the nucleus usually occurs a positron emission ( +
-particle) accompanied by the emission of a neutrino. A positron is the antiparticle of an ordinary electron and its emission only occurs when the energy difference (transition energy) between the parent and daughter nuclides is greater than 1.02 MeV. In positron decay, essentially a proton is converted to a neutron reducing Z by one unit and leaving A unchanged:
Equation 4
→ Equation 5
After +-emission, it loses its energy passing through matter. The range of +
-particles is short in matter, thus it interacts with a nearby electron and is annihilated, given rise to two photons of 0.511 MeV emitted in almost opposite directions. This process is called annihilation reaction and permits that the resulting photons to be useful in diagnostic imaging (PET) 12,16.
ELECTRON CAPTURE
Some nuclei undergo a radioactive decay by capturing an orbital electron, usually from K-shell because of its proximity. The captured electron is combined with a proton to form a neutron and eject a monoenergetic neutrino 12,17. This reaction is an alternative to +-decay with same net effect, the Z decreases by 1, but A unchanged.
Equation 6
→ Equation 7
In this process, vacancy is created in the shell from which the electron is captured. When the vacancy is filled by the transition of an electron from the next upper shell, the remaining energy appears as characteristic x-ray and/or Auger electron emitted by the daughter nuclide 16.
GAMMA-RAY EMISSION
Gamma-ray decay occurs when a daughter nuclei in an excited state releases its excess energy by emission of electromagnetic radiation (photons) until it achieves a stable level. Transitions that result in gamma emission leave Z and A unchanged and
are called isomeric transition. These states may have lifetimes of fraction of picoseconds to many years. When isomeric states are long lifetime is known as
metastable state, as in the case of the 99mTc 16.
Metastable radionuclides are of great importance in nuclear medicine due to the fact that gamma-energy can be easily detected by external equipment. Although metastable nuclides always emit a certain number of conversion electrons, they do not contribute for the image because almost all are absorbed within the tissue 12.
INTERNAL CONVERSION
An alternative to the -ray decay is the internal conversion (IC) process. This process can occur if excited nucleus transfers the excitation energy to an orbital electron, which is ejected instead of the -ray. The ejected electron is called the conversion electron and carries the energy excess above the biding energy as kinetic energy. The orbital vacancy created by internal conversion consequently is filled by an electron from the next higher shell. And, such as in electron capture, characteristic x-ray and/or Auger electron are emitted 16.
2.1.2. Radioactivity
Radioactivity is characterized as spontaneously emission of radiation by an unstable nuclide. In general, there are two classifications of radioactivity: natural and artificial. However, the radioactive decay is a random process and is no way to predict with certainty the exact moment of its transformation into another stable nucleus. Mathematically, radioactive decay is described in terms of probability and average decay rates.
The decay rate of a radionuclide is the number of disintegration per unit time, also referred as activity, denoted by A. In the others words, the activity is proportional to the total number of radioactive nuclei (dN) that decay in a period of time (dt) (Equation 8). The traditional unit of activity is the Curie (Ci), even though by System International (SI) the official unit of activity is the Becquerel (Bq), defined as one disintegration per second: 1 Bq = 1 s-1. The curie is thus defined as 1Ci = 3.7 x 10¹⁰Bq.
Equation 8
The negative signal means that N decreases as the time t increases. The quantity is the decay constant of the radionuclide and it has the dimensions of inverse time (s-1).
The decay constant is a characteristic value for each radionuclide and it represents a small fraction of the radioactive atoms that decays in a very short period of time 12,16,17. With the passage of the time, the number of atoms (N) in a sample decreases and consequently the activity also decreases. The factor that represents this decay is obtained by integration of Equation 8. The result is:
Equation 9
Equation 10
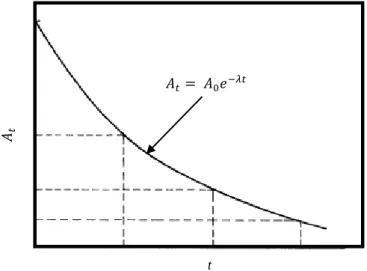
where is the number of atoms remaining after a time , is the number of atoms at time and is the decay factor. The decay factor is an exponential function of time, thus both the number of radioactive atoms and activity remaining in the sample are decreasing continuously with time. A graph of either of these quantities is a curve that gradually approaches zero 19.
Figure 2 - Exponential radioactivity decay, showing relative activity, A, as a function of time, t (adapted from Turner, 2007).
Every nuclide is characterized by a half-life ( ), which is the expectative value of the time required for one-half of the initial radioactive atoms to disintegrate, and therefore the sample reduce to half of its existing activity. The decay constant and half-life of a radionuclide are related as 17:
Equation 11
When considering the use of radioactive drugs for both diagnostic and therapeutic purposes another characteristic to be considered. This is because it disappears from
𝐴𝑡 𝐴 𝑒 𝜆𝑡
t
the body not only by radioactive decay but also by biological clearance. In this way, a new factor arises, the effective half-life ( ). It is defined as the period of time required to reduce the radioactivity level of an internal organ or of whole body to one half its initial value due to both decay and elimination. The effective half-life is then related by:
Equation 12 The effective half-life takes into account not only the radioactive decay represented by physical half-life ( ) but also the elimination represented by biological half-life ( ). While the physical half-life is unaffected by anything that human can do to the radionuclide because is unique parameter for each radionuclide. The biological half-life represents the period of time required to reduce the amount of a radiopharmaceutical the body to one half its original value due solely to biological elimination 16.
2.1.3. Gamma camera imaging
Anger scintillation camera or gamma camera, as popularly called, is the most common imaging system used in Nuclear Medicine and radionuclide therapy 20. It is called in honor of Hal O. Anger, who invented it in the late 1950s 12. The equipment detects gamma photons emitted by radionuclides and forms planar or 2D projection images of the 3-D distributed radionuclides in vivo 15.
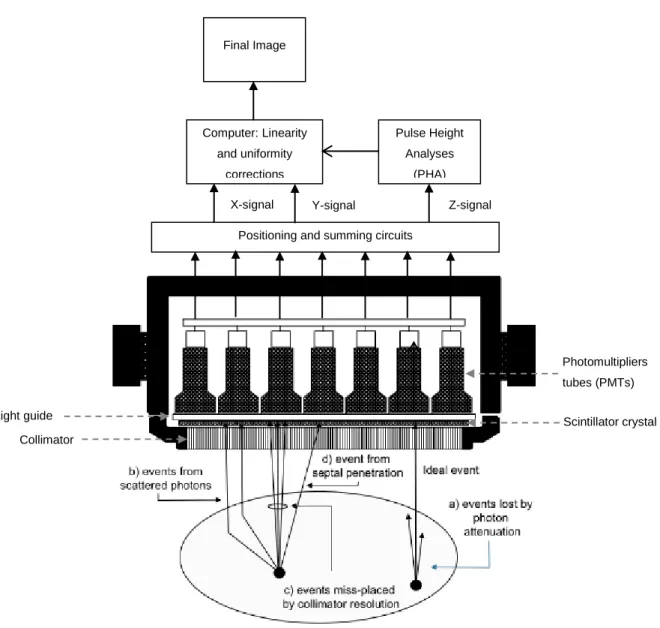
Many sophisticated improvements have been made on the gamma cameras over the years. However, the basic principles of the operation have essentially remained the same. Figure 3 illustrates the basic principles of image formation with the gamma camera. The gamma camera converts photons, emitted from and transmitted through the patient, in electric signal if passing through a collimator and being detected by a scintillation detector 20. The major components are a collimator, a scintillation crystal, a light guide, an array of photomultipliers tubes (PMT), pulsed-height analyzer (PHA), an X-, Y-positioning circuit 12. The main components are described below.
Photomultipliers tubes (PMTs)
Scintillator crystal Collimator
Light guide
Positioning and summing circuits
Pulse Height Analyses (PHA) Z-signal X-signal Y-signal Computer: Linearity and uniformity corrections Final Image
Figure 3 - Basic components of a scintillation camera (adapted from Ljungberg et al, 2016).
COLLIMATOR
The collimator is the first component of the gamma camera after the photons leave the patient and is used to define the direction of the detected -rays. The most common consist of a lead plate or a similar high atomic number substance and stopping power such as tungsten. They are designed in different sizes and shapes and contain a large array of holes (circular, triangular, square or more frequently hexagonal shaped) to view the area of interest. The purpose of the collimator is to permit that incident photos traveling along only certain directions, reaching the scintillation crystal and thereby providing a means to localize the site of the emitting sources. It is the image forming component of the Anger camera 15.
Image Image
Collimators are primarily classified by the type of focusing, can be parallel-hole, pinhole, converging or diverging type. Pinhole collimator has a conic form with a single hole. Its main use is to give a significantly magnified image of a small organ such as the thyroid glands or heart. The organ must be located near a body surface so that the pinhole can be positioned close to it. There is a variation in resolution and sensitivity across an organ, and sensibility falls of quickly with increasing distance source-aperture 12. Parallel-hole collimator is the most commonly collimator used in nuclear medicine procedures. This collimator is made with holes that are parallel to each other and perpendicular to the face of the collimator. The γ-rays image projected by this collimator has the same size as the source distribution onto scintillation crystal.
Parallel-hole collimator are classified as low-energy, medium-energy or high-energy
and high-resolution, all-purpose and high-sensibility. The characteristics of parallel-hole collimator such as septal thickness, septal length and size of collimator hole are chosen according to the energy of the radionuclide using for image 16. Converging
collimators are made with tapered holes converging to a point in front of the collimator
and are provide magnified images. This collimator is employed when the organ of interest is smaller than the size of the detector. Diverging collimator has holes that diverge from the detector face. In opposite to the converging collimator, images of organ larger than size of the detector are minified (Figure 4) 16.
Figure 4 - Types of the gamma camera collimators: i) parallel-hole collimator, ii) converging collimator, iii) diverging collimator and iv) pinhole collimator (Adapted from Sharp et al, 2005)
i) Parallel-hole iv) Pinhole iii) Diverging ii) Converging Image Image Focal Point
SCINTILLATION CRYSTAL
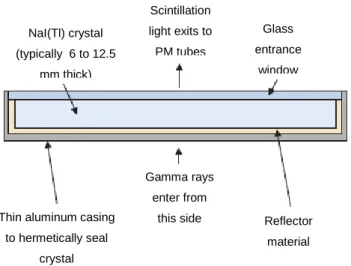
The γ-rays that passed through the collimator interact with the detector. The detector used in gamma camera is a continuous scintillation crystal made from sodium iodine doped with a small amount of thallium, NaI(Tl) (Figure 5). The function of the NaI(Tl) crystal is to stop the gamma photons and convert these into visible light photons (scintillation) 15. The choice of the thickness of the crystal is a trade-off between detection efficiency and image quality. Because increasing the thickness of a detector increases the probability of complete observation of γ-rays and hence the sensibility, but resolution of the image of the area the interest deteriorates. Also, the probability of multiple Compton scattering also increases in thicker detectors 16.
The amount of scintillation light produced following the interaction of a single gamma photon is proportional to the energy deposited by the incident photon and these optical photons are emitted isotropically from their point of creation. These photons deposit energy within the scintillation crystal by a photoelectric or a Compton scattering interaction. Therefore, the desired event is the photoelectric interaction where the entire energy of the photon is transferred to an electron and the photon ceases to exist. In a Compton scattering only a partial amount of the energy of the photon is transferred to the electron and the photon changes direction and loses energy. The visible light is then guided towards the photomultiplier tubes through the light guide increasing the light collection efficiency 12,15.
Figure 5 - Schematic cross-section of a NaI(Tl) crystal assembly for a gamma camera (adapted from Cherry et
al, 2012) NaI(Tl) crystal (typically 6 to 12.5 mm thick) Scintillation light exits to PM tubes Glass entrance window
Thin aluminum casing to hermetically seal
crystal
Gamma rays enter from
this side Reflector material
PHOTOMULTIPLIERS TUBES (PMTs)
The photomultiplier tubes are fixed on the NaI(Tl) crystal with the photocathode facing the crystal by a special optical grease or connected to the crystal using light pipes. The PMTs are usually arranged in a close-packed array and are mounted in a hexagonal fashion to ensure that the smallest possible gaps are left between tubes 16. The visible light photons collected by a particular PMT are converted into electrons, multiplied and converted into an electrical signal 15. It amplifies the electronic signal (typically by a factor of 107) in order to generate a sufficiently large current to be received and processed by the subsequent electronics 21. The output signal from PMTs are fed into positioning logic circuits or software which is used to define the X, Y location of the point of interaction of the γ-rays in the detector 16.
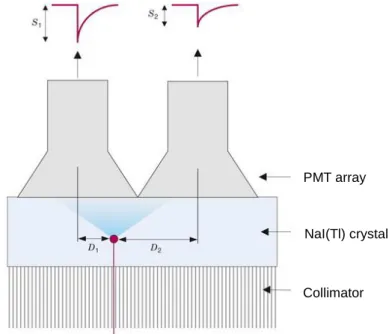
The amount of light photons detected by a PMT is inversely related to the lateral distance between the interaction site and the center of the PMT. The PMT closest to the point of interaction collect the largest number of light photons. Subsequently, it will have a largest output signal, with the amplitude of the signal output of the other PMT decreasing with increasing distance from the interaction point (Figure 6) 22.
Figure 6 - Illustration of light photon sharing between PMTs. The PMT signal, S, is inversely related to the distance of the interaction site, D, from the center of the PMT (adapted from Cherry et al, 2012).
ELECTRONIC INSTRUMENTATION
The position information for an event on the crystal is used to form the 2D projection image and hence the final image depends of the distribution of signal amplitudes in the
Collimator PMT array
PMTs. The location of the gamma-ray interaction can be estimated by the calculation of centroid of the position-weighted PMT outputs, a process often referred to as Anger Logic or Anger Arithmetic 22.
In analogue circuits the signals from PMTs are processed to give three signals required X, Y and Z. The X and Y provide spatial information the point of interaction of the γ-ray in the scintillation crystal by use an X-, Y-positioning circuit. The Z-signal is proportional to the total energy deposited in the crystal by a scintillation event produced simply by circuit the outputs from all the tubes. This electrical pulse is analyzed by a pulse-height analyzer (PHA) and is accepted if it falls within the range of selected energies 16,21. The spatial information is more complex to generate. All PM tubes are connected through resistors and the position is determined by splitting the signal from each PMT onto four output lines (X+, X-, Y+ and Y-). The output signal from each PMT is determined by the appropriate resistor values and then summed to form each of the X+, X−, Y+, and Y− signals individually 12.
Also, these pulses can be stored in the computer. In modern camera systems, the output signal from each PMT is digitized and the event position is calculated in software. In digital cameras the analogue signal is required to be digitized. So, two general approaches are currently taken; the X, Y and Z signals are acquired in analog form and then digitized by analog-to-digital converters (ADC) to digital signals or the position signals and the total energy deposited being digitized before signals are computed. The position estimates are computed by combining only PMT with signals above a certain threshold. Therefore, with signal thresholding, only a small number of PMT surrounding the interaction location are used for position determination 16,22.
PULSE-HEIGHT-ANALYZER (PHA)
The summing circuit provides the energy signal (Z), which is proportional to the amount the light photons produced by a scintillation event in the crystal. After the Z pulses are formed by the summing circuit, each event is analyzed by pulse-height-analyzer (PHA). The PHA allows selecting only the Z signals where the gamma rays energy has a certain amplitude range of interest. This energy range is selected by use of appropriate peak and window setting, which is usually chosen according to the radionuclide being imaged 12,16.
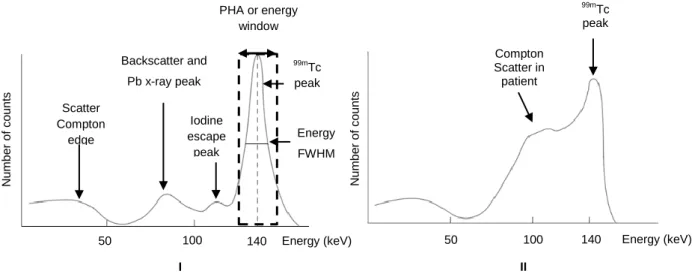
A typical energy spectrum includes several peaks. A typical example is the 99mTc spectrum with a gamma ray of 140 keV and typically a window equal to 20% centered symmetrically on the photopeak is employed. In Figure 7 is possible see the different
features of this spectrum. The photopeak is the peak that corresponds to interaction in which the total energy of the γ-ray (140 keV) is absorbed in the scintillation crystal, whereas other peaks in the energy spectrum represent some loss of energy from the detection process and therefore will be to the left of the photopeak. The Compton
plateau results from the Compton scattering in the scintillator or detector and scattered
photons that escape from the detector. In this situation only a fraction of its energy is registered by the detector with a peak from 0 to Emax. The Emax that corresponds to the
Compton edge is the kinetic energy of those photons that are produced by the 180°
Compton backscattering of the γ-ray photons in the detector. In addition, Compton scattering occurs not only in the detector but also outside of the detector. Some scattered photons, created inside the patient may lose only a small amount of energy. In such cases, a γ-ray can travel toward the detector, its energy may fall between the photopeak and the Compton edge 16. A characteristic x-ray is produced by photoelectric interaction of the γ-ray with the shielding or collimator. Because this interaction can cause injection of the k-shell electrons, followed by transition of electrons from the upper shells. The difference in binding energy between the levels appears as lead x-ray. The backscatter peak occurs when the gamma ray are scattered at 180º by Compton scattering in the source or surrounding structures and then absorbed in the crystal, appearing in the γ-ray spectrum 12. Iodine escape peak results from photoelectric interaction with iodine atoms of the NaI(Tl) crystal where usually occurs emission of characteristic K x-rays. This peak appears about 28 keV below the photopeak 12.
Figure 7 - Energy spectrum of the 99mTc showing the location of the Compton edge and effect of scatter. I) Spectrum obtained with a gamma camera of point source. II) Spectrum obtained with a gamma camera from
patient (adapted from Prekeges, 2013).
99mTc peak 140 50 100 Energy (keV) Iodine escape peak PHA or energy window Backscatter and Pb x-ray peak Scatter Compton edge N u mbe r o f c o u n ts I 140 50 100 Energy (keV) Energy FWHM N u mbe r o f c o u n ts Compton Scatter in patient 99mTc peak II
2.1.3.1. Planar Imaging
In planar imaging, the final images are a three-dimensional (3-D) distribution of the radioactivity as a two-dimensional (2D) projection. This results in an image with little depth information where structural information is obscured by superimposition of all photons emitted along projections lines. Thus, photons emitted also from overlying and underlying activity along the projection lines will contribute to the signal recorded in a particular pixel. This generally reduces the image contrast in the plane of interest. The problem can be minimized by obtaining multiple planar views (posterior, anterior, lateral, oblique) giving some information about the depth of a structure. For this reason, a 3-D imaging technique has been developed to tackle the problem directly 16,20.
2.1.3.2. Single photon emission computed tomography
SPECT imaging requires two fundamental components: a gamma camera and a means of performing image reconstruction 22. The tomographic mode of single photon imaging (SPECT) is based on detecting individual photons emitted isotropically by the radionuclide. The gamma camera rotates around the long axis of the patient to acquire multiple projection images at equal spaced angular intervals for collection of data over 180º or 360º. The data are collected in the form of pulses at each angular position and normally stored in a 64 × 64 or 128 × 128 matrix in the computer. As result provide a series of the static images at distinct depths of the organ of interest for later reconstruction 12,16.
The idea behind tomography is to recreate the depth information along the projection line, in order overcome the problems of superimposition of radioactivity. Nevertheless, this can only be properly accomplished if certain requirements are followed: (i) a complete set of projections is acquired, (ii) the internal distribution is not spatially or temporally changing during the time that the projections are acquired, (iii) the detectors that acquire the projections have uniform detection sensitivity that remains constant throughout the acquisition, and (iv) the acquired projections have a common center and its accurate location is required for proper alignment of the projections during reconstruction 23.
Older cameras were initially designed to rotate in circular orbits around the body. This causes loss of data and rapid degradation in spatial resolution with increasing distance of the object from the collimator. To circumvent this problem, many SPECT systems allow the detector head to trace out elliptical rather, permitting that the detector to pass
closer to the patient than would be the case with circular orbits, which can lead to significant improvements in spatial resolution (Figure 8) 12,16.
Figure 8 - Illustration of circular (I) and contoured (II) orbits for SPECT imaging (adapted from Cherry et al, 2012).
In a reconstruction, it is assumed that the activity distribution remains stationary throughout the acquisition. However, it is important to note that the information collected by SPECT systems is not linearly related to the ray sums of activity in the patient because of tissue attenuation. This means that the difference in spatial distribution of counts in the acquired projection images limit the quality of reconstructed images. The advances in SPECT are directly knotted to improving the quality and accuracy of the acquired projections either through better instrumentation or reconstruction method 20,23.
2.1.3.2.1. Reconstruction methods
A basic problem in conventional radionuclide imaging is that the images obtained are 2D projections of 3D source distributions. To obtain information along the depth of the organ of interest, tomographic images are used to calculate transaxial slices using mathematical algorithms 24. Reconstruction mathematical algorithms, such as filtered backprojection (FBP) method or an interactive reconstruction algorithm are two common methods of image reconstruction using the acquired data. In the past, the filtered backprojection method was the golden standard of reconstruction methods, but nowadays, due to the promise of better image quality in an acceptable time interval due to an increase in computer performance, iterative reconstruction methods are preferred
alternative methods for performing SPECT (and other tomographic image acquisitions) reconstruction 23. Both methods are described below.
Before discussing reconstruction methods, it is necessary to introduce some general concepts. Assuming that the data is acquired by a dual-head gamma camera fitted with a conventional parallel-hole collimator with heads counted in opposition (i.e. 180º), the 3D dataset of -emitter distribution is obtained by pilling up many slices usually reconstructed independently. For this, the detector rotates around the organ of interest and allows one to observe the pattern of γ-emission in the field of view for many angles Figure 9 25.
Figure 9 - Rotating the gamma camera around the object provides a set of 1-D projection profiles for a 2D object, which are used to calculate the 2D distribution of radioactivity in the object. ECT, emission computed
tomography (adapted from Cherry et al, 2012).
For the purpose of analyses, it is convenient to introduce a coordinate system (Figure 10 - The (r,s) coordinate system is rotated by projection angle φ with respect to the (x,y) coordinate system of the object and is fixed with respect to the gamma camera (adapted from Cherry et al, 2012). that is stationary with respect to the gamma camera detector. Defining (r, s) as the estimated number of photons emitted at any point (x, y), of the transverse slice in the field of view. And If the camera is rotated by an angle with respect to the (x, y) coordinate system of the scanned object, the equations for transformation from (x, y) to (r, s) coordinates can be derived from the principle of similar triangles and are given by:
Rotating gamma camera 1-D projection profiles at different angles Reconstructed image of section through object
Equation 13
Equation 14
These equations can be used to determine how radioactivity at a location (x,y), for each detector angle φ, and for each location r on the detector. Because the collimator allows only photons whose direction is parallel to the axis of its holes to be potentially detected. 25.
Figure 10 - The (r,s) coordinate system is rotated by projection angle φ with respect to the (x,y) coordinate system of the object and is fixed with respect to the gamma camera (adapted from Cherry et al, 2012).
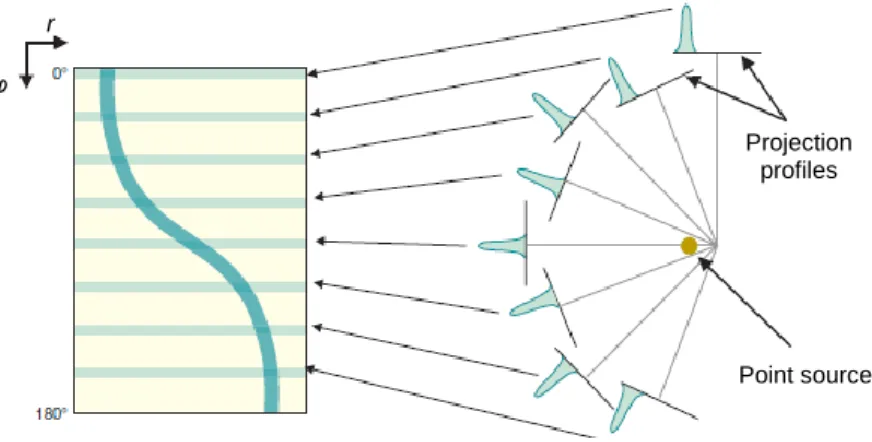
A common representation of the matrix p(r, φ) is generically known as a sinogram (Figure 11). A sinogram is a 2D image, in which the horizontal axis represents the count location on the detector, and the vertical axis corresponds to the angular position of the detector. The successive rows from top to bottom represent successive projection angles. The sinogram provides a convenient way to represent the full set of data acquired during a scan and can be useful for determining the causes of artifacts in SPECT image. For example, this should demonstrate the smooth progress of the camera head around the patient and any discontinuity indicates patient movement 12,25.
Figure 11 - Sinogram. Each row of sinogram is projection of slice at given angular position of detector (adapted from Cherry et al, 2012).
FILTERED BACKPROJECTION
Filtered backprojection (FBP) is a modification of an older technique, called
backprojection or simple backprojection. Simple backprojection is a common sense approach, but much unsophisticated. The principle of simple backprojection is illustrated in Figure 12 in which a point source object is acquired from different angles. An image of the original distribution is by ―backprojecting‖ each profile at the appropriate angle on to an image array in the computer. An approximation for the source distribution within the scanned slice is obtained when all projection profiles acquired are added together 12.
Figure 12 - Basic principle of image reconstruction by the backprojection algorithm. (I) Projection profiles for a point source of radioactivity for different projection angles. (II) Backprojection of one intensity profile across the image at the angle corresponding to the profile. This is repeated for all projection profiles to build up the
projected image (adapted from Cherry et al, 2012).
φ r Point source Projection profiles Object Backprojection of profile at 0º across image matrix.
2 angles 8 angles 256 angles Backprojection after
I
However, when the number of projections is small relative to the matrix size, there is a ―star-pattern‖ artifact resulting from counts that inevitably are projected outside the true location of the object, causing a blurring final image 25. Mathematically, the relationship between the real image and the image reconstructed by simple backprojection is described as:
( ) ( ) Equation 15
This way, the blurring effect can be reduce by increasing the number of acquired projections and by decreasing the distance (r) from the object of interest 12. In addition, this problem can be minimized by filtering the profiles prior to backprojection and, the filtered projections are then backprojected to produce an image that is more representative of the original object 16.
It is important to understand that nuclear medicine data is obtained in the spatial domain. And, the frequencies of an image are similar to the frequencies of a sound, where the data for each row and column of the acquisition matrix can be considered as composed of sinusoidal waver of varying amplitudes and frequencies. Thus, using the mathematical technique known as Fourier analysis, it is possible to describe images in terms of their spatial frequencies. The Fourier method of filtering the projection data in the Fourier domain is based on the initial transformation of these data from the spatial domain, represented by ( ), to the frequency domain, ( ), which is denoted as 12,16,25:
( ) ( ) Equation 16
Finally, the operation of converting the Fourier transform (FT) of a function back into the original function is called an inverse FT and is expressed as 12:
[ ( )] ( )
Equation 17
In this method, filters are used to eliminate the blurring function 1/r that arises from simple backprojection of the projection data. The idea is apply a Fourier filter applied in -space before perform the inverse FT. In nuclear medicine, a number of Fourier filters have been designed and used in the reconstruction of image. In common, it have the called Nyquist frequency, that gives an upper limit to the number of frequencies necessary to describe the sine or cosine curves representing an image projection 16.
A well-known filter is the ramp filter (Figure 13), which gives a weight proportional to its frequency to each of the components. This filter will enhance the higher spatial frequencies, the aim being to restore higher spatial frequencies lost by the back-projection process. However, this can also be a problem, because the noise associated with high frequencies in the image is amplified. In addition, the ramp filter to suppress low spatial frequencies that help to removes the blurring effect of simple backprojection
12,16.
Figure 13 - (I) Ramp filter in the spatial-frequency (k-space) domain. (II) Illustration of the steps in filtered backprojection. The 1-D Fourier transforms of projection profiles recorded at different projection angles are multiplied by the ramp filter. After taking the inverse Fourier transform of the filtered transforms, the filtered profiles are backprojected across the image, as in simple backprojection (adapted from Cherry et al, 2012).
To eliminate the high-frequency noise, a window is applied to the ramp filter. The effect of a decreasing window at higher frequencies is to eliminate the noise associated with them. The frequency above which the noise is eliminated is called the cut-off frequency. The typical cut-off frequencies vary from 0.2 to 1.0 times the Nyquist frequency, being that the Nyquist frequency is the highest cut-off frequency. The choice this frequency should be a compromise between noise reduction and image details preserved, because with a very high cut-off value, image detail may be lost 16.
To minimize these effects on signal-to-noise ratio (SNR) and artifacts at sharp edges a variety of reconstruction filters have been developed, each with its own theoretical rationale. Hann, Hamming, Parzen, and Shepp–Logan filters are all low-pass filters because they preserve low-frequency structures, while eliminating high frequency
Backprojection of filtered profile at 0º across image matrix.
2 angles 8 angles 256 angles Filtered backprojection after
kmax k
H(kr)
II I
noise. Butterworth filter is an important low-pass filter that is most commonly used in nuclear medicine. This filter has two parameters: the cut-off frequency (fc) and the
order (n) 16. The cut-off frequency defines the frequency at which the filter attenuates the amplitude, which for the Butterworth filter is 0.71. One has to be aware of the fact that, by limiting the frequency content of an image, not only is noise is reduced, but also useful information may be lost. The order of the filter allows changing the slope of the filter function that is determines how rapidly the attenuation of amplitudes occurs with increasing frequencies. Thus, the higher the order, the greater the slope. No filter is perfect and, therefore, the design, acceptance, and implementation of a filter are normally done by trial and error with the ultimate result of clinical utility 26.
ITERATIVE RECONSTRUCTION
FBP has some limitations due to the presence of streak artifacts that are particularly prominent near hot structures and the noise enhancement that is inherent in the reconstruction. An alternative to FBP is the use of iterative reconstruction techniques, which can more readily incorporate more complex models of the underlying physics and also can better accommodate assumptions regarding the statistical variability of acquired data. As this method is more complex, is also computationally more intensive than FBP.
Figure 14 - Schematic of general iterative reconstruction algorithm (adapted from Cherry et al, 2012).
SPECT system Object f(x,y)
Measured projection data sinogram p(r,φ) Compare converged? Calculated projection data p(r,φ) Image estimate f*(x,y) Forward projection Yes Update image estimate No