Copyright Ó 2017 Cognizant, LLC. E-ISSN 1943-3999 www.cognizantcommunication.com
337
Address correspondence to Luís Pacheco, Department of Economics, Management and Computer Sciences, Room 201,
Universidade Portucalense, REMIT-Research on Economics, Management and Information Technologies/IJP-Portucalense Institute for Legal Research, Rua Dr. António Bernardino de Almeida, 541-619, 4200-072 Porto, Portugal. Tel: +351 225572000;
Fax: +351 225572010; E-mail: [email protected]
volume destinations such as the Douro valley and the Azores Islands, which have recently begun to gain increased international visibility. The number of guests and hotel stays continues to increase in a sustained way, as well as the number of hotels and available beds. Along with this favorable envi-ronment there is fierce competition for occupancy Introduction
In the last decade Portugal has become a prime destination for leisure and business travelers. Des-tinations such as Lisbon, the Algarve, Porto, or Madeira Island account for the large majority of tourists and overnight stays, in parallel with minor
CUSTOMER SATISFACTION IN PORTUGUESE HOTELS:
EVIDENCE FOR DIFFERENT REGIONS AND HOTEL SEGMENTS
LUÍS PACHECO
Department of Economics, Management and Computer Sciences, Universidade Portucalense, Porto, Portugal
Electronic word of mouth (eWOM) has gained importance with the emergence of new online tools, and the hospitality sector is at the core of this trend. We employ a secondary data set of hotel guest reviews from a popular online travel platform, with reviews for hotels located in the four main Por-tuguese tourism regions. We analyze the reviews in terms of overall satisfaction and for six specific attributes. Employing statistical tests and regression analysis we find that the “rooms,” “service,” and “cost–benefit” attributes show a greater correlation with overall satisfaction than other criteria, and those attributes are common across hotel segments and regions. The “location” and “cleanli-ness” attributes only appear as significant for some regions and hotel segments. For instance, the significance of “cleanliness” in lower segment hotels should merit the attention of hotel managers to allocate more resources to this. In relation to “rooms,” personal preferences and expectations may make it difficult to optimally upgrade rooms in order to satisfy a diverse clientele, whereas in regard to “service,” hotel managers across all hotel segments should prioritize staff training and service quality assessment tools in order to guarantee consistent levels of service.
Key words: Electronic word of mouth (eWOM); User-generated content; Hospitality; Satisfaction differences; Portugal
sample of Portuguese hotels has not been done before. This article aims to highlight the main attri-butes responsible for overall satisfaction, also evi-dencing some specific differences between those attributes’ relevance in terms of hotel segment or region.
Results of this article could be useful to hotel man-agers in resource allocation by identifying those factors that have greater impact on guests’ overall satisfaction. The next section presents a literature review and the subsequent sections present the data and methodology and the results. The fifth section is a discussion of the results and the article ends with concluding remarks.
Literature Review
Web 2.0 technologies have changed the ways users search for and share information, offering new ways of communication that enable users to share their opinions with all other users in an efficient, instanta-neous platform without time or geographical limita-tions. The influence of eWOM is directly applicable to tourism and hospitality because user-generated reviews are an important source of information for prospective travelers searching for independent eval-uations. Indeed, its influence is particularly high for experience goods such as in the hospitality and tour-ism context, because quality is only perceived after consumption (Lopes, Abrantes, & Kastenholz, 2014; Ye et al., 2009). Additionally, people tend to trust information more when it comes directly from other consumers, supposedly helping them to avoid inad-equate choices (Stringam, Gerdes, & Vanleeuwen, 2010; Ye, Law, Gu, & Chen, 2011). Research by Lu and Stepchenkova (2012) indicated that almost all respondents read online comments while planning their trips and they believe those online comments are more likely to contain updated, detailed, and trust-worthy information (see also Vermeulen & Seegers, 2009; Xiang & Gretzel, 2010; Yoo & Gretzel, 2008).
A particularly important issue for the hotel indus-try is that research indicates that people pay greater attention to criticisms or negative reviews than to positive reviews (Lee, Law, & Murphy, 2011; Sparks & Browning, 2011). Due to the increasing use of social media, online review platforms, and other user-generated content, there is a danger of consumers feeling flooded with information in an rates between hotels. Data from the National
Statis-tics Office (Instituto Nacional de Estatística [INE], 2016) show that in 2015 around 17.4 million guests checked in at different hotel units for a total of almost 48.9 million stays—more than 32 million of which were stays in hotels and 34.4 million were by nonresidents. Also in 2015, around 80% of all guest stays occurred in the four main tourism regions of Lisbon, the Algarve, Porto and North, and Madeira, which are analyzed in this article.
Online reviews, ratings or opinions are part of the electronic word-of-mouth (eWOM) phenomenon and have gained importance with the emergence of new technology and tools. Litvin, Goldsmith and Pan (2008) defined eWOM as “all informal communications directed at consumers through Internet-based technology related to the usage or characteristics of particular goods and services, or their sellers” (p. 3). Cantallops and Salvi (2014) stated that the main differences between WOM and eWOM can be identified in the reach of the reviews’ impact (number of people who can be influenced) and the speed of interaction.
Ratings and reviews can have a significant effect on hotel profitability, with several empirical articles evidencing that hotels with better reviews are capa-ble of obtaining higher revenues per room (e.g., Ye, Law, & Gu, 2009). The objective of this article is to study the impact of specific satisfaction attri-butes on overall satisfaction. Namely, the relation-ship between overall satisfaction and six attributes: location, sleep quality, rooms, service, value (cost– benefit), and cleanliness. The assumption is that guest ratings on different specific attributes largely determines their overall satisfaction. The study focuses on the quantitative ratings of each attribute, disregarding the guest’s subjective judgments in written comments (Jeong & Jeon, 2008; Limberger, Anjos, Meira, & Anjos, 2014; Limberger, Boaria, & Anjos, 2014).
Expanding the literature, this article also looks for evidence of significant differences between hotel segments and regions. To that purpose, it considers guests’ average rating of 534 hotel units located in four regions of Portugal. The data were obtained from one of the largest online travel platforms— TripAdvisor—where more than 160 new reviews are posted every minute (www.tripadvisor.com). The application of this methodology to a large
attributes with both overall guest satisfaction and return intentions.
Using the largest travel website in China, Ye et al. (2009) conducted a study to empirically inves-tigate the impact of online consumer-generated reviews on hotel room sales by tallying the number of reviews received on a travel website, which the authors consider to be a proxy of room sales. Their results indicated that positive online consumer reviews can significantly improve the business per-formance of hotels, with an increase of the variance in customer ratings diminishing hotel room ratings. Using the Expedia website, Stringam et al. (2010) studied the relationship between the overall satis-faction of guests with hotel services, the condition of hotels, cleanliness of rooms, and room comfort. Their study looked at over 60,000 traveler ratings, and the majority of all four quality ratings and over-all satisfaction were positive. Additionover-ally, nearly 75% of responses indicated willingness to recom-mend the hotel. These four category ratings have a similarly strong association with travelers’ overall rating and willingness to recommend. Partial corre-lations differ, with hotel service and room comfort being the highest, followed by hotel condition and room cleanliness.
Stringam and Gerdes (2010) evaluated 60,648 consumer ratings and comments from Expedia to determine what factors drive consumer ratings of hotels. Specifically, the article yielded information about the most frequently used words, as well as the pattern of word usage with either high or low guest ratings. It also explored the hotel guests’ choice of words when assigning lower ratings versus higher ratings. Lee et al. (2011) profiled guests who post helpful reviews on TripAdvisor. Their key finding was that helpful reviewers are those who travel more, actively post reviews, belong to any age and gender group, and give lower hotel ratings. Wilson et al. (2012) examined the influence of national-ity both on the motivation to post (or not) and on where and what type of content consumers share in the context of a recent trip. The method used was an online survey of 568 respondents located in Swit-zerland, the UK, and Spain, and the results revealed differences in national attitudes and motivations for posting. Respondents in Switzerland and the UK are more likely to post photos or travelogues on Facebook, but respondents from Spain prefer to post eWOM overload (Park & Lee, 2008). Another
con-cern is that it is difficult for a consumer to determine the credibility of a message coming from strang-ers. In regard to the fear of user-generated contents being jeopardized by fake comments made under the cover of anonymity, O’Connor (2010) argued that such fear is baseless because research has found little evidence of fake reviews, only residual cases. For this reason, many online intermediaries— including TripAdvisor—require reviewers to reg-ister and provide some additional personal infor-mation including name, residence, nationality, or gender (Jeong & Jeon, 2008; Xie, Miao, Kuo, & Lee, 2011).
Several authors have researched users’ motives to post reviews (Y. Huang, Basu, & Hsu, 2010; Wilson, Murphy, & Fierro, 2012; Zheng, Youn, & Kincaid, 2009). For instance, Zheng et al. (2009) suggested that negative experiences are more likely to motivate dissatisfied consumers to write reviews. Some research argues that there is an “inverted-U” relationship between customer satis-faction and the quantity of WOM or eWOM, as customers who are neither extremely satisfied nor unsatisfied share their experiences less (Litvin et al., 2008). Cantallops and Salvi (2014) presented a complete survey, reviewing articles on eWOM published in the 2007–2011 period, ending their article with some suggestions for future avenues of research on the subject. Those authors concluded that previous research can be grouped into two general lines of work: factors related to the genera-tion of comments and the impact those comments have on consumers and on company perspectives.
Some previous studies also used TripAdvisor or other sites as a source of data, collecting the data either manually or automatically (Gerdes & Stringam, 2008). For example, Jeong and Jeon (2008) ana-lyzed the consistency of posted reviews with the expected level of service and room rate. Using guests’ reviews of hotels in New York City posted on TripAdvisor, their results indicate that “value” is one of the key predictors for guest satisfaction, which leads to return intentions. Regardless of hotel segment and average daily rate (ADR), loca-tion appears to have the highest mean value among seven performance attributes and hotel segments (i.e., number of stars) and ADR appears to influ-ence the relationships of selected hotel performance
In the Portuguese context, only one previous study was identified on the characterization of customers using online review platforms. Chaves, Gomes, and Pedron (2012) collected 1,500 online reviews from 50 small and medium Portuguese hotels from Book ing.com and TripAdvisor. Their study showed that room, staff, and location are the criteria that appear more frequently in the reviews, thus highlighting aspects that hotel managers should prioritize. Pre-viously, Carneiro and Costa (2000) looked at how service quality influenced the competitive position-ing of five-star hotels.
Although not specifically considered here, differ-ent cultural backgrounds lead to differdiffer-ent consump-tion concepts, perceived satisfacconsump-tion, and ratings (Ayoun & Moreo, 2008; Chen, Cheung, & Law, 2012; Li et al., 2013). There are several studies that focused on the relationship between cultural factors and personality traits with hotel reviews and ratings (Hsieh & Tsai, 2009; J. Huang, Huang, & Wu, 1996; Tse & Ho, 2009; Yoo & Gretzel, 2011, among others, or Schuckert, Liu, & Law, 2015a, for a literature review).
In sum, from the analysis of guests’ reviews or comments the literature identifies the following set of relevant variables: room, comfort, service, cleanli-ness, value, location, and facilities. This exploratory article follows and develops the articles from Chaves et al. (2012), Jeong and Jeon (2008), Li et al. (2013), Limberger, Anjos et al. (2014) Limberger, Boaria et al. (2014), O’Connor (2010), and Stringam et al. (2010), employing a sample of 534 Portuguese hotels in order to identify the most important determinants of overall satisfaction and considering differences in terms of location and hotel segments. Thus, the two main research questions that this article tries to answer in the following sections are:
Are there significant differences in average rat-1.
ings between hotel segments and regions? What are the main determinants of overall sat-2.
isfaction in global terms, and also in terms of hotel segments and regions?
Data and Methodology
The data used in this study were retrieved man-ually from TripAdvisor after permission was granted. TripAdvisor has a mechanism that enables users on TripAdvisor with the goal of making
recommen-dations to other travelers. Li, Ye, and Law (2013) analyzed the content of 42,668 online reviews from 774 hotels, showing on one hand that transport facil-ities, food and beverage management, proximity to tourism destinations, and amount paid are the most valued factors, independently of the hotel segment. On the other hand, customers are less satisfied with the bed, reception desk services, room decoration, and size. In particular, the authors showed that 97% of the satisfaction variance can be explained by only four variables: room, value, cleanliness, and check in/out. The authors concluded that individu-als from different countries have diverse reasons to post comments, so hotel managers should consider those behavioral differences.
Considering both the content of reviews and the volume of eWOM in a broad sample of 16,680 hotels, Melián-González, Bulchand-Gidumal, and López-Valcárcel (2013) found a relationship between valence (positive vs. negative posts) and volume, in that initial hotel reviews tend to be disproportion-ately negative. As hotels receive more reviews the average ratings improve and the standard deviation declines, which means there is a greater agreement in ratings and the negative effects are mitigated. One implication of their study is that hotel man-agers should try to increase the number of reviews they receive to balance the positive and negative opinions about their property. Limberger, Anjos et al. (2014) also studied the correlation between overall satisfaction and the evaluation criteria used on TripAdvisor, analyzing 660 reviews for overall satisfaction, value, location, sleep quality, rooms, cleanliness, and service. Applying a method of multivariate analysis, their results showed a strong correlation of overall satisfaction with the room, service provided, and location.
Finally, a recent article by Jiang, Gretzel, and Law (2014) analyzed English-speaking traveler reviews posted on TripAdvisor about hotels in Mainland China. The authors compared brand image across hotel types and star rating levels, finding that brand image can vary based on specific hotel character-istics, emphasizing different areas of service. For instance, the authors found that a certain star level does not necessarily imply a predetermined type of review, a feature that highlights the importance of distinguishing ratings between star levels.
Yi = β0 + β1 X1i + β2 X2i + β3 X3i + β4 X4i
+ β5 X5i + β6 X6i + εi (1) (i = 1, . . . , n)
Yi—dependent variable (overall satisfaction) β—coefficients to estimate
Xi— independent or explanatory variables (loca-tion, quality of sleep, rooms, service, cost– benefit, and cleanliness)
εi—error term
Prior to the regression, some descriptive statis-tics are computed (means, standard deviations, and correlations), and to better understand the main characteristics of the sample statistical tests to ana-lyze effects size and the presence of differences in mean ratings across regions and hotel segments are performed.
Results
Table 2 presents the means and standard devia-tions of the different reviews, in both global terms and in terms of hotel ranking and region.
Table 3 presents the Spearman’s rank correlation coefficients between general satisfaction and the different attributes for different regions.
To test the first research question a t test was performed in order to determine whether there are significant differences in means for the differ-ent attributes across differdiffer-ent regions, which com-prises a total of six combinations. Table 4 shows the results for the four regions, differentiating between attributes. Because the t test needs to consider an assumption regarding the equality of variances or not, previous to this test it was tested whether the different pairs presented equal variances in order to perform the appropriate test for differences in means. to input reviews for their hotel stays and share
experiences, posting classifications from 1 (very unsatisfied/terrible) to 5 (very satisfied/excellent).
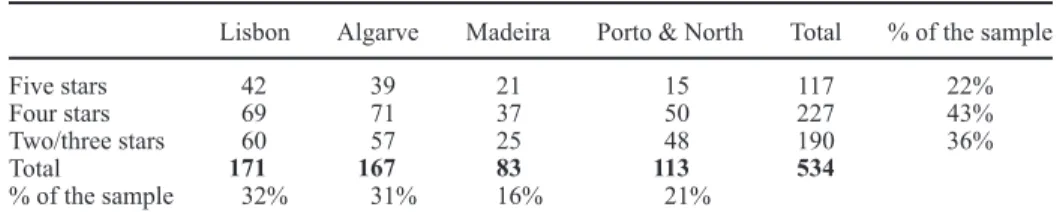
These scores represent eWOM in a straightforward manner. In February 2016 TripAdvisor presented reviews for over 1,000 Portuguese hotels and simi-lar units, distributed in different categories. Because only hotels with more than 50 reviews are consid-ered, the number of hotels analyzed was fewer, par-ticularly in the lower segments, resulting in a final sample of 534 hotels, distributed in three categories and four regions, and encompassing a total of over 285,000 reviews (Table 1).
This sample is considered adequate because the Lisbon and Algarve regions each have a weight of around 30%, a value close to their national weight in terms of the number of stays, guests, and rev-enues (INE, 2016). As for the two other regions, the national numbers also show that Madeira attracts around 15% of stays, guests, and revenues, with that percentage being slightly higher for Porto and the North region. Concerning the distribution by segments (according to the number of stars in the official classification system), the sample reflects a higher preponderance of four-star hotels and a rela-tively lower number of five-star hotels.
This article analyzes the overall satisfaction as well the six specific ratings (location, quality of sleep, rooms, service, cost–benefit, cleanliness). Regression analysis is used to understand key predicting attri-butes of guests’ overall satisfaction. In terms of meth-odology it is employed an OLS regression, assuming a linear relation between the dependent variable and a set of explanatory variables (Gujarati, 2003).
The functional relation between the depen-dent variable and the independepen-dent variables is the following:
Table 1 Data Set
Lisbon Algarve Madeira Porto & North Total % of the sample
Five stars 42 39 21 15 117 22%
Four stars 69 71 37 50 227 43%
Two/three stars 60 57 25 48 190 36%
Total 171 167 83 113 534
% of the sample 32% 31% 16% 21%
Note. Hotels classified from five to two stars according to the official classification system. Data
Table 2
Means and Standard Deviations (SD)
Overall Satisfaction Location Quality of Sleep Rooms Service Cost–Benefit Cleanliness Total 4.11 (0.45) 4.26 (0.47) 4.19 (0.42) 4.10 (0.50) 4.25 (0.40) 4.14 (0.34) 4.38 (0.40) Five stars 4.47 (0.31) 4.42 (0.42) 4.56 (0.25) 4.51 (0.32) 4.55 (0.30) 4.25 (0.26) 4.65 (0.26) Four stars 4.17 (0.36) 4.27 (0.46) 4.24 (0.32) 4.17 (0.35) 4.27 (0.33) 4.15 (0.32) 4.44 (0.32) Two/three stars 3.83 (0.45) 4.16 (0.47) 3.91 (0.42) 3.76 (0.50) 4.03 (0.39) 4.06 (0.37) 4.15 (0.44) Lisbon 4.12 (0.48) 4.30 (0.49) 4.24 (0.42) 4.09 (0.53) 4.26 (0.43) 4.14 (0.36) 4.42 (0.44) Algarve 4.09 (0.45) 4.21 (0.46) 4.13 (0.45) 4.10 (0.49) 4.18 (0.39) 4.10 (0.32) 4.33 (0.40) Madeira 4.13 (0.49) 4.34 (0.38) 4.17 (0.45) 4.11 (0.55) 4.31 (0.42) 4.19 (0.36) 4.42 (0.42) Porto & North 4.13 (0.39) 4.22 (0.48) 4.24 (0.34) 4.09 (0.41) 4.27 (0.32) 4.16 (0.30) 4.39 (0.33)
Note. n = 534 (total) according to Table 1.
Table 3
Correlations Between General Satisfaction and Attributes
Location Quality of Sleep Rooms Service Cost–Benefit Cleanliness
Total 0.41*** 0.79*** 0.85*** 0.82*** 0.67*** 0.76*** Five stars 0.35*** 0.57*** 0.66*** 0.73*** 0.59*** 0.64*** Four stars 0.32*** 0.70*** 0.77*** 0.77*** 0.68*** 0.65*** Two/three stars 0.43*** 0.78*** 0.84*** 0.79*** 0.76*** 0.78*** Lisbon 0.45*** 0.85*** 0.89*** 0.85*** 0.68*** 0.79*** Algarve 0.35*** 0.76*** 0.83*** 0.86*** 0.70*** 0.75*** Madeira 0.63*** 0.82*** 0.87*** 0.85*** 0.81*** 0.80***
Porto & North 0.28** 0.71*** 0.79*** 0.70*** 0.50*** 0.69***
Note. n = 534 (total) according to Table 1.
**p < 0.01; ***p < 0.001.
Table 4
t Test and p Values for Differences in Review Ratings Between Regions and Hotel Segments
Overall
Satisfaction Location
Quality
of Sleep Rooms Service Cost–Benefit Cleanliness
Lisbon vs. Algarve 0.51 0.08 0.01* 0.88 0.07 0.34 0.06
Lisbon vs. Madeira 0.92 0.56 0.20 0.77 0.38 0.30 0.91
Lisbon vs. Porto & North 0.80 0.16 0.93 0.99 0.80 0.52 0.58
Algarve vs. Madeira 0.53 0.03* 0.48 0.85 0.02* 0.06 0.09
Algarve vs. Porto & North 0.38 0.88 0.02* 0.87 0.03* 0.11 0.17
Madeira vs. Porto & North 0.92 0.06 0.24 0.76 0.48 0.63 0.56
Five stars vs. four stars 0.00*** 0.00** 0.00*** 0.00*** 0.00*** 0.00** 0.00***
Five stars vs. two/three stars 0.00*** 0.00*** 0.00*** 0.00*** 0.00*** 0.00*** 0.00*** Four stars vs. two/three stars 0.00*** 0.01* 0.00*** 0.00*** 0.00*** 0.01** 0.00*** *p < 0.05; **p < 0.01; ***p < 0.001.
As discussed below, the results give evidence for overall satisfaction consistent with the six explana-tory variables. In addition to the results presented above, Table 7 summarizes the significant variables influencing overall satisfaction in the different hotel segments and regions considered.
Discussion
As can be seen in Table 2, mean ratings decrease with lower hotel rankings as expected, indicating that the popularity index coincides with the hotel star segment. Although not presented in Table 2, this trend appears in all regions with the excep-tion of “cost–benefit” for the two- and three-star hotels located in the Porto and North region. Also, hotels located in the Algarve tend to present lower ratings in terms of overall satisfaction and almost Notice that a parametric test was used, because after
computing the Doornik–Hansen test it was found that more than half of the data series followed a normal distribution. Table 4 also presents the results for the t test while differentiating between hotel segments, comprising three combinations.
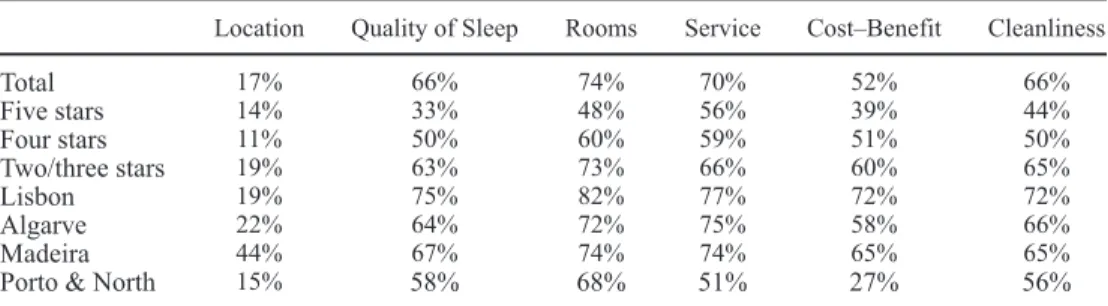
Before the OLS regression an effects–size anal-ysis was performed, computing the eta-squared statistic. Eta-squared can be defined as the propor-tion of variance associated with or accounted for by each of the main effects, interactions, and error in an ANOVA study (Tabachnick & Fidell, 2001) (Table 5).
Table 6 presents the results for the OLS regres-sion for the entire sample and the three hotel seg-ments, followed by Table 7, summarizing the most important attributes in terms of the different regions across hotel segments.
Table 5
Effects–Size Analysis: Eta-Squared (η2) for General Satisfaction Versus Attributes
Location Quality of Sleep Rooms Service Cost–Benefit Cleanliness
Total 17% 66% 74% 70% 52% 66% Five stars 14% 33% 48% 56% 39% 44% Four stars 11% 50% 60% 59% 51% 50% Two/three stars 19% 63% 73% 66% 60% 65% Lisbon 19% 75% 82% 77% 72% 72% Algarve 22% 64% 72% 75% 58% 66% Madeira 44% 67% 74% 74% 65% 65%
Porto & North 15% 58% 68% 51% 27% 56%
Note. n = 534 (total) according to Table 1. ANOVA results are always significant.
Table 6
Regression Results
Entire Sample Five-Star Hotels Four-Star Hotels Two/Three-Star Hotels
Coefficient Coefficient Coefficient Coefficient
Constant −0.5839*** −0.4752 −0.4266 −0.5399** Location 0.0839*** 0.0504 0.0732* 0.1210*** Quality of sleep 0.1171*** 0.0143 0.0924 0.144* Rooms 0.3448*** 0.3249*** 0.3070*** 0.3473*** Service 0.2929*** 0.4545*** 0.2935*** 0.1616** Cost–benefit 0.1377*** 0.1653* 0.1774** 0.1734** Cleanliness 0.1416*** 0.0894 0.1406** 0.1540** R2 0.84 0.72 0.73 0.83 R2 adjusted 0.83 0.70 0.73 0.82 F 395.20*** 56.12*** 92.65*** 131.90***
Note: Robust standard errors (HC1). VIFs consistent with the absence of multicollinearity. *p < 0.05; **p < 0.01; ***p < 0.001.
hotel segments it is evident that higher star-rated hotels had more favorable guest perceptions than their lower counterparts.
As evidenced by Table 5, the eta-squared statis-tic presents relatively high values, with consistently significant ANOVA results for general satisfaction. A large part of the total variance in general satisfac-tion is explained by the different attributes, in par-ticular, “rooms” and “service.” In terms of regions, “location” is a major determinant in the Madeira region, while all the other attributes are more important in the Lisbon region and less important in the Porto and North region.
As evident in Table 6, the great majority of explan-atory variables are significant and the R2 is always between 72% and 84%, meaning that a large part of overall satisfaction variance is explained by the con-sidered set of attributes, thus answering the second research question and also confirming the results of Limberger, Anjos et al. (2014), Limberger, Boaria et al. (2014), and Stringam et al. (2010). Notice that the results do not appear to present multicollinear-ity problems, because the different variance infla-tion factors (VIF) are always in the 1.3–4.3 range, with an average of 2.65. Considering the entire sample, it is observed that all attributes are sig-nificant, albeit with higher coefficients for “rooms” and “service.” For instance, a one point upgrade in the “rooms” rating has an impact of 0.35 in the global rating. For the five-star hotels there are only three significant attributes: “rooms,” “service,” and “cost–benefit.” These three variables seem to be of greater relevance because they also are significant for the other hotel segments. Notice that the “loca-tion” and “cleanliness” attributes seem to be more relevant for lower segment hotels, possibly due to the fact that those hotels are located far from the all specific attributes, particularly “service” and
“cleanliness,” a fact that should deserve closer attention by hotel managers. Because all the ratings increase from lower to superior hotel segments this finding suggests, as expected, that five-star hotel guests enjoy higher satisfaction levels, with sat-isfaction decreasing in lower segment hotels (two and three stars). Notice that this decreasing rate is higher in the Madeira region. Confirming the results from Schuckert, Liu, and Law (2015b), Table 2 also shows that, in general, lower segment hotels are more likely to generate a greater dispersion in rat-ings in comparison to the values presented for five-star hotels. Although not presented, that behavior is particularly present in the Algarve region, followed by Lisbon and Madeira. Finally, comparing the dis-persion between regions the results seem to present a greater cohesion, with the Porto and North region presenting lower values. In terms of correlations between attributes, Table 3 evidences that they are all significant and positive, presenting values around the 0.3–0.8 range.
Testing for differences in review ratings (Table 4) answers the first research question, evidencing that there are not significant differences in means, except with three attributes involving hotels located in the Algarve. That is, there seems to be some significant differences in Algarve hotels, not in terms of over-all satisfaction but in terms of “location,” “quality of sleep,” and “service.” Those differences could be explained by the characteristics of Algarve tour-ism, traditionally seen as a sea and sun destination with crowded hotels in the summer months. On the other hand, as expected, there are significant dif-ferences between hotel segments, either in terms of overall satisfaction or in terms of all six specific attributes. As ratings clearly differentiate between Table 7
Most Determinant Attributes
Hotel Segment Lisbon Algarve Madeira Porto & North
Total Rooms, service Rooms, service, cost–
benefit, cleanliness
Location, rooms, service Location, quality of sleep, rooms, cleanliness
Five stars Rooms, service Service, cost-benefit None None
Four stars Rooms, service Rooms, service, cleanliness Location, rooms, service Location, cost–benefit Two/three stars Location, quality of sleep,
rooms, cost–benefit
Location, rooms, service, cost–benefit
None Rooms
Note. Only the most significant variables for each regression are presented. R2 values between 0.65 and 0.90. VIFs consistent with the absence of multicollinearity.
seems relevant to overall satisfaction and deserving of more attention from hotel managers. Thus, the “service” attribute contributes to hotel differentia-tion and rating. It is also important to note that “loca-tion” does not show the strongest correlation with overall satisfaction in any of the cases. Exceptions are hotels on Madeira Island where location appears relevant, perhaps due to the island topography, which increases a hotel’s distance to the city center or the sea. Limberger, Anjos et al. (2014) and Limberger, Boaria et al. (2014) also stressed that location does not seem to be relevant to overall satisfaction, albeit being an influential factor when choosing a hotel. The “rooms” attribute is almost always present, showing that it is independent of the hotel segment and region, and room size, decoration, and moder-nity are major determinants of overall satisfaction. The significance of “cleanliness” in lower segment hotels should merit the attention of hotel managers to allocate more resources to this.
Conclusion
This study contributes to the hospitality literature by identifying the most significant attributes deter-mining overall satisfaction for a large sample of Por-tuguese hotels, distributed in three quality segments and four regions. Only were selected hotels located in four different regions with a sufficient number of reviews, so the results have some limitations in terms of generalization for other regions or coun-tries. This study uniquely attempts to identify how consistent guests’ perceptions of hotel performance are related with hotel segment and region through their reviews on TripAdvisor. Thus, the article is of an exploratory nature, presenting some limita-tions that should be surpassed in future research. (1) Because this study evaluates secondary data from TripAdvisor, issues related to the integrity of guests’ reviews and the lack of control in data col-lection could compromise its conclusions. It is pos-sible that some reviews are biased—coming from the hotel itself, from competitors, or simply from a “virtual” guest. Future research should identify the impact of biased comments. (2) This study is quantitative—it considers only the general classi-fications posted by different users without analyz-ing the words used in each post (a semantic content analysis), which could provide additional relevant main attractions (e.g., city center or the sea), with
limited access to public transport and with lower standards in terms of cleanliness (confirming the results from Stringman & Gerdes, 2010). Naturally, a hotel cannot readily change its location, but it can assist guests in using public transport or provide a shuttle service.
The results are similar in terms of hotel segments across different regions (Table 7), with the “rooms” and “service” attributes appearing as significant in several occasions and with coefficients around 0.4. Thus, “rooms” and “service” seem to be the key predictor of guests’ satisfaction in Portugal, fol-lowed by “cost–benefit” and “location.” In terms of hotel segments, “service” is more important in four- and five-star hotels, being absent in two-star hotels, whereas “rooms” are more important for the two-, three-, and four-star hotel guests. For five-star hotels a one point upgrade in the “service” rating has an impact of 0.45 in overall satisfaction, mean-ing that those hotels must maintain their high stan-dards in terms of service in order to maintain their positioning advantage. In terms of regions, Lisbon ratings are better explained by the “rooms” and “service” attributes, whereas in the Algarve “ser-vice” and “cost–benefit” seem to be more impor-tant regardless of the hotel segment, which may be explained by the fact that leisure guests give more importance to price than business guests. Notice that the three smaller subsamples associated with Madeira and Porto and North hotels (samples with less than 25 hotels) did not allow identification of significant attributes across some hotel segments. Nevertheless, “location” and “rooms” appear in sev-eral occasions and “service” seems less important in the Porto and North region.
These results have implications for hospitality management because they highlight the most impor-tant determinants of overall satisfaction ratings. The “rooms,” “service,” and “cost–benefit” attributes show a greater correlation with overall satisfac-tion than other criteria, corroborating the results from Jeong and Jeon (2008), Limberger, Anjos et al. (2014), Limberger, Boaria et al. (2014), and Stringam et al. (2010). For instance, the importance of “service” confirms the findings from Carneiro and Costa (2000), who analyzed Portuguese five-star hotels, noticing that “service” includes aspects such as service efficiency and staff attitude, which
Regarding “service,” hotel managers across all hotel segments should prioritize staff training and service quality assessment tools in order to guaran-tee consistent levels of service. On the other hand, constant attention to “cleanliness” (in particular, in the lower segment hotels and hotels located in Algarve) and minor improvements in transporta-tion services to and from the city center (in par-ticular with hotels located on Madeira Island) could potentially upgrade hotel ratings.
It is advisable for hotel managers to regularly visit hotel review sites such as TripAdvisor or oth-ers to glean industry-wide trends from guest voices. Reviews of guests’ comments or user-generated feedback can help hotel managers to improve ser-vice quality from the wealth of data provided, trans-lating that into higher ratings and visibility and, potentially, higher occupancy rates and revenues.
References
Ayoun, B., & Moreo, P. (2008). Does national culture affect hotel managers’ approach to business strategy.
Interna-tional Journal of Contemporary Hospitality Manage-ment, 32(1), 52–65.
Cantallops, A., & Salvi, F. (2014). New consumer behavior: A review of research on eWOM and hotels. International
Journal of Hospitality Management, 36, 41–51.
Carneiro, M. J., & Costa, C. (2000). The influence of service quality on the positioning of five star hotels—the case of the Lisbon area. Journal of Quality Assurance in
Hospi-tality & Tourism, 1(4), 1–19.
Chaves, M., Gomes, R., & Pedron, C. (2012). Analyzing reviews in the web 2.0: Small and medium hotels in Por-tugal. Tourism Management, 33(5), 1286–1287. Chen, R., Cheung, C., & Law, R. (2012). A review of the
literature on culture in hotel management research: What is the future? International Journal of Hospitality
Man-agement, 31(1), 52–65.
Gerdes, J., & Stringam, B. (2008), Addressing researchers’ quest for hospitality data: Mechanism for collecting data from web resources. Tourism Analysis, 13, 309–315. Gujarati, D. (2003). Basic econometrics (4th ed.). Boston,
MA: McGraw-Hill.
Hsieh, A., & Tsai, C. (2009). Does national culture really matter? Hotel service perceptions by Taiwan and Ameri-can tourists. International Journal of Culture, Tourism
and Hospitality Research, 3(1), 54–69.
Huang, J., Huang, C., & Wu, S. (1996). National character and response to unsatisfactory hotel service. International
Journal of Hospitality Management, 15(3), 229–243.
Huang, Y., Basu, C., & Hsu, M. (2010). Exploring moti-vations of travel knowledge sharing on social network sites: An empirical investigation of U.S. college students. information. In their written posts guests may show
significant differences in satisfaction concerning those attributes, because each review normally has descriptions that are likely to include valuable information that can give further explanations for a particular rating. A deeper analysis would also allow understanding why some hotels have more customer reviews than others. (3) The different importance of attributes may depend on the type of guests, their gender, age, cultural background, and other variables. For instance, business travel-ers and leisure traveltravel-ers may show differences in ratings because their expectations regarding room comfort, quality of sleep, or service are probably different. The same applies for guests of differ-ent ages, so it is important to study that issue in greater depth and characterize the review writers. (4) Finally, only reviews from TripAdvisor were used. It would be of great interest to conduct a com-parative study among different hotel review sites in order to cross-validate hotel performance from guests’ perspectives. This issue is especially rel-evant because different nationalities likely tend to use different services, as happens with nearly every service on the internet.
This study contributes to better management of hotels, identifying which evaluation criteria used by guests are more strongly correlated with (and explain) overall satisfaction. It confirms the results from Stringman et al. (2010), showing that the high correlation between attributes and overall satisfac-tion supports previous research in service quality management, which argues that the perceptions of parts of the service delivery are closely related to overall perception. Thus, hotel managers should not ignore any of the attributes. These findings provide hotel managers with an understanding of guest’s perceptions of hotel performance by hotel segment and region and in relation to TripAdvisor’s popularity index, showing which performance attri-butes contribute most to guest satisfaction. Some areas are identified where small improvements and investments could make a difference in terms of rating and bring a competitive advantage. On one hand, the greatest gains to overall satisfaction seem to be explained by the “rooms” and service” attri-butes. Concerning the first, personal preferences and expectations may make it difficult to optimally upgrade rooms in order to satisfy a diverse clientele.
Schuckert, M., Liu, X., & Law, R. (2015b). A segmentation of online reviews by language groups: How English and non-English speakers rate hotels differently. International
Journal of Hospitality Management, 48, 143–149.
Sparks, B., & Browning, V. (2011). The impact of online reviews on hotel booking intentions and perception of trust. Tourism Management, 32(6), 1310–1323. Stringam, B., & Gerdes, J. (2010). An Analysis of
word-of-mouse ratings and guest comments of online hotel distribution sites. Journal of Hospitality Marketing and
Management, 19(7), 773–796.
Stringam, B., Gerdes, J., & Vanleeuwen, D. (2010). Assess-ing the importance and relationships of ratAssess-ings on user-generated traveler reviews. Journal of Quality Assurance
in Hospitality & Tourism, 11(2), 73–92.
Tabachnick, B., & Fidell, L. (2001). Using multivariate
sta-tistics (5th ed.). Upper Saddle River, NJ: Pearson Allyn
& Bacon.
Tse, E., Ho, S. (2009). Service quality in the hotel industry when cultural contexts matter. Cornell Hospitality
Quar-terly, 50(4), 460–474.
Vermeulen, I., & Seegers, D. (2009). Tried and tested: The impact of online hotel reviews on consumer consider-ation. Tourism Management, 30, 123–127.
Wilson, A., Murphy, H., & Fierro, J. (2012). Hospitality and travel: The nature and implications of user-generated content. Cornell Hospitality Quarterly, 53(3), 220–228. Xiang, Z., & Gretzel, U. (2010). Role of social media in
online travel information search. Tourism Management,
31(2), 179–188.
Xie, H., Miao, L., Kuo, P.-J., & Lee, B.-Y. (2011). Consum-ers’ responses to ambivalent online hotel reviews: The role of perceived source credibility and pre-decisional disposition. International Journal of Hospitality
Man-agement, 30, 178–183.
Ye, Q., Law, R., & Gu, B. (2009). The impact of online user reviews on hotel room sales. International Journal of
Hospitality Management, 28, 180–182.
Ye, Q., Law, R., Gu, B., & Chen, W. (2011). The influence of user-generated content on traveler behavior: An empiri-cal investigation on the effects of eword-of-mouth to hotel online bookings. Computers in Human Behavior,
27(2), 634–639.
Yoo, K.-H., & Gretzel, U. (2008). Use and impact of online travel reviews. In P. O’Connor, W. Hopken, & U. Gretzel (Eds.), Information and communication technologies in
tourism 2008 (pp. 35–46). Vienna, Austria: Springer.
Yoo, K.-H., & Gretzel, U. (2011). Influence of personality on travel-related consumer-generated media creation.
Computers in Human Behavior, 27(2), 609–621.
Zheng, T., Youn, H., & Kincaid, C. (2009). An analysis of customers’ e-complaints for luxury resort properties.
Journal of Hospitality Marketing and Management, 18(7),
718–729.
Journal of Hospitality Marketing and Management, 19(7), 717–734.
Instituto Nacional de Estatística. (2016). Destaque:
Mer-cados externos reforçam crescimento na hotelaria no final do ano. Retrieved from https://www.ine.pt/xportal/
xmain?xpid=INE&xpgid=ine_destaques&DESTAQ UESdest_boui=224623705&DESTAQUESmodo=2&xl ang=pt
Jeong, M., & Jeon, M. (2008). Customer reviews of hotel experiences through consumer generated media (CGM).
Journal of Hospitality and Leisure Marketing, 17(1–2),
121–138.
Jiang, J., Gretzel, U., & Law, R. (2014). Influence of star rat-ing and ownership structure on brand image of mainland China hotels. Journal of China Tourism Research, 10(1), 69–94.
Lee, H., Law, R., & Murphy, J. (2011). Helpful reviewers in TripAdvisor, an online travel community. Journal of
Travel and Tourism Marketing, 28(7), 675–688.
Li, H., Ye, Q., & Law, R. (2013). Determinants of customer satisfaction in the hotel industry: An application of online review analysis. Asia Pacific Journal of Tourism
Research, 18(7), 784–802.
Limberger, P., Anjos, F., Meira, J., & Anjos, S. (2014). Satis-faction in hospitality on TripAdvisor.com: An analysis of the correlation between evaluation criteria and overall sat-isfaction. Tourism & Management Studies, 10(1), 59–65. Limberger, P., Boaria, F., & Anjos, S. (2014). A relação entre
a satisfação geral e as variáveis da satisfação na hotelaria em hotéis de excelência. Revista Brasileira de Pesquisa
em Turismo, 8(3), 435–455.
Litvin, S., Goldsmith, R., & Pan, B. (2008). Electronic word-of-mouth in hospitality and tourism management.
Tourism Management, 29, 458–468.
Lopes, R., Abrantes, J., & Kastenholz, E. (2014). Innova-tion, tourism and social networks. Revista Turismo e
Desenvolvimento, 21/22, 151–154.
Lu, W., & Stepchenkova, S. (2012). Ecotourism experiences reported online: Classification of satisfaction attributes.
Tourism Management, 33(3), 702–712.
Melián-González, S., Bulchand-Gidumal, J., & López- Valcárcel, B. (2013). Online customer reviews of hotels: As participation increases, better evaluation is obtained.
Cornell Hospitality Quarterly, 54(3), 274–283.
O’Connor, P. (2010). Managing a hotel’s image on Trip Advisor. Journal of Hospitality Marketing and
Manage-ment, 19(7), 754–772.
Park, D., & Lee, J. (2008). eWOM overload and its effect on consumer behavioral intention depending on consumer involvement. Electronic Commerce Research and
Appli-cations, 7(4), 386–398.
Schuckert, M., Liu, X., & Law, R. (2015a). Hospitality and tourism online reviews: Recent trends and future directions.