Maria Bernardes André
Development and optimization of an
UPLC-MS/MS method for the simultaneous detection
and quantification of 14 antihypertensive drugs in
human urine samples
Dissertação do 2º Ciclo de Estudos Conducente ao Grau de Mestre em Toxicologia Analítica Clínica e Forense
DISSERTAÇÃO DE MESTRADO REALIZADA SOB A ORIENTAÇÃO DE: Professora Doutora Renata Sofia Araújo da Silva
COORIENTAÇÃO DE:
Doutora Maria Paula Amaral Alegria Guedes de Pinho
DE ACORDO COM A LEGISLAÇÃO EM VIGOR, NÃO É PERMITIDA A REPRODUÇÃO DE QUALQUER PARTE DESTA DISSERTAÇÃO.
The present dissertation had the important collaboration of GENERIS Farmacêutica, S. A. and of Atlantic Pharma, S.A.. I hereby acknowledge Drª Sofia Queirós, current quality control manager of GENERIS Farmacêutica, S. A. for the readiness in providing amlodipine besilate, bisoprolol fumarate, irbesartan, lisinopril dihydrate, candesartan cilexetil, captopril, enalapril maleate, indapamide, losartan potassium, nebivolol hydrochloride, ramipril, furosemide and atenolol. I also thank Drª Ana Sofia Alves from the quality control department of Atlantic Pharma, S.A. whom has provided the standards chlorthalidone, hydrochlorothiazide, telmisartan, carvedilol, valsartan, lercanidipine and perindopril.
Publications
Fernando Moreira, Renata Silva, Maria B André, Paula G Pinho, Maria L Bastos, João Ruivo, Patrícia Ruivo, Helena Carmo. Quantification of doping compounds in racing pigeons, by liquid chromatography-tandem mass spectrometry, submitted for publication
Acknowledgments
Esta dissertação é o culminar do mestrado, o 1º objetivo de vida por mim traçado há largos anos. Agradeço assim a todos os que, de alguma forma, contribuíram para o desenvolvimento deste trabalho e que têm estado presentes ao longo deste percurso.
Começo por dirigir o meu maior agradecimento à Dra. Renata, a quem mais quero agradecer, todos os dias. Não tenho palavras para descrever o quão gratificante é poder trabalhar com alguém com tamanha sabedoria e dedicação, tão focada e tão espetacular. Renata, um obrigado gigante pelo seu acompanhamento, pela motivação que me transmitiu, obrigada por tudo o que me ensinou, obrigada pela confiança que depositou em mim, obrigada pela paciência, obrigada pelo entusiamo com o meu trabalho. É uma orientadora exemplar e eu não podia ter tido mais sorte.
À Drª. Paula, que desde o início do desenvolvimento deste trabalho se mostrou totalmente disponível para qualquer esclarecimento e respondeu sempre às solicitações com apreço, obrigada por ter coorientado este trabalho e pela sua disponibilidade.
Ao Engº. Ginja, que incansavelmente me ajudou nas piores fases do desenrolar do trabalho experimental, agradeço o apoio desmedido e sem horários, e tudo o que me transmitiu sobre o nosso aparelho de UPLC-MS/MS.
Ao professor Fernando, primeiro orientador deste projeto, agradeço a oportunidade que me deu para desenvolver o meu trabalho numa área da investigação que tanto me aprece. Obrigada pela preocupação demostrada ao longo dos últimos dois anos e por tudo o que me ensinou.
Agradeço à professora Maria de Lurdes Bastos, diretora do Curso de Mestrado em Toxicologia Analítica Clínica e Forense, pela dedicação com que lida com os estudantes e os seus assuntos. O mestrado correspondeu às minhas expectativas e foi sem dúvida uma mais-valia para o meu percurso académico, onde se trataram temáticas de elevado interesse científico e contactei com um corpo docente de excelência.
Ao Fernando, que me integrou no seu projeto e com quem partilhei muitas horas de trabalho laboratorial. Foi muito gratificante partilhar esta experiência contigo.
Aos amigos com quem tenho partilhado o gabinete e espaços de trabalho no Laboratório de Toxicologia da FFUP, Patrícia, Bárbara, Jorge, Daniela, Maria, Bárbara F., Daniela R., Filipa, Margarida e Sofia, estes dois anos não teriam sido o mesmo sem vocês. Obrigada por toda a ajuda e palavras de apoio, por todos os momentos de descontração e sobretudo pela amizade.
Aos restantes elementos do Laboratório de Toxicologia, agradeço as palavras de motivação e preocupação ao longo do ano.
A quem de mais importante levo do meu percurso académico, à Joyce, à Marta, à Carolina, ao João, ao Zé, ao Belele, à Ana, ao Malibu, à Teté e à Joana, adoro que tenhamos passado de reuniões de amigos a jogar Trivial Persuit para lab-meetings (agora que seremos maioritariamente mestres podemos voltar aos jogos de tabuleiro). Apesar das distâncias geográficas a que nos vamos tendo que sujeitar, espero que possamos continuar a crescer juntos e a ajudarmo-nos como temos vindo a fazer tão bem. E agradeço ao que nos juntou: QBQ, não, não há igual!
À Joyce, à Carolina e ao João, obrigada por saberem lidar tão bem comigo, saberem sempre o que penso, o que quero e não quero, mesmo quando eu própria não sei. Obrigada pelo apoio nas horas de crise, pelas pausas, pela ajuda até de madrugada no laboratório… pela presença. Obrigada por fazerem tudo por mim.
Às amigas que menos percebem o que é a Toxicologia mas percebem tudo de sushi, festa e amizade, e por isso é que vos agradeço, Rafaela, Tati, Diana, Maria João, Maria, Cláudia, Filipa, Mafalda, Catarina e Joana, pelos momentos em que tenho, forçosamente, que limpar a cabeça, esquecer o trabalho e simplesmente divertir-me.
Aos Amigos Pedro, Tomás, Gil, Chico e Mi, espero ser velhinha e continuar a rir-me às gargalhadas com tudo o que falamos, fazemos e vivemos, como tem sido ao longo da última década.
Agradeço em especial à Mi e ao Chico, cuja luta contra o monstro Harrison já dura há tempo de mais, mas deu-me um jeitaço. Obrigada meus queridos pelas horas, dias, semanas, meses, anos de companhia de estudo intensivo e focado, e mais que isso, pelos minutos, horas, dias, semanas, meses, anos de risota, choro, brincadeira, seriedade, passeio e apoio. Vocês são uma inspiração! “Note to self: You gotta do this for you. This is for you. This isn't about anybody. Live for you. Honor you. Never lose sight of that.” Nota para nós no fim de Novembro: Well done, musketeers!
Aos animadores e amigos “Rabpeixinhos”, com quem partilhei a experiência de animar a colónia de férias para as crianças de Rabo de Peixe, durante o período de desenvolvimento da tese, agradeço o apoio e incentivo durante os 15 dias que estivemos na ilha, são espetaculares e não trocava esse tempo por nada. Agradeço em especial à Joana, à Marta e à Mariana e o entusiamo e interesse constante para com o meu trabalho durante todo o ano.
À Nícia, pelo companheirismo, amizade e ajuda nos 2 anos de mestrado. É das pessoas com maior sabedoria e conhecimento em diversas áreas que conheço e é gratificante ter conhecido alguém assim e poder partilhar tantos momentos com ela.
Ao pai, que estando longe, vai compreendendo que o trabalho não permite visitas mais regulares e vai conseguindo dar o apoio e a ajuda precisas com prontidão.
À mãe, a quem devo tudo o que sou hoje. Particularizando os últimos dois anos, sem o seu apoio incondicional e extraordinário não teria sido capaz. Obrigada, és a melhor do mundo!
Ao Avô Viriato, detentor das palavras mais sábias do mundo e dos abraços mais apertados. Como escreveste no meu 1º livro de dedicatórias do ensino básico, “não estudes para tirar boas notas, estuda para saber”. Podes sorrir, assim o fiz.
Abstract
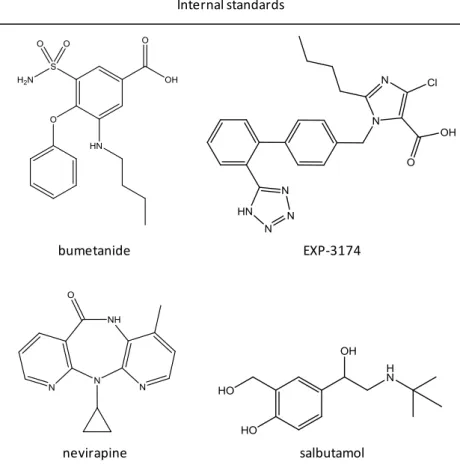
A rapid and selective ultra performance liquid chromatographic - tandem mass spectrometry (UPLC-MS/MS) method has been developed and optimized for the simultaneous determination of fourteen of the most commonly prescribed pharmaceutical drugs for the treatment of hypertension in Portugal: one diuretic [indapamide (IND)], three β-adrenergic antagonists [bisoprolol (BIS), nebivolol (NEB) and carvedilol (CAR)], four angiotensin-II receptor antagonists [losartan (LOS), irbesartan (IRB), valsartan (VAL) and telmisartan (TEL)], four angiotensin-converting enzyme inhibitors [perindopril (PER), ramipril (RAM), lisinopril (LIS) and enalaprilat (ENAL)] and two calcium channel blockers [amlodipine (AML) and lercanidipine (LER)] in human urine samples. Chromatographic analysis, mass chromatography detection and extraction procedures were optimized. Chromatographic separation was achieved within fifteen minutes on an UPLC Xbridge® BEH C18 reversed phase XP column (with 2.1 x 100 mm internal diameter and 2.5 µm particle size) connected to a guard column containing the same stationary phase (Xbridge®), and using a mobile phase consisting of 0.1 % formic acid in water and 0.1 % formic acid in acetonitrile, in gradient elution mode with flow rate set at 0.3 mL.min-1. Detection was performed using an electrospray ionization (ESI) source in positive mode on a triple quadrupole tandem mass spectrometer and analysis was conducted in a multiple reactions monitoring (MRM) mode. Three different internal standards (IS) were selected for instrumental fluctuations correction: EXP-3174 for IRB, TEL, PER, AML and LER, nevirapine for BIS and bumetanide for IND, NEB, CAR, LOS, VAL, RAM and ENT. The method demonstrated to be selective for the compounds under study and, after final validation, it will be applied for the analysis of urine samples from 200 patients under medication with antihypertensive drugs in order to check potential non-adherence to therapy.
Resumo
Desenvolvimento e otimização de um método rápido e seletivo de cromatografia líquida de ultra eficiência-tandem espetrometria de massa (UPLC-MS/MS) para a determinação simultânea de catorze dos fármacos antihipertensores mais prescritos em Portugal: um diurético [indapamida (IND)], três bloqueadores dos recetores adrenérgicos β [bisoprolol (BIS), nebivolol (NEB) e carvedilol (CAR)], quatro antagonistas dos recetores da angiotensina II [losartan (LOS), irbesartan (IRB), valsartan (VAL) e telmisartan (TEL)], quatro inibidores da enzima de conversão da angiotensina [perindopril (PER), ramipril (RAM), lisinopril (LIS) e enalaprilato (ENAL)] e dois bloqueadores dos canais de cálcio [amlodipina (AML) e lercanidipina (LER)] em amostras de urina humana. Os processos de análise cromatográfica, de deteção por espetrometria de massa e de extração foram optimizados. A separação cromatográfica foi conseguida em quinze minutos usando uma coluna Xbridge® BEH C18 de fase reversa XP de UPLC (com diâmetro interno de 2,1 x 100 mm e tamanho de partícula de 2,5 µm) ligada a uma pré-coluna contendo a mesma fase estacionária (Xbridge®), e com uma fase móvel constituída por 0,1 % de ácido fórmico em água (A) e 0,1 % de ácido fórmico em acetonitrilo (B), com eluição em gradiente e fluxo a 0,3 mL.min-1. A deteção foi realizada usando uma fonte de electrospray (ESI) no modo positivo num espectrómetro de massa tandem triplo quadrupolo e a análise foi conduzida no modo de monitorização de reações múltiplas (MRM). Três padrões internos diferentes foram selecionados para corrigir flutuações instrumentais: EXP-3174 para os fármacos IRB, TEL, PER, AML e LER, nevirapina para o BIS e bumetanida para os restantes IND, NEB, CAR, LOS, VAL, RAM e ENT. O método demostrou ser seletivo para a análise dos compostos em estudo e, após a validação final, será aplicado na análise de amostras de urina de 200 pacientes, alegadamente medicados com fármacos antihipertensores, para verificar a potencial não-adesão à terapia.
Palavras-chave: fármacos antihipertensores; UPLC-MS/MS; otimização do método; urina
Graphical Abstract
ANTIHYPERTENSIVE DRUG COLECT HUMAN URINE SAMPLESDEVELOPMENT and
OPTIMIZATION of
an UPLC-MS/MS
METHOD
for theanalysis of 14 antihypertensive drugs in human urine
Optimization of CHROMATOGRAPHIC and MASS DETECTION
parameters Optimization of a LIQUID-LIQUID EXTRACTION procedure METHOD VALIDATION SCREENING and QUANTIFICATION in urine samples from 200 patients CHECK FOR
NON-ADHERENCE TO ANTIHYPERTENSIVE
Index
Publications ... vii
Acknowledgments ... ix
Abstract ... xiii
Resumo ... xv
Graphical Abstract ... xvii
Index ... xix
Index of figures ... xxiii
Index of tables ... xxxi
Abbreviations ... xxxv
1.
Introduction ... 3
1.1.
Introduction to hypertension ... 3
1.2.
Conditions that cause hypertension ... 4
1.3.
Resulting diseases and numbers ... 6
1.4.
Treatment... 7
1.4.1.
Diuretics ... 9
1.4.2.
β-adrenergic antagonists ... 11
1.4.3.
Angiotensin II receptor antagonist ... 12
1.4.4.
Angiotensin-converting enzyme inhibitors ... 14
1.4.5.
Calcium channel blockers ... 15
1.4.6.
Pharmacokinetic characteristics ... 16
1.5.
Resistant hypertension ... 22
1.6.
Non-adherence ... 23
1.7.
Urine analysis ... 25
1.7.1.
GC-MS versus LC-MS ... 26
1.7.2.
Internal standards ... 26
Chapter 2 | Aims ... 29
Chapter 3 | Materials and Methods ... 33
3.
Materials and methods ... 35
3.1.
Chemicals and reagents ... 35
3.2.
Equipment and instrumentation ... 35
3.3.
Urine samples ... 36
3.4.
Development of an analysis and quantification methodology for
antihypertensive drugs ... 37
3.4.1.
Standard solution preparation... 37
3.4.2.
Sample preparation and extraction procedure ... 38
3.5.
Method validation ... 39
3.5.1.
Selectivity ... 40
3.5.2.
Linearity of calibration curve and sensitivity ... 40
3.5.3.
Detection and quantification limits ... 41
3.5.4.
Accuracy ... 41
3.5.5.
Precision
(repeatability,
intermediate
precision
and
reproducibility) ... 42
3.5.5.1.
Repeatability - Intra-day precision of the equipment and
method
... 43
3.5.5.2.
Intermediate precision - Inter-day precision of the equipment
and method
... 43
3.5.6.
Robustness... 44
3.5.7.
Recovery ... 44
3.5.8.
Stability ... 45
3.5.9.
Proof of applicability ... 45
3.6.
Statistical analysis ... 46
4.
Results and Discussion ... 49
4.1.
Mass detection optimization ... 49
4.1.1.
Direct infusion - Cone voltage and collision energy ... 49
4.1.2.
Direct infusion - Product ions and their chemical structures .... 51
4.2.
Chromatographic conditions optimization ... 77
4.2.2.
Cone
voltage
and
collision
energy
optimization
by
UPLC-MS/MS ... 84
4.3.
Internal standard selection ... 85
4.3.1.
Preliminary study ... 87
4.4.
Extractive procedure optimization ... 91
4.4.1.
Acid or base extraction optimization ... 92
4.4.2.
Solvent selection ... 102
4.4.3.
Extractive behavior in spiked human urine samples ... 104
4.4.4.
Internal
standard detection behavior
in
human
urine
samples
... 120
4.4.5.
Pre-centrifugation step ... 122
4.4.6.
Double extraction ... 124
4.4.7.
Final extractive procedure ... 125
4.5.
Pre-validation ... 127
4.5.1.
Selectivity ... 127
4.5.2.
Proof of applicability ... 136
5.
Conclusions ... 141
6.
Future perspectives... 145
7.
References ... 149
8.
Annexes ... 163
8.1.
Mobile phase and gradient optimization ... 163
8.2.
Cone
voltage
and
collision
energy
optimization
by
UPLC-MS/MS ... 165
Index of figures
Figure 1. Portugal mortality in 2014, adapted from “World Health Organization - Noncommunicable Diseases (NCD) Country Profiles, 2014”(WHO, 2014) ... 7 Figure 2. Molecules and their diuretic subfamilies with interest to this essay ... 11 Figure 3. β-adrenergic antagonist molecules with interest to this study ... 12 Figure 4. Angiotensin II receptor antagonist molecules with interest to this study. ... 13 Figure 5. Angiotensin-converting enzyme inhibitor molecules with interest to this study . 15
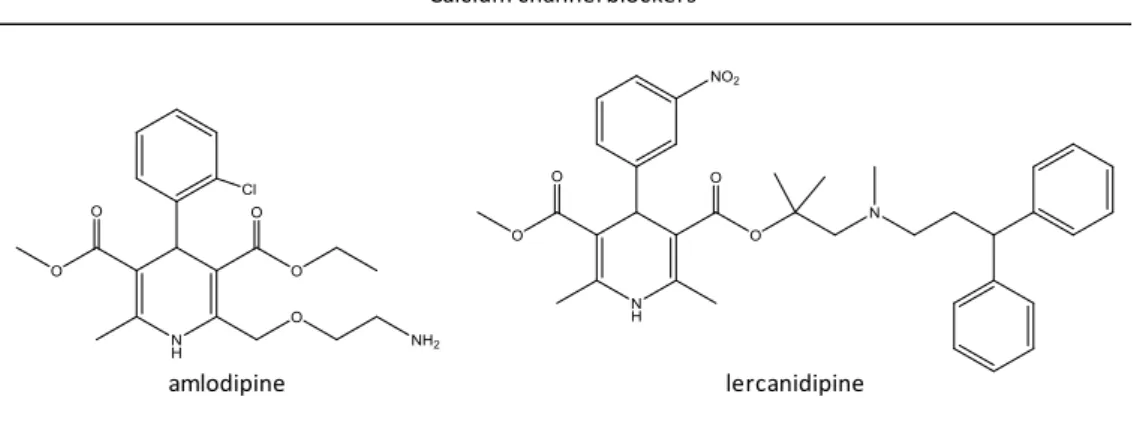
Figure 6. Calcium channel blocker molecules with interest to this study ... 16 Figure 7. Internal standards molecules used in this study ... 28
Figure 8. Mass spectrum of [M+H]+ of indapamide (10 μM in MeOH) [1 - m/z 366 - precursor ion] ... 52 Figure 9. Product ion mass spectrum of [M+H]+ of indapamide (10 μM in MeOH) [1 - m/z 366 (parent ion), 2 - m/z 132 (quantification ion)] ... 52 Figure 10. Mass spectrum of [M+H]+ of bisoprolol (10 μM in MeOH) [1 - m/z 326 (precursor ion)] ... 53 Figure 11. Product ion mass spectrum of [M+H]+ of bisoprolol (10 μM in MeOH) [1 - m/z 326 (precursor ion), 2 - m/z 116 (quantification ion), 3 - m/z 74, 4 - m/z 72] ... 53 Figure 12. Mass spectrum of [M+H]+ of nebivolol (10 μM in MeOH) [1 - m/z 406 (precursor ion)] ... 54 Figure 13. Product ion mass spectrum of [M+H]+ of nebivolol (10 μM in MeOH) [1 - m/z 407 (precursor ion), 2 - m/z 151 (quantification ion), 3 - m/z 123] ... 54 Figure 14. Mass spectrum of [M+H]+ of carvedilol (10 μM in MeOH) [1 - m/z 407 (precursor ion)] ... 55 Figure 15. Product ion mass spectrum of [M+H]+ of carvedilol (10 μM in MeOH) (1 - m/z 407 (precursor ion), 2 - m/z 100 (quantification ion), 3 - m/z 222, 4 - m/z 224] ... 55 Figure 16. Mass spectrum of [M+H]+ of atenolol (10 μM in MeOH) [1 - m/z 267 (precursor ion)] ... 56 Figure 17. Product ion mass spectrum of [M+H]+ of atenolol (10 μM in MeOH) [1 - m/z 267 (precursor ion), 2 - m/z 145 (quantification ion), 3 - m/z 74, 4 - m/z 72, 5 - m/z 56, 6 - m/z 190] ... 56
Figure 18. Mass spectrum of [M+H]+ of losartan (10 μM in MeOH) [1 - m/z 423 (precursor ion)]... 57 Figure 19. Product ion mass spectrum of [M+H]+ of losartan (10 μM in MeOH) (1 - m/z 423 (precursor ion), 2 - m/z 207 (quantification ion), 3 - m/z 139, 4 - m/z 307) ... 57 Figure 20. Mass spectrum of [M+H]+ of irbesartan (10 μM in MeOH) [1 - m/z 429 (precursor ion)] ... 58 Figure 21. Product ion mass spectrum of [M+H]+ of irbesartan (10 μM in MeOH) [1 - m/z 429 (precursor ion), 2 - m/z 207 (quantification ion), 3 - m/z 195] ... 58 Figure 22. Mass spectrum of [M+H]+ of valsartan (10 μM in MeOH) [1 - m/z 436 (precursor ion)] ... 59 Figure 23. Product ion mass spectrum of [M+H]+ of valsartan (10 μM in MeOH) [1 - m/z 436 (precursor ion), 2 - m/z 291 (quantification ion), 3 - m/z 235, 4 - m/z 306, 5 - m/z 362, 6 - m/z 207, 7 - m/z 352, 8 - m/z 418] ... 59 Figure 24. Mass spectrum of [M+H]+ of telmisartan (10 μM in MeOH) [1 - m/z 515 (precursor ion)] ... 60 Figure 25. Product ion mass spectrum of [M+H]+ of telmisartan (10 μM in MeOH) [1 - m/z
515 (precursor ion), 2 - m/z 276 (quantification ion), 3 - m/z 497, 4 - m/z 289, 5 - m/z 211] ... 60
Figure 26. Mass spectrum of [M+H]+ of perindopril (10 μM in MeOH) [1 - m/z 369 (precursor ion)] ... 61 Figure 27. Product ion mass spectrum of [M+H]+ of perindopril (10 μM in MeOH) [1 - m/z 369 (precursor ion), 2 - m/z 172 (quantification ion), 3 - m/z 170, 4 - m/z 98] ... 61 Figure 28. Mass spectrum of [M+H]+ of ramipril (10 μM in MeOH) [1 - m/z 417 (precursor ion)]... 62 Figure 29. Product ion mass spectrum of [M+H]+ of ramipril (10 μM in MeOH) [1 - m/z 417 (precursor ion), 2 - m/z 234 (quantification ion), 3 - m/z 343] ... 62 Figure 30. Mass spectrum of [M+H]+ of lisinopril (10 μM in MeOH) [1 - m/z 406 (precursor ion)]... 63 Figure 31. Product ion mass spectrum of [M+H]+ of lisinopril (10 μM in MeOH) [1 - m/z 406 (precursor ion), 2 - m/z 84 (quantification ion), 3 - m/z 246] ... 63 Figure 32. Mass spectrum of [M+H]+ of enalapril (10 μM in MeOH) [1 - m/z 377 (precursor ion)]... 64
Figure 33. Product ion mass spectrum of [M+H]+ of enalapril (10 μM in MeOH) [1 - m/z
377 (precursor ion), 2 - m/z 234 (quantification ion), 3 - m/z 303, 4 - m/z 130, 5 - m/z 160) ... 64
Figure 34. Mass spectrum of [M+H]+ of enalaprilat (10 μM in MeOH) [1 - m/z 349 (precursor ion)] ... 65 Figure 35. Mass fragmentation of [M+H]+ of enalaprilat and respective fragments [ m/z 117 (quantification ion) and m/z 206] ... 65 Figure 36. Mass spectrum of [M+H]+ of amlodipine (10 μM in MeOH) [1 - m/z 409 (precursor ion)] ... 66 Figure 37. Product ion mass spectrum of [M+H]+ of amlodipine (10 μM in MeOH) [1 - m/z 409 (precursor ion), 2 - m/z 238 (quantification ion), 3 - m/z 294) ... 66 Figure 38. Mass spectrum of [M+H]+ of lercanidipine (10 μM in MeOH) [1 - m/z 612 (precursor ion)] ... 67 Figure 39. Product ion mass spectrum of [M+H]+ of lercanidipine (10 μM in MeOH) [1 - m/z 612 (precursor ion), 2 - m/z 280 (quantification ion), 3 - m/z 100, 4 - m/z 315] ... 67 Figure 40. Mass spectrum of [M+H]+ of EXP-3174 (10 μM in MeOH) [1 - m/z 437 (precursor ion)] ... 68 Figure 41. Product ion mass spectrum of [M+H]+ of EXP-3174 (10 μM in MeOH) [1 - m/z 437 (precursor ion), 2 - m/z 235 (quantification ion), 3 - m/z 207] ... 68 Figure 42. Mass spectrum of [M+H]+ of nevirapine (10 μM in MeOH) [1 - m/z 267 (precursor ion)] ... 69 Figure 43. Product ion mass spectrum of [M+H]+ of nevirapine (10 μM in MeOH) [1 - m/z 267 (precursor ion), 2 - m/z 80 (quantification ion), 3 - m/z 198, 4 - m/z 226] ... 69 Figure 44. Mass spectrum of [M+H]+ of salbutamol (10 μM in MeOH) [1 - m/z 240 (precursor ion)] ... 70 Figure 45. Product ion mass spectrum of [M+H]+ of salbutamol (10 μM in MeOH) [1 - m/z 240 (precursor ion), 2 - m/z 148 (quantification ion), 3 - m/z 166, 4 - m/z 222] ... 70 Figure 46. Mass spectrum of [M+H]+ of bumetanide (10 μM in MeOH) [1 - m/z 365 (precursor ion)] ... 71 Figure 47. Mass fragmentation of [M+H]+ of bumetanide and respective fragments [m/z 184 (quantification ion) and m/z 240] ... 71
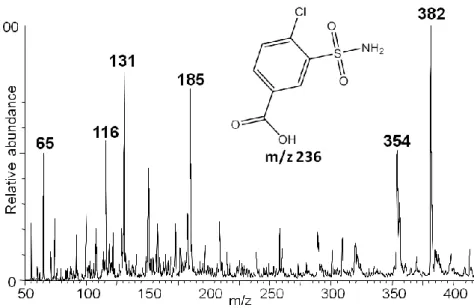
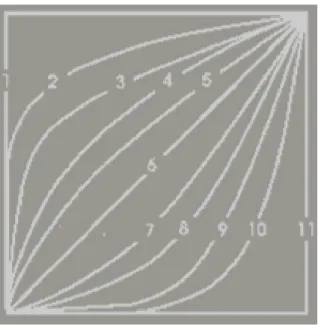
Figure 48. Mass spectrum of [M+H]+ of chlorthalidone (10 μM in MeOH) (expected precursor ion: m/z 337, major ion- m/z 361) ... 74 Figure 49. Mass spectrum of [M-H]- of chlorthalidone (10 μM in MeOH) [1 - m/z 337 (precursor ion)] ... 74 Figure 50. Mass spectrum of [M+H]+ of canrenone (10 μM in MeOH) (expected precursor ion: m/z 341, major ion - m/z 363) ... 75 Figure 51. Mass spectrum of [M+H]+ of candesartan (10 μM in MeOH) (expected precursor ion: m/z 441, candesartan cilexetil: m/z 611, major ion - m/z 363) ... 76 Figure 52. Mass spectrum of [M+H]+ of olmesartan (10 μM in MeOH) [expected precursor ion: m/z 447, olmesartan medoxomil (major ion): m/z 559] ... 76 Figure 53. Mass spectrum obtain from the direct infusion of 3-chloro-4-sulfamoylbenzoic acid (10 μM in MeOH) (m/z 236) and its chemical structure ... 77 Figure 54. Mass spectrum obtain from the direct infusion of captopril (10 μM in MeOH) (m/z 377) and its chemical structure... 77 Figure 55. Ramps (UPLC-MS/MS parameter) that determine the speed at which solvent composition and flow change over time, according to the selected number. 1 - Immediately goes to specified conditions, 2 to 5 - convex, 6 - linear, 7 to 10 - concave, 11 - maintains start condition until next step. ... 79 Figure 56. Overlapped chromatograms obtained from the analysis of individual stock solutions of 10 µM lisinopril (LIS), enalaprilat (ENT), nevirapine (NEV), bisoprolol (BIS), perindopril (PER), ramipril (RAM), carvedilol (CAR), amlodipine (AML), telmisartan (TEL), irbesartan (IRB), nebivolol (NEB), losartan (LOS), indapamide (IND), EXP-3174 (EXP), bumetanide (BUM), valsartan (VAL) and lercanidipine (LER) using a C18 reverse phase chromatographic column. ... 83 Figure 57. Zoomed image (run time from 0 to 8 min) of the chromatogram represented on Figure 56 ... 83 Figure 58. Chromatographic peaks intensities obtained after the extraction procedure under acidic and basic conditions for indapamide (IND), bisoprolol (BIS), nebivolol (NEB), carvedilol (CAR), amlodipine (AML) and lercanidipine (LER). The results are presented as mean with standard deviation (SD). ... 94 Figure 59. Chromatographic peaks intensities obtained after the extraction procedure under acidic and basic conditions for losartan (LOS), irbesartan (IRB), valsartan (VAL),
telmisartan (TEL), perindopril (PER), lisinopril (LIS), ramipril (RAM) and enalaprilat (ENT). The results are presented as mean with standard deviation (SD). ... 95 Figure 60. Chromatographic peaks intensities obtained after the extraction procedure under acidic and basic conditions for EXP-3174 (EXP), nevirapine (NEV) and bumetanide (BUM). The results are presented as mean with standard deviation (SD). ... 96 Figure 61. Chromatographic peaks intensities obtained after the extraction procedure under acidic and basic conditions for indapamide (IND), bisoprolol (BIS), nebivolol (NEB), carvedilol (CAR), amlodipine (AML) and lercanidipine (LER). The results are presented as mean with standard deviation (SD). ... 99 Figure 62. Chromatographic peaks intensities obtained after the extraction procedure under acidic and basic conditions for losartan (LOS), irbesartan (IRB), valsartan (VAL), telmisartan (TEL), perindopril (PER), lisinopril (LIS), ramipril (RAM) and enalaprilat (ENT). The results are presented as mean with standard deviation (SD). ... 100 Figure 63. Chromatographic peak intensities obtained after the extraction procedure under acidic and basic conditions for EXP-3174 (EXP), nevirapine (NEV) and bumetanide (BUM). The results are presented as mean with standard deviation (SD). ... 101 Figure 64. Recovery of indapamide (IND) and EXP-3174 (EXP) from human urine samples. Recovery percentage (%) of IND using EXP as instrumental internal standard (IS) and recovery (%) of EXP using IND as instrumental IS. ... 107 Figure 65. Recovery of bisoprolol (BIS) and nevirapine (NEV) from human urine samples. Recovery percentage (%) of BIS using NEV as instrumental internal standard (IS) and recovery (%) of NEV using BIS as instrumental IS. ... 108 Figure 66. Recovery of carvedilol (CAR), EXP-3174 (EXP) and bumetanide (BUM) from human urine samples. (A) Recovery percentage (%) of CAR using EXP as instrumental internal standard (IS) and recovery (%) of EXP using CAR as instrumental IS. (B) Recovery (%) of CAR using BUM as instrumental IS and recovery (%) of BUM using CAR as instrumental IS... 110 Figure 67. Recovery of losartan (LOS), EXP-3174 (EXP) and bumetanide (BUM) from human urine samples. (A) Recovery percentage (%) of LOS using EXP as instrumental internal standard (IS) and recovery (%) of LOS using EXP as instrumental IS. (B) Recovery (%) of LOS using BUM as instrumental IS and recovery (%) of BUM using LOS as instrumental IS... 112
Figure 68. Recovery of irbesartan (IRB) and EXP-3174 (EXP) from human urine samples. Recovery percentage (%) of IRB using EXP as instrumental internal standard (IS) and recovery (%) of EXP using IRB as instrumental IS. ... 113 Figure 69. Recovery of valsartan (VAL), EXP-3174 (EXP) and bumetanide (BUM) from human urine samples. (A) Recovery percentage (%) of VAL using EXP as instrumental internal standard (IS) and recovery of VAL using EXP as instrumental IS. (B) Recovery (%) of VAL using BUM as instrumental IS and recovery (%) of BUM using VAL as instrumental IS. ... 115 Figure 70. Recovery of ramipril (RAM), EXP-3174 (EXP) and bumetanide (BUM) from human urine samples. (A) Recovery percentage (%) of RAM using EXP as instrumental internal standard (IS) and recovery (%) of EXP using RAM as instrumental IS. (B) Recovery (%) of RAM using BUM as instrumental IS and recovery (%) of BUM using RAM as instrumental IS. ... 117 Figure 71. Recovery of lercanidipine (LER), EXP-3174 (EXP) and bumetanide (BUM) from human urine samples. (A) Recovery percentage (%) of LER using EXP as instrumental internal standard (IS) and recovery (%) of LER using EXP as instrumental IS. (B) Recovery (%) of LER using BUM as instrumental IS and recovery (%) of BUM using LER as instrumental IS. ... 119 Figure 72. Losartan (LOS) and internal standard bumetanide (BUM) chromatographic peak areas ratio in centrifuged real samples and in non-centrifuged real samples (B). Results are presented as mean with standard deviation (SD) and statistical comparison was performed using the Unpaired t-test with Welch correction. ... 123 Figure 73. Suggested final procedure for the extraction of antihypertensive drugs from human urine samples or spiked blank urine samples ... 126 Figure 74. Representative total ion current (TIC) chromatograms for the MRM transitions in the interval of time [retention time ± 2 min] determined for indapamide (IND) in spiked (10 μM) and blank human urine samples ... 128 Figure 75. Representative total ion current (TIC) chromatograms for the MRM transitions in the interval of time [retention time ± 2 min] determined for bisoprolol (BIS) in spiked (10 μM) and blank human urine samples ... 128 Figure 76. Representative total ion current (TIC) chromatograms for the MRM transitions in the interval of time [retention time ± 2 min] determined for nebivolol (NEB) in spiked (10 μM) and blank human urine samples ... 129
Figure 77. Representative total ion current (TIC) chromatograms for the MRM transitions in the interval of time [retention time ± 2 min] determined for carvedilol (CAR) in spiked (10 μM) and blank human urine samples ... 129 Figure 78. Representative total ion current (TIC) chromatograms for the MRM transitions in the interval of time [retention time ± 2 min] determined for losartan (LOS) in spiked (10 μM) and blank human urine samples ... 130 Figure 79. Representative total ion current (TIC) chromatograms for the MRM transitions in the interval of time [retention time ± 2 min] determined for irbesartan (IRB) in spiked (10 μM) and blank human urine samples ... 130 Figure 80. Representative total ion current (TIC) chromatograms for the MRM transitions in the interval of time [retention time ± 2 min] determined for valsartan (VAL) in spiked (10 μM) and blank human urine samples ... 131 Figure 81. Representative total ion current (TIC) chromatograms for the MRM transitions in the interval of time [retention time ± 2 min] determined for telmisartan (TEL) in spiked (10 μM) and blank human urine samples... 131 Figure 82. Representative total ion current (TIC) chromatograms for the MRM transitions in the interval of time [retention time ± 2 min] determined for perindopril (PER) in spiked (10 μM) and blank human urine samples... 132 Figure 83. Representative total ion current (TIC) chromatograms for the MRM transitions in the interval of time [retention time ± 2 min] determined for lisinopril (LIS) in spiked (10 μM) and blank human urine samples ... 132 Figure 84. Representative total ion current (TIC) chromatograms for the MRM transitions in the interval of time [retention time ± 2 min] determined for ramipril (RAM) in spiked (10 μM) and blank human urine samples ... 133 Figure 85. Representative total ion current (TIC) chromatograms for the MRM transitions in the interval of time [retention time ± 2 min] determined for enalaprilat (ENT) in spiked (10 μM) and blank human urine samples... 133 Figure 86. Representative total ion current (TIC) chromatograms for the MRM transitions in the interval of time [retention time ± 2 min] determined for amlodipine (AML) in spiked (10 μM) and blank human urine samples... 134 Figure 87. Representative total ion current (TIC) chromatograms for the MRM transitions in the interval of time [retention time ± 2 min] determined for lercanidipine (LER) in spiked (10 μM) and blank human urine samples... 134
Figure 88. Representative total ion current (TIC) chromatograms for the MRM transitions in the interval of time [retention time ± 2 min] determined for EXP-3174 (EXP) in spiked (10 μM) and blank human urine samples ... 135 Figure 89. Representative total ion current (TIC) chromatograms for the MRM transitions in the interval of time [retention time ± 2 min] determined for nevirapine (NEV) in spiked (10 μM) and blank human urine samples ... 135 Figure 90. Representative total ion current (TIC) chromatograms for the MRM transitions in the interval of time [retention time ± 2 min] determined for bumetanide (BUM) in spiked (10 μM) and blank human urine samples ... 136 Figure 91. Representative total ion current (TIC) chromatograms for the monitored transitions in the interval of time [retention time ± 2 min] determined for losartan (LOS) in medicated patient (real), blank human urine samples (blank) and blank urine samples spiked with 10 μM of all the antihypertensive drugs under study (spiked). ... 137
Index of tables
Table 1. Classification of the degree of hypertension according to WHO and ISH ... 4
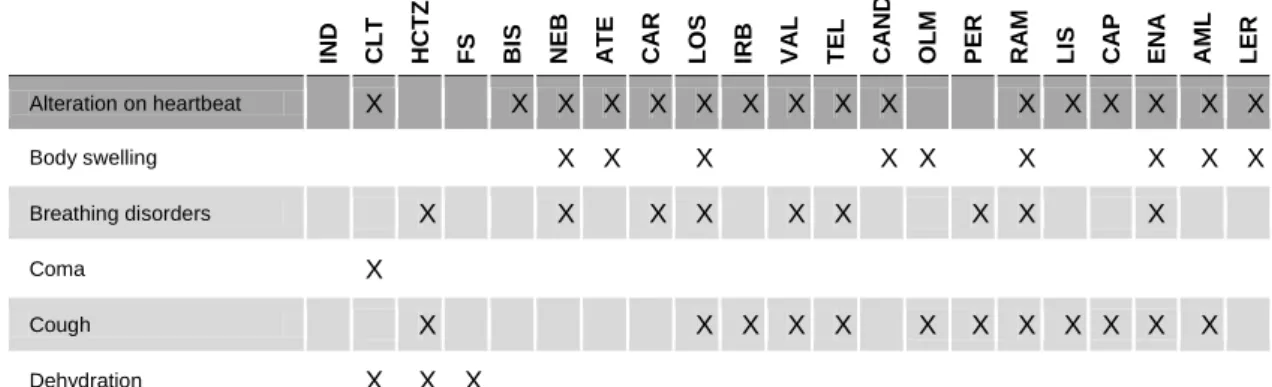
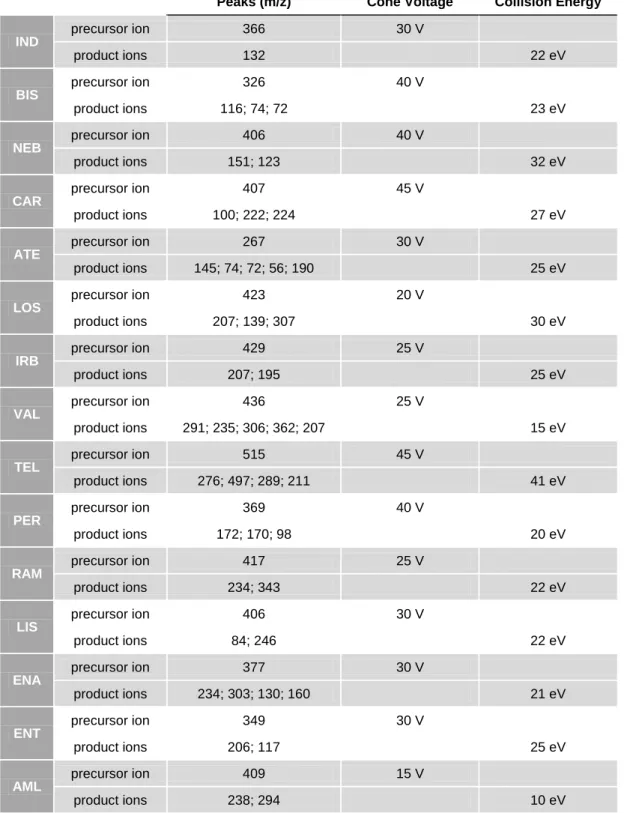
Table 2. Risk Factors for the development of hypertension ... 5 Table 3. Pharmacokinetic (PK) characteristics of indapamide (IND), chlorthalidone (CLT), hydrochlorothiazide (HCTZ), furosemide (FS) ... 18 Table 4. Pharmacokinetic (PK) characteristics of atenolol (ATE), bisoprolol (BIS), nebivolol (NEB) and carvedilol (CAR) ... 19 Table 5. Pharmacokinetic (PK) characteristics of losartan (LOS), irbesartan (IRB), valsartan (VAL), telmisartan (TEL), candesartan (CAN) and olmesartan (OLM) ... 20 Table 6. Pharmacokinetic (PK) characteristics of perindopril (PER), ramipril (RAM), lisinopril (LIS), captopril (CAP) and enalapril (ENA) ... 21 Table 7. Pharmacokinetic (PK) characteristics amlodipine (AML) and lercanidipine (LER)... 22 Table 8. Adverse effects resulting from the intake of the antihypertensive drugs with interest to this study ... 24 Table 9. Hypertensive volunteers features concerning their age, prescribed medication and dosage. ... 46 Table 10. Mass spectrometry (MS) conditions initially established by direct infusion and the obtained fragments for all the analyzed drugs ... 50 Table 11. Multiple-reaction monitoring (MRM) transitions (m/z) established for each compound and literature in accordance with the presented fragmentation patterns and/or fragment molecules ... 72 Table 12. Tested gradients to achieve optimal elution ... 79 Table 13. Indapamide (IND), bisoprolol (BIS), nebivolol (NEB), carvedilol (CAR), atenolol (ATE), losartan (LOS), irbesartan (IRB), valsartan (VAL), telmisartan (TEL), perindopril (PER), enalapril (ENA), lisinopril (LIS), ramipril (RAM), amlodipine (AML) and lercanidipine (LER) retention times (min) for every tested mobile phase gradient ... 81 Table 14. Enalaprilat (ENT), nevirapine (NEV), EXP-3174 (EXP), bumetanide (BUM) and salbutamol (SAL) retention times (min) with the chosen mobile phase gradient ... 82 Table 15. Optimal cone voltage and collision energy values for each analyzed precursor ion ... 85
Table 16. Mean, standard deviation (SD) and coefficient of variation (CV) percentage (%) values for the calculated ratios with the obtained chromatographic areas of every compound for the preliminary study of injection behavior of internal standards EXP-3174 (EXP), nevirapine (NEV) and bumetanide (BUM) ... 89 Table 17. Mean, deviation standard (SD) and coefficient of variation (CV) values for the obtained chromatographic peak areas for each compound using different solvents. EtOAc/EtOEt - ethyl acetate and diethyl ether, EtOEt - diethyl ether, CLF - chloroform, AcOEt - ethyl acetate ... 103 Table 18. Mean, standard deviation (SD), coefficient of variation (CV) percentage (%), mean recovery (REC) (%) and respective SD and CV (%) values for the calculated ratios with the obtained chromatographic peak areas for indapamide (IND) and the three internal standards EXP-3174 (EXP), nevirapine (NEV) and bumetanide (BUM) in experiments A, B and C ... 106 Table 19. Mean, standard deviation (SD), coefficient of variation (CV) percentage (%), mean recovery (REC) (%) and respective SD and CV (%) values for the calculated ratios with the obtained chromatographic peak areas for bisoprolol (BIS) and the three internal standards EXP-3174 (EXP), nevirapine (NEV) and bumetanide (BUM) in experiments A, B and C ... 108 Table 20. Mean, standard deviation (SD) and coefficient of variation (CV) percentage (%) for the calculated ratios with the obtained chromatographic peak areas for nebivolol (NEB) and the three internal standards EXP-3174 (EXP), nevirapine (NEV) and bumetanide (BUM) in experiments A and B ... 109 Table 21. Mean, standard deviation (SD), coefficient of variation (CV) percentage (%), mean recovery (REC) (%) and respective SD and CV (%) values for the calculated ratios with the obtained chromatographic peak areas for carvedilol (CAR) and the three internal standards EXP-3174 (EXP), nevirapine (NEV) and bumetanide (BUM) in experiments A, B and C ... 110 Table 22. Mean, standard deviation (SD), coefficient of variation (CV) percentage (%), mean recovery (REC) (%) and respective SD and CV (%) values for the calculated ratios with the obtained chromatographic peak areas for losartan (LOS) and the three internal standards EXP-3174 (EXP), nevirapine (NEV) and bumetanide (BUM) in experiments A, B and C ... 111
Table 23. Mean, standard deviation (SD), coefficient of variation (CV) percentage (%), mean recovery (REC) (%) and respective SD and CV (%) values for the calculated ratios with the obtained chromatographic areas for irbesartan (IRB) and the three internal standards EXP-3174 (EXP), nevirapine (NEV) and bumetanide (BUM) in experiments A, B and C ... 113 Table 24. Mean, standard deviation (SD) and coefficient of variation (CV) percentage (%) values for the calculated ratios with the obtained chromatographic peak areas for telmisartan (TEL) and the three internal standards EXP-3174 (EXP), nevirapine (NEV) and bumetanide (BUM) in experiments A and B ... 114 Table 25. Mean, standard deviation (SD), coefficient of variation (CV) percentage (%), mean recovery (REC) (%) and respective SD and CV (%) values for the calculated ratios with the obtained chromatographic peak areas for valsartan (VAL) and the three internal standards EXP-3174 (EXP), nevirapine (NEV) and bumetanide (BUM) in experiments A, B and C ... 114 Table 26. Mean, standard deviation (SD) and coefficient of variation (CV) percentage (%)values for the calculated ratios with the obtained chromatographic peak areas for perindopril (PER) and the three internal standards EXP-3174 (EXP), nevirapine (NEV) and bumetanide (BUM) in experiments A and B ... 116 Table 27. Mean, standard deviation (SD), coefficient of variation (CV) percentage (%), mean recovery (REC) (%) and respective SD and CV (%) values for the calculated ratios with the obtained chromatographic peak areas for ramipril (RAM) and the three internal standards EXP-3174 (EXP), nevirapine (NEV) and bumetanide (BUM) in experiments A, B and C ... 116 Table 28. Mean, standard deviation (SD) and coefficient of variation (CV) percentage (%) values for the calculated ratios with the obtained chromatographic peak areas for lisinopril (LIS) and the three internal standards EXP-3174 (EXP), nevirapine (NEV) and bumetanide (BUM) in experiments A and B ... 117 Table 29. Mean, standard deviation (SD) and coefficient of variation (CV) percentage (%) values for the calculated ratios with the obtained chromatographic peak areas for enalaprilat (ENT) and the three internal standards EXP-3174 (EXP), nevirapine (NEV) and bumetanide (BUM) in experiments A and B ... 118 Table 30. Mean, standard deviation (SD) and coefficient of variation (CV) percentage (%) values for the calculated ratios with the obtained chromatographic peak areas for amlodipine (AML) and the three internal standards EXP-3174 (EXP), nevirapine (NEV)
Table 31. Mean, standard deviation (SD), coefficient of variation (CV) percentage (%), mean recovery (REC) (%) and respective SD and CV (%) values for the calculated ratios with the obtained chromatographic areas for lercanidipine (LER) and the three internal standards EXP-3174 (EXP), nevirapine (NEV) and bumetanide (BUM) in experiments A, B and C ... 118 Table 32. Mean, standard deviation (SD) and coefficient of variation (CV) values for the obtained chromatographic peak areas ratios for each compound using different internal standards to correct injection errors ... 121 Table 33. Summarized results representing the internal standards (ISs) that can be used to correct injection fluctuations for each compound [bumetanide (BUM), EXP-3174 (EXP) and nevirapine (NEV)]. Results were obtained from IS selection preliminary study (section 4.3.1) and the present IS detection behavior in human urine samples experiment ... 122 Table 34. Losartan (LOS) and internal standard bumetanide (BUM) chromatographic peak areas ratio in pre-centrifuged real samples (A), in non-pre-centrifuged real samples (B) and in fortified blank urine samples with LOS at the final concentration of 20 μM (C) .... 123
Abbreviations
ACEi(s) Angiotensin-converting enzyme inhibitor(s) EtOAc Ethyl acetate
ACN Acetonitrile
AML Amlodipine
ARB(s) Angiotensin II receptor antagonist(s) AT1 type 1 angiotensin
ATE Atenolol BA Bioavailability β Beta BIS Bisoprolol BUM Bumetanide Ca2+ Calcium CAND Candesartan CAR Carvedilol CAP Captopril
CCB(s) Calcium channel blocker(s)
Cl- Chloride
CLF Chloroform
CLT Chlorthalidone
CV Coefficient of variation DMSO Dimethyl sulfoxide
ENA Enalapril
ENT Enalaprilat
ESI Electrospray ionization
EXP Losartan carboxylic acid / EXP-3174
FS Furosemide
GC-MS Gas chromatography coupled to mass spectrometry HCl Hydrochloric acid
HCTZ Hydrochlorothiazide
IHS International Society of Hypertension
IND Indapamide
ICH
International Conference on Harmonization
IRB Irbesartan
IS Internal Standard
K+ Potassium
L Liters
LC-MS/MS Liquid chromatography - tandem mass spectrometry
LER Lercanidipine
LIS Lisinopril
LLQ Liquid-liquid extraction LOD Limit of detection
LOS Losartan
LOQ Limit of quantification
MeOH Methanol
min Minutes
MRM Multiple reaction monitoring m/z Mass-to-charge ratio
N2 Nitrogen
Na+ Sodium
NaOH Sodium hydroxide
NCDs Noncommunicable diseases NE Non-extracted NEB Nebivolol NEV Nevirapine NH4 Ammonia OLM Olmesartan PER Perindopril PK Pharmacokinetics RAM Ramipril REC Recovery
rpm Rotation per minute
SAL Salbutamol
S/N Signal-to-noise ration SMC Smooth muscle cells
SD Standard deviation
S Slope
VD Volume of distribution
TIC Total ion current
TEL Telmisartan
t-PA Tissue plasminogen activator
UPLC Ultra performance liquid chromatography
VAL Valsartan
1. Introduction
1.1. Introduction to hypertension
The cardiovascular system comprises the heart, the blood pumped by the heart though the body and an organized system of vessels where the blood runs, called arteries, veins and capillaries. This system is responsible for the transport and tissue distribution of essential substances like nutrients, ions, gases and hormones; by the removal of metabolic products; and plays a role in the immune response and in the regulation of body temperature, pH and osmosis. In order for the blood to flow, the heart has to contract, which pushes the blood against the walls of the aorta artery. The created pressure follows-through the peripheral vessels till the blood is returned to the relaxed left ventricle (Seeley et al., 2003b).
The moment when the heart contracts and generates the highest pressure in blood vessels is called systolic blood pressure, and when the heart muscle relaxes, in between heartbeats, the lowest generated pressure, is called diastolic blood pressure. In a healthy adult these pressures are expected to be 120 mmHg and 80 mmHg, respectively. Fluctuations of these numbers can reach lower (under 100 and 60 mmHg, respectively) and higher (over 140 and 90 mmHg, respectively) values due to behavioral, metabolic and socioeconomic factors that are further explored on section 1.2. When systolic and/or diastolic pressure measurements are recorded as higher than 140 mmHg and 90 mmHg, respectively, for several days, at least twice a day, in stress-free conditions, the person may be diagnosed with hypertension (WHO, 2013).
Hypertension is, therefore, a cardiovascular disease that can be manifested as a sustained isolated systolic hypertension, as a sustained isolated diastolic hypertension or as a combination of both.
Isolated systolic hypertension is the most common among elderly people and is related with the pressure applied to the arteries when the heart contracts and pumps the blood into them, as described above. On the other hand, diastolic hypertension is associated with cardiac arrest: its mmHg value represents the pressure endured by the smooth muscle cells in between heartbeats. So, physiologically, it can be said that hypertension results either from the excessive constriction of the arteries or from the increased resistance of microvasculature (Kang, 2008).
According to the World Health Organization (WHO) and the International Society of Hypertension (ISH), hypertension can be divided into 3 degrees depending on the systolic
and diastolic levels, which can be classified as mild, moderate and severe (Table 1) (Borzecki et al., 2010, WHO-ISH, 1999).
Table 1. Classification of the degree of hypertension according to WHO and ISH
Systolic/ mmHg Diastolic/ mmHg
Mild hypertension 140 - 159 90 - 99
Moderate hypertension 160 - 179 100 - 109
Severe hypertension ≥ 180 ≥ 110
Hypertension is a major public health problem since most hypertensive individuals have no symptoms at all, and this disease often results in other severe health conditions or even death (further discussed on section 1.3). Those that do have symptoms cannot fully associate them to hypertension, since they can comprise multiple body systems, like headaches, dizziness, chest pain, shortness of breath and nose bleeds (WHO, 2013), unless the disease is already well-advanced and affecting vital organs like the brain, the heart and the kidneys. The severity of the problem is also due to the fact that hypertension has no cure, it is considered a chronic disease that needs to be controlled with medication and adopting a healthier lifestyle. Furthermore, it is considered the most common cardiovascular disease (Lurbe et al., 2009, Mancia et al., 2007, Michel and Hoffman, 2011, Poulter et al., 2015).
1.2. Conditions that cause hypertension
As stated before, the incidence of hypertension mainly depends on several risk factors, which influence one another, and can be divided in socioeconomic, behavioral and metabolic aspects that are summarized in Table 2. It is well clear that low income and poor living and working conditions prompt a stressful life and may trigger a self-destructive conduct with exaggerated alcohol consumption, tobacco usage, poor or lacking quality nourishment (ingestion of fat and salty food instead of fruit and vegetables), and physical inactivity. This harmful behavior can obviously interfere with the levels of several metabolic factors like diabetes mellitus, high cholesterol and excessive weight. All the listed conditions raise the likelihood of hypertension or other cardiovascular diseases (WHO, 2013).
The ingestion of high amounts of salty food and other exogenous substances like oral contraceptives containing estrogen may raise blood pressure. The first one deregulates the osmolality of the body fluid, which causes the organism to heighten water retention (increased blood volume induces hypertension in the arteries) (Reddy et al., 2015), and the second one leads to increased circulation levels of angiotensin II, an hormone that plays a major role in raising blood pressure through vasoconstriction, sympathetic nervous stimulation, increased aldosterone biosynthesis and renal actions (Fyhrquist et al., 1995).
Endogenous molecules like acetylcholine and other catecholamines, neurotransmitters that have receptors on the sympathetic ganglia system, activate adrenergic receptors on the smooth muscle cells, causing them to constrict (Seeley et al., 2003a).
Ageing is a major risk factor that, associated to the others or not, is most likely to result in hypertension due to the stiffening of blood vessels. Hereditary and pregnancy can also lead to the onset of the disease in younger people (WHO, 2013), as well as other conditions like sleep apnea, chronic kidney disease, primary hyperaldosteronism, Cushing's syndrome, steroid therapy, pheochromocytoma, aortic coarctation or thyroid and parathyroid diseases. These might be associated with hypertension in isolated cases but mostly (90%) there is no known cause to it (JSH, 2014, WHO, 1996).
Table 2. Risk Factors for the development of hypertension
Socioeconomic Behavioral Metabolic Other
Income Stress management Diabetes mellitus Exogenous substances Education Alcohol consumption High cholesterol Endogenous substances Living conditions Tobacco consumption Excessive weight Ageing
Working conditions Eating habits Genetics
Sedentary lifestyle Pregnancy
Preexisting diseases
Taking into account the listed factors that are in the origin of hypertension and the fact that it is a chronic disease, it is considered part of the noncommunicable diseases (NCDs) (WHO, 2017a), the group of medical conditions that are not caused by infectious agents. This group is mainly constituted by cardiovascular diseases, cancers, respiratory diseases and diabetes (WHO, 2016).
The regular measurement of blood pressure levels is therefore very important, particularly for those considered as part of a risk group: obese, sedentary, diabetic or smoking adults; those with a history of cardiovascular diseases in the family; and alcohol consumers, as listed above.
1.3. Resulting diseases and numbers
Hypertension is a worldwide concerning cardiovascular disease that affects about one billion people all over the world (Ghofrani et al., 2015), of which two millions are from Portugal (one fifth of total population from this country). Statistics also indicate that, per year, about 7.5 million hypertensive individuals die (Scher et al., 2015), often prematurely (WHO, 2013), mostly because this condition, when not controlled, is the primary risk factor for coronary artery disease, stroke, heart attack, congestive heart failure, renal chronic disease, myocardial infarction (Ghofrani et al., 2015), accelerated atherosclerosis (Kang, 2008), and can also lead to blindness and cognitive impairment (WHO, 2013). Uncontrolled elevated blood pressure may also result in the enlargement of the heart and aneurysms or weak spots in blood vessels, which propitiates the occurrence of clogs and bursts (WHO, 2013).
In 2015, 56 million deaths were reported worldwide, 70% of which caused by NCDs, value that accounts for 40 million fatalities. Nearly half of these lives, 17.7 million more precisely, were taken by cardiovascular diseases, and the accountability of the minority deaths pool is attributed to cancer, chronic respiratory diseases and diabetes, decreasingly (WHO, 2017b).
These numbers are very similar to those reported for the year of 2012, when 17.5 million people died from cardiovascular diseases (31% of all global deaths). Furthermore, in 2015 more than 1 in 5 adults worldwide had raised blood pressure (WHO, 2015).
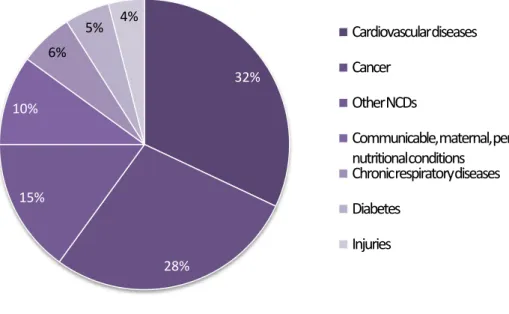
The latest reported data about the incidence of the disease in Portugal is from 2014, when total population was about 10 604 000 and 97 000 people died, 32% of which from cardiovascular diseases (Figure 1) (WHO, 2014).
Figure 1. Portugal mortality in 2014, adapted from “World Health Organization - Noncommunicable Diseases (NCD) Country Profiles, 2014”(WHO, 2014)
In 2013 it was estimated that raised blood pressure was taking the lives of nine million people every year (WHO, 2013), a number that is expected to raise till the year of 2025 (Poulter et al., 2015). Other study projected that global deaths caused by cardiovascular diseases would rise from 17.1 million in 2004 to 23.4 million in 2030, being that over 75% of all deaths will be owed to NCDs (WHO, 2008). Hypertension detection and treatment are, therefore, of huge importance worldwide.
1.4. Treatment
As it was aforementioned, there is no cure for hypertensive disorders, even though pharmacological treatment has increasingly been proven to accomplish good statistic numbers on cardiovascular morbidity and mortality in long-term considerations, being that it only keeps blood pressure levels from rising to abnormal values (Vega and Bisognano, 2014).
Once the diagnostic is made, the immediate action should be to assume an healthy and active lifestyle, with emphasis on the proper nutrition with low salt ingestion, and then, if hypertension persists, proper medication must be used to control the disease.
32% 28% 15% 10% 6% 5% 4% Cardiovascular diseases Cancer Other NCDs
Communicable, maternal, perinatal and nutritional conditions
Chronic respiratory diseases Diabetes
It is up to physicians to decide which antihypertensive drug is the most appropriate to each patient and, in some cases, combined medication might be needed.
Blood pressure drugs act on the peripheral resistance and/or in the cardiac output, promoting the removal of excessive salt and fluids from the body, relaxing or widening blood vessels and slowing the heartbeat (inhibition of myocardial contractility or impairment of ventricular filling pressure) (Michel and Hoffman, 2011, WHO, 2013). The combination of two antihypertensive drugs enhances the blood pressure-lowering effect of one another (Albishri et al., 2015, Bakheit et al., 2015).
Just as there is a risk of non-compliance to therapeutics, there is also the chance that individuals might ingest higher doses of antihypertensive drugs than the expected. This situation leads to exaggerated pharmacological effects, the most common being hypotension, which is revealed as the main cause of toxicity due to hypertensive drugs ingestion (Kang, 2008, Ramoska et al., 1993). Adverse effects are constantly mentioned as elevated for patients with renal insufficiency or diabetes (Hilal-Dandan, 2011, Reilly and Jackson, 2011).
According to the Portuguese National Authority of Medicines and Health Products (INFARMED) on-line therapeutic records (INFARMED, 2016), antihypertensive drugs can be divided into five main groups considering their primary site or mechanism of action:
Diuretics: thiazides and thiazide-like diuretics, loop diuretics, potassium-sparing diuretics, carbonic anhydrase inhibitors and osmotic diuretics;
Adrenergic activity depressants: non-selective α blockers, β-adrenergic antagonists and centrally acting α2 receptor agonists;
Renin-angiotensin axes modifiers: angiotensin II receptor blockers (ARBs, also known as angiotensin II receptor antagonists) , angiotensin-converting enzyme inhibitors (ACEIs) and renin direct inhibitors;
Calcium channel blockers (CCBs); Direct vasodilators.
Most diuretics, ACEIs, ARBs, β-adrenergic antagonists and CCBs are classified as first line medication, as they are the most frequently prescribed. Centrally acting α2
receptor agonists and vasodilators were part of the first generation of antihypertensive agents discovered, but are no longer part of the first line of treatment since they cause considerable side effects (DeRoos, 2011b). Moreover, they are no longer available in community pharmacies and the use of vasodilators is restricted to hospitals, like non-selective α blockers (INFARMED, 2016). Therefore, these three groups are of little interest in the framework of this document. Carbonic anhydrase inhibitors and osmotic diuretics will not be further discussed in this dissertation since they are not used as antihypertensive agents (DeRoos, 2011b).
The initial assessment to prescribe one or two antihypertensive drugs should be held between first line molecules - thiazide diuretics are preferred as initial therapy for most patients with mild hypertension (Chobanian et al., 2003). Furthermore, it has been stated that 90 % of mild to moderate hypertensive patients can control the disease by combining an ACEi with a CCB, a β-adrenergic antagonist or a diuretic (Hilal-Dandan, 2011). If there is a need to combine a third molecule, it will be one from the second line of treatment with proven effectiveness. Life quality issues like cost of the treatment and probable secondary effects must be taken into account when comparing these drugs since hypertension requires lifelong treatment (Michel and Hoffman, 2011).
1.4.1. Diuretics
Diuretics main site of action is the nephron cells, where they interfere with the regular activity of ionic transporters and pumps: urine becomes more diluted (Cowan, 2011), which results in increased flow rate (Albishri et al., 2015), and its content in sodium (Na+) increases. They can also meddle in the excretion of other ions, like potassium (K+) and calcium (Ca2+), and of uric acid. Since renal excretion of K+ can be amplified, diuretics activity may result in hypokalaemia, which, in heightened scenarios, leads to a certain risk of musculoskeletal disorders, cramps and cardiac arrhythmias (Reilly and Jackson, 2011).
Some of the adverse effects resulting from hyponatraemia (low plasmatic levels of Na+) are headaches, nauseas, vomiting, disorientation, seizures or even coma (Hoffman and Charney, 2011).
Toxicity associated with diuretics intake is rare and presents itself as discomfort of the gastrointestinal system, altered mental status, stimulation of diuresis, possible hypovolemia and, obviously, electrolyte abnormalities (mostly metabolic alkalosis), but very little cases of overdose have been reported despite the widespread use of these drugs (DeRoos, 2011b).
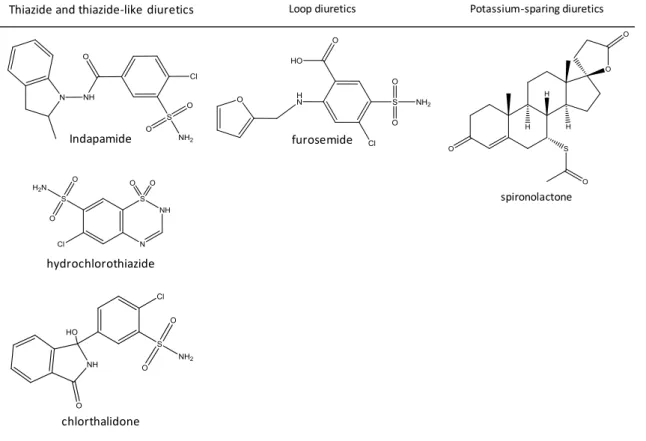
This family of antihypertensive drugs is subdivided into five groups, as stated before, but only three of them will be further discussed in this essay: thiazide and thiazide-like diuretics, loop diuretics and potassium sparing diuretics.
Thiazides owe their denomination to the fact that all of them are originated from the same molecule, benzothiadiazine. Those that are classified as thiazide-like do not have the common thiazide chemical structure but have similar mechanism of action. Their role in increasing the concentration of electrolytes in urine is based on the inhibition of Na+ and chloride (Cl-) uptake on the distal convoluted tubule (DeRoos, 2011b) by blocking
thiazide-sensitive Na+-Cl- co-transporter on the distal tubules, and by reducing peripheral vascular resistance (Ahmed et al., 2011). This group of diuretics is widely used because the comprised drugs are affordable, well-tolerated, have few contraindications, and have synergistic or additive outcomes when in combination with others (Reilly and Jackson, 2011). Indapamide (IND), chlorthalidone (CLT) and hydrochlorothiazide (HCTZ) are the thiazide and thiazide-like diuretics (INFARMED, 2016) studied in the scope of this dissertation (Figure 2).
To the family of loop diuretics belong the drugs that exercise their pharmacological activity in the thick ascending limb of the loop of Henle. Their activity is focused on blocking an homeostatic mechanism, called tubuloglomerular feedback, meaning that they prevent macula densa from sending constriction signals to the afferent arteriole when high concentrations of Na+, K+ and Cl- are leaving the loop of Henle. Thus, the amount of electrolytes present in the tubular fluid towards excretion is heightened (DeRoos, 2011b). Besides that, loop diuretics stimulate renin release and reduce the rate of excretion of uric acid. As it is expected, the abuse of these compounds might lead to serious depletion of Na+ on the body, causing glomerular filtration rate to decrease, circulatory collapse and thromboembolic events. Some adverse effects experienced by individuals who take this medication are rashes, photosensitivity, paresthesia, bone marrow depression and gastrointestinal disorders (Reilly and Jackson, 2011). Furosemide (FS) is the only loop diuretic (INFARMED, 2016) considered in this study (Figure 2).
When comparing to thiazide and thiazide-like diuretics, loop diuretics have little power capacity and shorter half-life times of excretion. These are the two main aspects that influence its little use (Reilly and Jackson, 2011).
Potassium-sparing diuretics exercise their effect on Na+ capillary reabsorption and, consequently, on the K+ secretion into the lumen of the collecting duct. These diuretics act either by blocking Na+ channels on the late distal tube and on the collecting duct or by antagonizing aldosterone activity (promotes Na+ reabsorption and increases the number of Na-K-ATPase pumps present on the membrane of the peritubular capillary). The electrolytic imbalance generated by the non-reabsorption of Na+ on the membrane of the late distal tube and of the collecting duct leads to decreased K+ secretion (urinary excretion of Na+ is heightened and K+ is decreased). Spironolactone is a K+-sparing diuretic (INFARMED, 2016) and is further studied on this document (DeRoos, 2011b, Horisberger and Giebisch, 1987, Reilly and Jackson, 2011).
Figure 2. Molecules and their diuretic subfamilies with interest to this essay
1.4.2.
β-adrenergic antagonists
This subgroup of antihypertensive drugs, also referred to as β-blockers, operate in the membranes of cardiac cells, competitively antagonizing catecholamines positive inotropic (increased strength of cardiac muscle contraction (THI, 2016) and raised ejection volume) and chronotropic (heightened heart rate) effects, by binding to their β-adrenergic receptors, in order to decrease the cardiac rhythm and the myocardium contractility. In an healthy subject, 80% of the β-adrenergic receptors are β1 (mediate an increased inotropy),
which is where the majority of the drugs of this family exert their inhibitory effect. Atenolol (ATE), bisoprolol (BIS), carvedilol (CAR) and nebivolol (NEB) are the β1-selective antagonists with interest to this study. CAR, a third-generation antihypertensive drug with membrane-stabilizing and vasodilation properties, can also bind to the β2 (similar to
cardiac β1-adrenergic receptors) and α2 (resulting in vasodilation) receptor subtypes.
Nebivolol, also a third-generation drug, causes vasodilation by releasing nitric oxide. This family of antihypertensive drugs may lead to myocardial and respiratory depression and
Thiazide and thiazide-like diuretics Loop diuretics Potassium-sparing diuretics
Indapamide furosemide
spironolactone
hydrochlorothiazide
Figure 3. β-adrenergic antagonist molecules with interest to this study
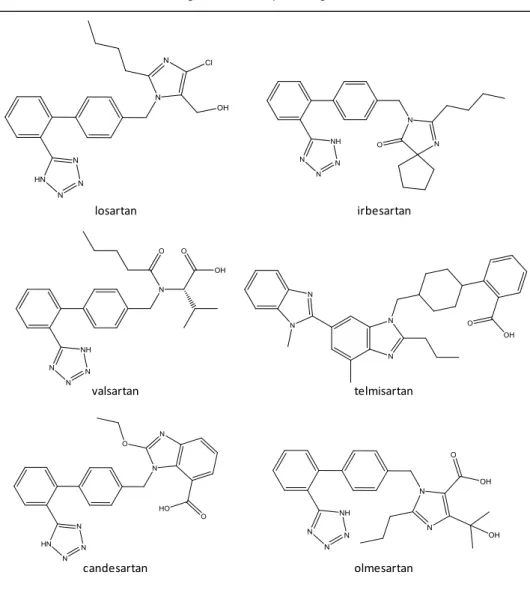
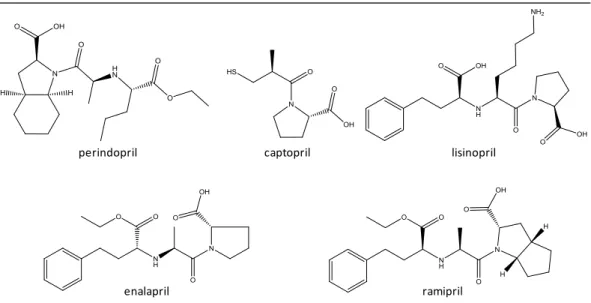
1.4.3. Angiotensin II receptor antagonist
Blocking the renin-angiotensin system is an important antihypertensive action because this system is the most significant blood pressure controller that responds to the decreased renal blood flow and acts in order to raise it back up (Hall, 1991).
ARBs might also be referred to as type 1 angiotensin (AT1) receptor blockers. In an healthy subject, vasoconstriction occurs due to the interaction established between the product of the aforementioned system, angiotensin II, and AT1 receptors, responsible for translating the signaling message generated by angiotensin II. The binding of angiotensin II to AT1 receptors secretes an hormone called aldosterone that promotes the decrease of Na+ renal excretion (explained previously on section 1.4.1), which results in water retention and increased blood volume. This class of drugs antagonizes this interaction and the consequent vasoconstrictive and fluid retention effects by binding to the aforementioned receptors (Capen, 2008, Hilal-Dandan, 2011). These antihypertensive drugs might cause mental retardation and lethargy. ARBs are generally well tolerated but have teratogenic potential, like the other renin-angiotensin axis modifier group of drugs, the ACEi (Bakheit et al., 2015). The risk of generating adverse effects is lower for ARBs than it is for ACEi (DeRoos, 2011b). Losartan (LOS), irbesartan (IRB), valsartan (VAL), telmisartan (TEL), candesartan (CAND) and olmesartan (OLM) are further investigated on this study. CAND and OLM are ingested as candesartan cilexetil and olmesartan
β-adrenergic antagonists
atenolol bisoprolol
medoxomil, their inactive prodrugs, respectively (that are completely hydrolyzed during gastrointestinal absorption), since their bioavailability (BA) is better than the BA of the first ones (Al-Majed et al., 2017, Alonen et al., 2008, Fenton and Scott, 2005, Hilal-Dandan, 2011).
Figure 4. Angiotensin II receptor antagonist molecules with interest to this study.
Angiotensin II receptor antagonists
losartan irbesartan
valsartan telmisartan