Education
_ Graduates from the U.Porto 2008
University of Porto. Rectory Continuous Improvement Service. 22 June 2009
Table of Contents
Graduates from the University of Porto: sources and acronyms ... 3
Graduates – Growth 2003-2004 to 2007-2008 ... 4
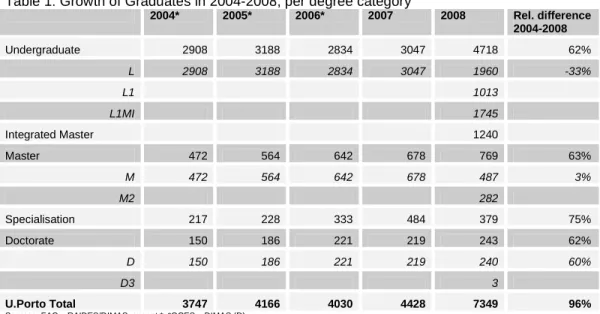
Table 1: Growth of Graduates in 2004-2008, per degree category ... 4
Chart 1: Growth of Graduates in 2004-2008, per degree category ... 4
Table 2: Growth of Licenciados in 2004-2008, per faculty/school ... 5
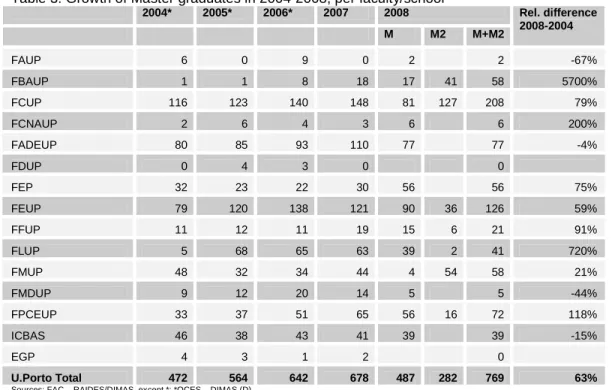
Table 3: Growth of Master graduates in 2004-2008, per faculty/school ... 5
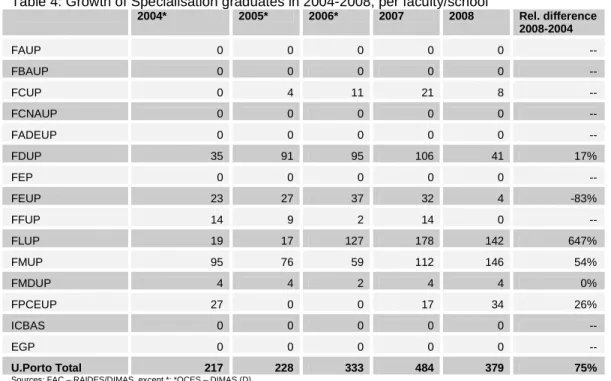
Table 4: Growth of Specialisation graduates in 2004-2008, per faculty/school ... 6
Table 5: Growth of Doctorate graduates in 2004-2008, per faculty/school... 6
Graduates 2007/2008 ... 7
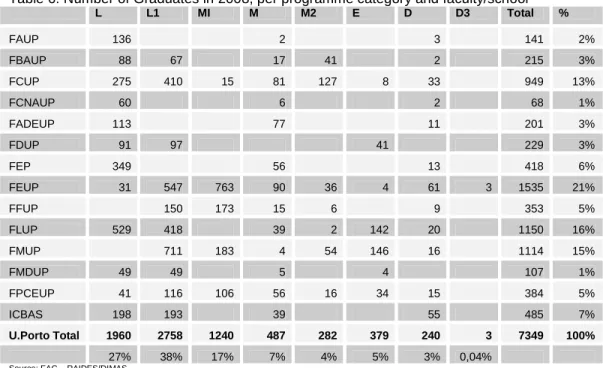
Table 6: Number of Graduates in 2008, per programme category and faculty/school ... 7
Table 7: Number of Graduates in 2008, per programme category and nationality... 7
Chart 2: Proportion of Graduates in 2008, per programme category and nationality ... 8
Table 8: Number of Graduates in 2008, per programme category and gender... 9
Chart 3: Proportion of Graduates in 2008, per programme category and gender ... 9
Licenciados 2007/2008 ... 10
Chart 4: Number of Licenciados in 2008, per age ... 10
Chart 5: Number of Licenciados in 2008, per grades ... 10
Chart 6: Number of Licenciados in 2008, per number of enrolments ... 11
Table 9: Number of Licenciados, per gender and faculty/school (2008) ... 11
Table 10: Number of Licenciados, per nationality and faculty/school (2008) ... 12
Table 11: Number of Licenciados, per gender, age and programme (2008)... 13
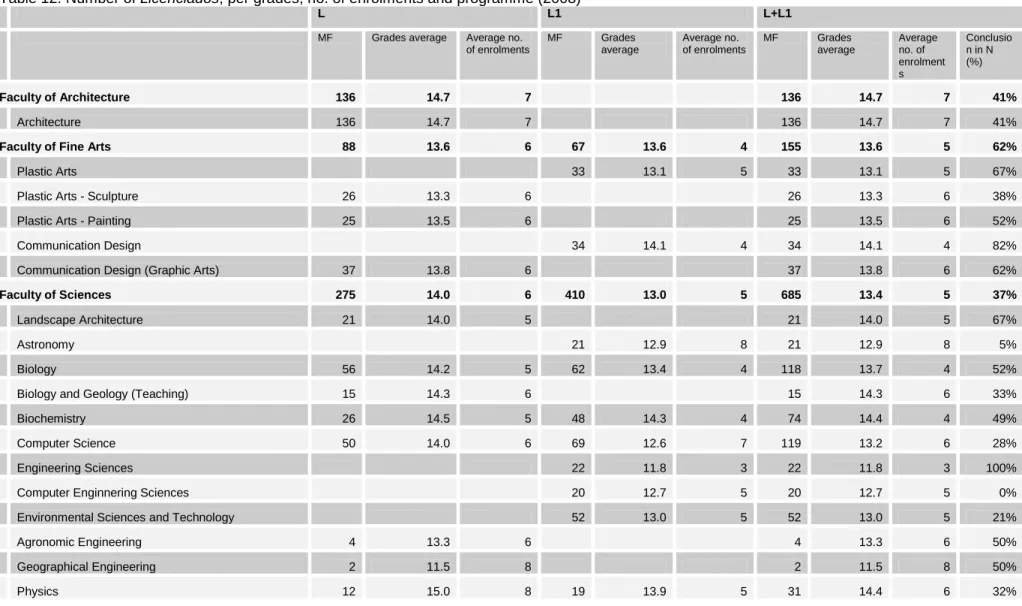
Table 12: Number of Licenciados, per grades, no. of enrolments and programme (2008) ... 17
Integrated Master graduates 2007/2008 ... 22
Master graduates 2007/2008... 25
Chart 10: Number of Master graduates in 2008, per age ... 25
Chart 11: Number of Master graduates in 2008, per grades ... 25
Chart 12: Number of Master graduates in 2008, per no. of enrolments ... 26
Table 17: Number of Master graduates, per gender and faculty/school (2008) ... 26
Table 18: Number of Master graduates, per nationality and faculty/school (2008) ... 27
Table 19: Number of Master graduates, per gender, age and programme (2008)... 28
Specialisation graduates 2007/2008 ... 31
Chart 13: Number of Specialisation graduates in 2008, per age ... 31
Chart 14: Number of Specialisation graduates in 2008, per grades ... 32
Chart 15: Number of Specialisation graduates in 2008, per no. of enrolments ... 32
Table 20: Number of Specialisation graduates, per gender and faculty/school (2008) ... 33
Table 21: Number of Specialisation graduates, per nationality and faculty/school (2008) ... 33
Table 22: Number of Specialisation graduates, per gender, age and programme (2008) ... 34
Doctorate graduates 2007/2008... 35
Chart 16: Number of Doctorate graduates in 2008, per age... 35
Chart 17: Number of Doctorate graduates in 2008, per grades... 35
Chart 18: Number of Doctorate graduates in 2008, per no. of enrolments... 36
Table 23: Number of Doctorate graduates, per gender, age and faculty/school (2008)... 36
Table 24: Number of Doctorate graduates, per nationality and faculty/school (2008)... 37
Table 25: Number of Doctorate graduates, per gender, age and programme/field of
knowledge (2008)... 38
Translation Note: For the purpose of this document, the term Licenciado means "Undergraduate student”.
Graduates from the University of Porto
The data refers to the situation as at 31 December. Therefore, as an example, the data
identified as 2008 refers to the 2007-2008 academic year, as at 31 December 2008.
Unless otherwise stated, the source of the data shown is the Academic and Training
Organization Services of the Rectory of the University of Porto – Reply from the U.Porto to
the Survey on the Register of Enrolled and Graduate Students in Higher Education
(RAIDES/DIMAS).
Sources
FAC – RAIDES/DIMAS: Academic and Training Organization Services of the Rectory of the
University of Porto – Reply from the U.Porto to the Statistical Survey on the Register of
Enrolled and Graduate Students in Higher Education (RAIDES/DIMAS).
OCES – DIMAS (D): Science and Higher Education Observatory - Statistical Survey on
Graduates and Students Enrolled in Higher Education (DIMAS). Editions: “Graduates in
Higher Education in 2005-2006”, “Graduates in Higher Education in 2004-2005” and
“Graduates (2003 - 2004)”.
In
http://www.gpeari.mctes.pt/index.php?idc=47&idi=171906&valor=1Acronyms
F – Female graduates
M – Male graduates
MF – Total no. of graduates
D – Doctorate pre-Bologna
D3 – 3
rdcycle
E – Specialisation
L – Undergraduate degree pre-Bologna
L1 – 1
stcycle
L1MI – 1
stcycle of Integrated Master
M – Master degree pre-Bologna
M2 – 2
ndcycle
MI – Integrated Master
EGP – University of Porto Business School
FADEUP – Faculty of Sport
FAUP – Faculty of Architecture
FBAUP – Faculty of Fine Arts
FCNAUP – Faculty of Nutrition and Food Science
FCUP – Faculty of Sciences
FDUP – Faculty of Law
FEP – Faculty of Economics
FEUP – Faculty of Engineering
FFUP – Faculty of Pharmacy
FLUP – Faculty of Arts
Graduates – Growth 2003-2004 to 2007-2008
Table 1: Growth of Graduates in 2004-2008, per degree category
2004* 2005* 2006* 2007 2008 Rel. difference 2004-2008 Undergraduate 2908 3188 2834 3047 4718 62% L 2908 3188 2834 3047 1960 -33% L1 1013 L1MI 1745 Integrated Master 1240 Master 472 564 642 678 769 63% M 472 564 642 678 487 3% M2 282 Specialisation 217 228 333 484 379 75% Doctorate 150 186 221 219 243 62% D 150 186 221 219 240 60% D3 3 U.Porto Total 3747 4166 4030 4428 7349 96%
Sources: FAC – RAIDES/DIMAS, except *; *OCES – DIMAS (D)
Chart 1: Growth of Graduates in 2004-2008, per degree category
2908 3188 2834 3047 1960 1745 1240 472 564 642 678 487 282 150 186 221 219 243 1013 228 217 333 484 379 0 1000 2000 3000 4000 5000 6000 7000 8000 2004 2005 2006 2007 2008 D+D3 E M2 M MI L1MI L1 L
Table 2: Growth of Licenciados in 2004-2008, per faculty/school
2004* 2005* 2006* 2007 2008 L L1 L1MI L+L1+L1MI Rel. difference 2008/2004 FAUP 70 113 141 147 136 136 94% FBAUP 111 106 100 116 88 67 155 40% FCUP 431 389 382 358 275 389 21 685 59% FCNAUP 60 44 44 45 60 60 0% FADEUP 95 101 108 91 113 113 19% FDUP 74 99 102 102 91 97 188 154% FEP 341 343 345 398 349 349 2% FEUP 541 530 501 663 31 547 578 7% FFUP 107 120 94 120 150 150 40% FLUP 573 814 471 482 529 418 947 65% FMUP 146 150 182 187 711 711 387% FMDUP 71 58 59 45 49 49 98 38% FPCEUP 182 193 165 158 41 37 79 157 -14% ICBAS 106 128 140 135 198 5 188 391 269% U.Porto Total 2908 3188 2834 3047 1960 1013 1745 4718 62%Sources: FAC – RAIDES/DIMAS, except *; *OCES – DIMAS (D)
Table 3: Growth of Master graduates in 2004-2008, per faculty/school
2004* 2005* 2006* 2007 2008 M M2 M+M2 Rel. difference 2008-2004 FAUP 6 0 9 0 2 2 -67% FBAUP 1 1 8 18 17 41 58 5700% FCUP 116 123 140 148 81 127 208 79% FCNAUP 2 6 4 3 6 6 200% FADEUP 80 85 93 110 77 77 -4% FDUP 0 4 3 0 0 FEP 32 23 22 30 56 56 75% FEUP 79 120 138 121 90 36 126 59% FFUP 11 12 11 19 15 6 21 91% FLUP 5 68 65 63 39 2 41 720% FMUP 48 32 34 44 4 54 58 21% FMDUP 9 12 20 14 5 5 -44% FPCEUP 33 37 51 65 56 16 72 118% ICBAS 46 38 43 41 39 39 -15% EGP 4 3 1 2 0 U.Porto Total 472 564 642 678 487 282 769 63%
Table 4: Growth of Specialisation graduates in 2004-2008, per faculty/school
2004* 2005* 2006* 2007 2008 Rel. difference 2008-2004 FAUP 0 0 0 0 0 -- FBAUP 0 0 0 0 0 -- FCUP 0 4 11 21 8 -- FCNAUP 0 0 0 0 0 -- FADEUP 0 0 0 0 0 -- FDUP 35 91 95 106 41 17% FEP 0 0 0 0 0 -- FEUP 23 27 37 32 4 -83% FFUP 14 9 2 14 0 -- FLUP 19 17 127 178 142 647% FMUP 95 76 59 112 146 54% FMDUP 4 4 2 4 4 0% FPCEUP 27 0 0 17 34 26% ICBAS 0 0 0 0 0 -- EGP 0 0 0 0 0 -- U.Porto Total 217 228 333 484 379 75%Sources: FAC – RAIDES/DIMAS, except *; *OCES – DIMAS (D)
Table 5: Growth of Doctorate graduates in 2004-2008, per faculty/school
2004 2005* 2006* 2007 2008 D D3 D+D3 Rel. difference 2008/2004 FAUP 4 0 2 1 3 3 -25% FBAUP 0 0 2 1 2 2 -- FCUP 13 16 36 43 33 33 154% FCNAUP 1 1 2 1 2 2 100% FADEUP 4 12 10 10 11 11 175% FDUP 0 0 1 1 0 0 -- FEP 3 9 4 8 13 13 333% FEUP 45 52 54 31 61 3 64 42% FFUP 6 6 11 14 9 9 50% FLUP 21 22 16 31 20 20 -5% FMUP 12 19 16 19 16 16 33% FMDUP 3 3 6 0 0 0 -- FPCEUP 14 14 29 18 15 15 7% ICBAS 24 32 32 41 55 55 129% U.Porto Total 150 186 221 219 243 3 243 62%
Graduates 2007/2008
Table 6: Number of Graduates in 2008, per programme category and faculty/school
L L1 MI M M2 E D D3 Total % FAUP 136 2 3 141 2% FBAUP 88 67 17 41 2 215 3% FCUP 275 410 15 81 127 8 33 949 13% FCNAUP 60 6 2 68 1% FADEUP 113 77 11 201 3% FDUP 91 97 41 229 3% FEP 349 56 13 418 6% FEUP 31 547 763 90 36 4 61 3 1535 21% FFUP 150 173 15 6 9 353 5% FLUP 529 418 39 2 142 20 1150 16% FMUP 711 183 4 54 146 16 1114 15% FMDUP 49 49 5 4 107 1% FPCEUP 41 116 106 56 16 34 15 384 5% ICBAS 198 193 39 55 485 7% U.Porto Total 1960 2758 1240 487 282 379 240 3 7349 100% 27% 38% 17% 7% 4% 5% 3% 0,04%
Source: FAC – RAIDES/DIMAS
Table 7: Number of Graduates in 2008, per programme category and nationality
L L1 MI M M2 E D D3 U.Porto Total Portugal 1927 2717 1226 434 275 372 223 3 7177 Brazil 2 9 35 2 10 58 Cape Verde 5 9 4 11 1 30 Spain 4 1 2 4 11 France 3 3 1 1 8 Germany 4 1 1 1 7 Angola 2 2 2 1 7 Venezuela 2 2 2 1 7 Romania 3 1 4 East Timor 3 1 4
Sao Tome and Principe 1 3 4
Thailand 3 3 Switzerland 2 1 3 Mozambique 1 1 1 3 South Africa 1 1 2 Russian Federation 1 1 2 Italy 2 2
L L1 MI M M2 E D D3 U.Porto Total Guinea Bissau 1 1 Namibia 1 1 Poland 1 1 Belgium 1 1 India 1 1 United Kingdom 1 1 Israel 1 1 Total 1960 2758 1240 487 282 379 240 3 7349
Source: FAC – RAIDES/DIMAS
Chart 2: Proportion of Graduates in 2008, per programme category and nationality
98% 99% 99% 89% 98% 98% 93% 100% 2% 1% 1% 11% 2% 2% 7% 0% 0% 10% 20% 30% 40% 50% 60% 70% 80% 90% 100% L L1 MI M M2 E D D3 overseas Portugal
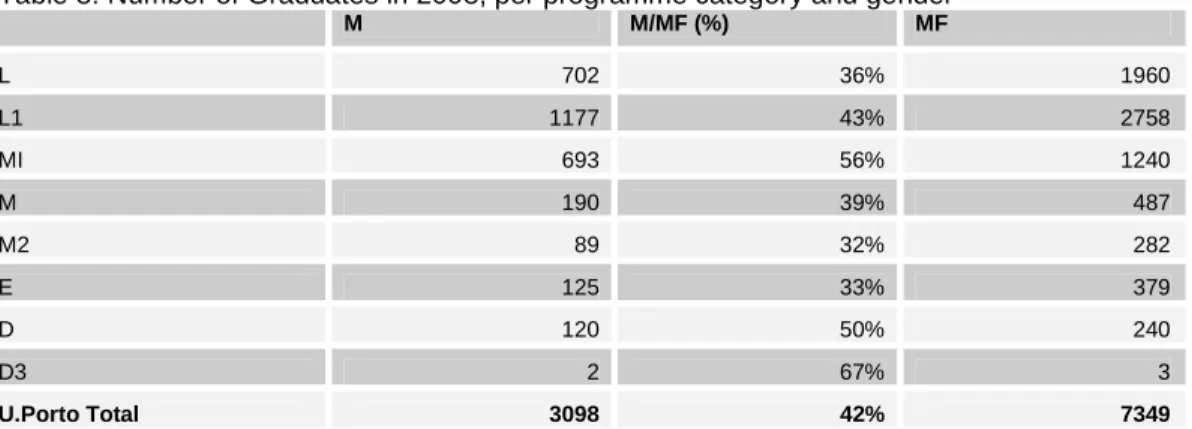
Table 8: Number of Graduates in 2008, per programme category and gender
M M/MF (%) MF L 702 36% 1960 L1 1177 43% 2758 MI 693 56% 1240 M 190 39% 487 M2 89 32% 282 E 125 33% 379 D 120 50% 240 D3 2 67% 3 U.Porto Total 3098 42% 7349Source: FAC – RAIDES/DIMAS
Chart 3: Proportion of Graduates in 2008, per programme category and gender
36% 43% 56% 39% 32% 33% 50% 67% 64% 57% 44% 61% 68% 67% 50% 33% 0% 10% 20% 30% 40% 50% 60% 70% 80% 90% 100% L L1 MI M M2 E D D3 F M
Licenciados 2007/2008
Chart 4: Number of Licenciados in 2008, per age
17 619 1022 847 746 447 278 143 108 75 202 80 58 29 47 0 200 400 600 800 1000 1200 20 21 22 23 24 25 26 27 28 29 30-34 35-39 40-44 45-49 >=50 0% 10% 20% 30% 40% 50% 60% 70% 80% 90% 100%
Chart 5: Number of Licenciados in 2008, per grades
547 6 271 947 1037 928 637 256 71 18 0 200 400 600 800 1000 1200 (not available) 10 11 12 13 14 15 16 17 18 0% 10% 20% 30% 40% 50% 60% 70% 80% 90% 100%
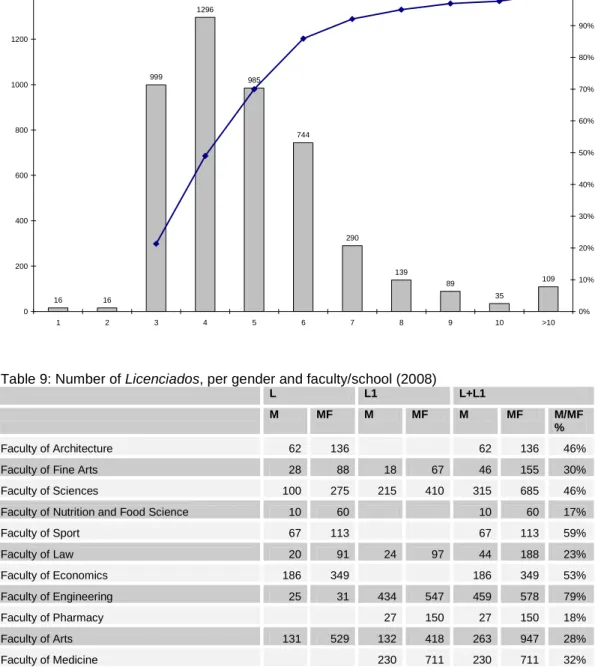
Chart 6: Number of Licenciados in 2008, per number of enrolments
16 16 999 1296 985 744 290 139 89 35 109 0 200 400 600 800 1000 1200 1400 1 2 3 4 5 6 7 8 9 10 >10 0% 10% 20% 30% 40% 50% 60% 70% 80% 90% 100%Table 9: Number of Licenciados, per gender and faculty/school (2008)
L L1 L+L1
M MF M MF M MF M/MF
%
Faculty of Architecture 62 136 62 136 46%
Faculty of Fine Arts 28 88 18 67 46 155 30%
Faculty of Sciences 100 275 215 410 315 685 46%
Faculty of Nutrition and Food Science 10 60 10 60 17%
Faculty of Sport 67 113 67 113 59% Faculty of Law 20 91 24 97 44 188 23% Faculty of Economics 186 349 186 349 53% Faculty of Engineering 25 31 434 547 459 578 79% Faculty of Pharmacy 27 150 27 150 18% Faculty of Arts 131 529 132 418 263 947 28% Faculty of Medicine 230 711 230 711 32%
Faculty of Dental Medicine 16 49 11 49 27 98 28%
Faculty of Psychology and Education Science 4 41 12 116 16 157 10% Institute of Biomedical Sciences Abel Salazar 53 198 74 193 127 391 32%
U.Porto Total 702 1960 1177 2758 1879 4718 40%
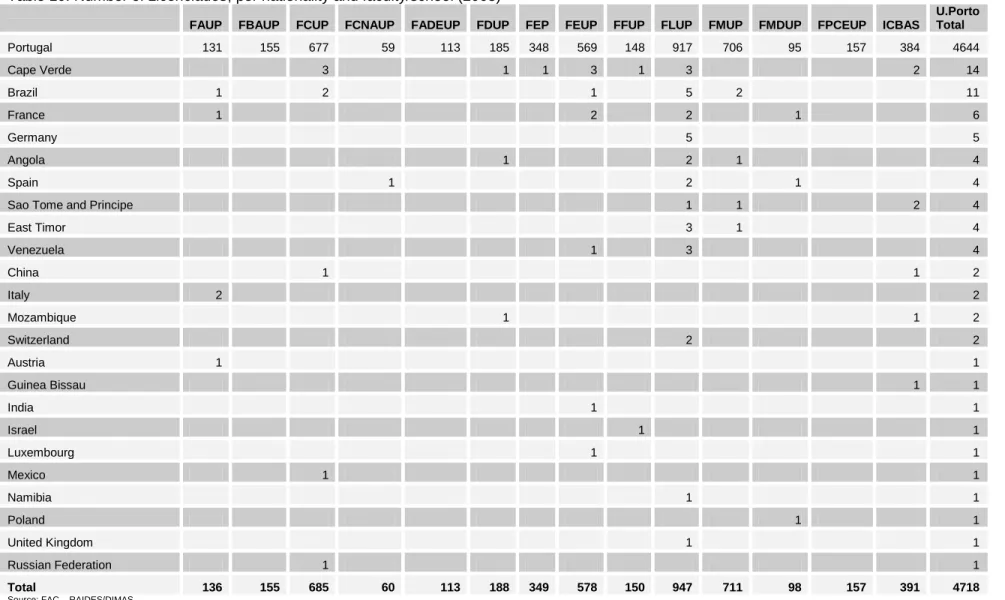
Table 10: Number of Licenciados, per nationality and faculty/school (2008)
FAUP FBAUP FCUP FCNAUP FADEUP FDUP FEP FEUP FFUP FLUP FMUP FMDUP FPCEUP ICBAS
U.Porto Total Portugal 131 155 677 59 113 185 348 569 148 917 706 95 157 384 4644 Cape Verde 3 1 1 3 1 3 2 14 Brazil 1 2 1 5 2 11 France 1 2 2 1 6 Germany 5 5 Angola 1 2 1 4 Spain 1 2 1 4
Sao Tome and Principe 1 1 2 4
East Timor 3 1 4 Venezuela 1 3 4 China 1 1 2 Italy 2 2 Mozambique 1 1 2 Switzerland 2 2 Austria 1 1 Guinea Bissau 1 1 India 1 1 Israel 1 1 Luxembourg 1 1 Mexico 1 1 Namibia 1 1 Poland 1 1 United Kingdom 1 1 Russian Federation 1 1 Total 136 155 685 60 113 188 349 578 150 947 711 98 157 391 4718
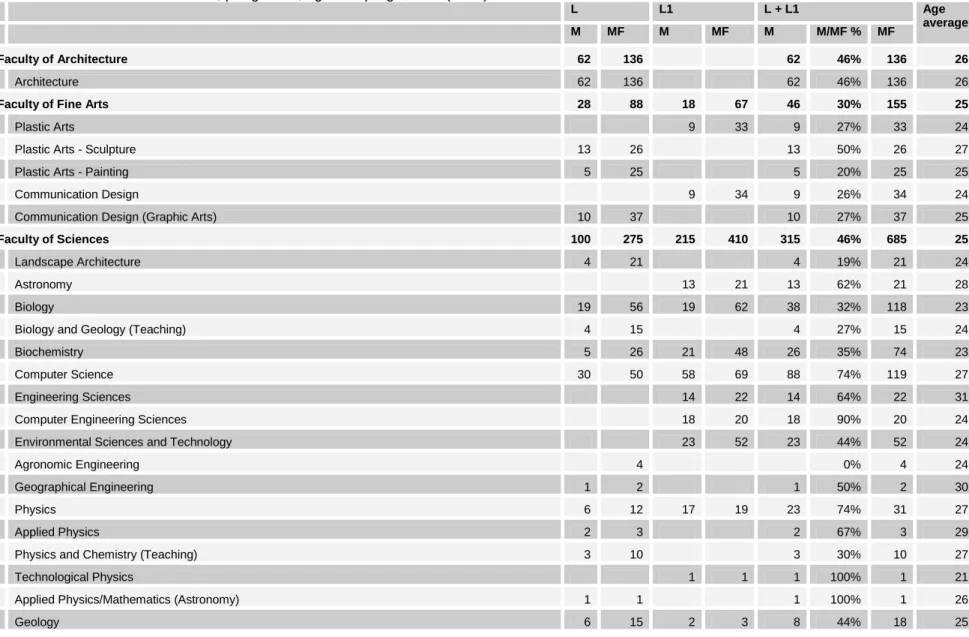
Table 11: Number of Licenciados, per gender, age and programme (2008)
L L1 L + L1 M MF M MF M M/MF % MF Age average Faculty of Architecture 62 136 62 46% 136 26 Architecture 62 136 62 46% 136 26Faculty of Fine Arts 28 88 18 67 46 30% 155 25
Plastic Arts 9 33 9 27% 33 24
Plastic Arts - Sculpture 13 26 13 50% 26 27
Plastic Arts - Painting 5 25 5 20% 25 25
Communication Design 9 34 9 26% 34 24
Communication Design (Graphic Arts) 10 37 10 27% 37 25
Faculty of Sciences 100 275 215 410 315 46% 685 25
Landscape Architecture 4 21 4 19% 21 24
Astronomy 13 21 13 62% 21 28
Biology 19 56 19 62 38 32% 118 23
Biology and Geology (Teaching) 4 15 4 27% 15 24
Biochemistry 5 26 21 48 26 35% 74 23
Computer Science 30 50 58 69 88 74% 119 27
Engineering Sciences 14 22 14 64% 22 31
Computer Engineering Sciences 18 20 18 90% 20 24
Environmental Sciences and Technology 23 52 23 44% 52 24
Agronomic Engineering 4 0% 4 24
Geographical Engineering 1 2 1 50% 2 30
L L1 L + L1
M MF M MF M M/MF % MF
Age average
Mathematics 6 20 16 33 22 42% 53 26
Mathematics applied to Technology 6 8 6 75% 8 25
Chemistry 7 32 13 60 20 22% 92 26
Faculty of Nutrition and Food Science 10 60 10 17% 60 25
Nutrition Sciences 10 60 10 17% 60 25
Faculty of Sport 67 113 67 59% 113 26
Sports and Physical Education 67 113 67 59% 113 26
Faculty of Law 20 91 24 97 44 23% 188 23 Law 20 91 24 97 44 23% 188 23 Faculty of Economics 186 349 186 53% 349 24 Economics 123 237 123 52% 237 24 Management 63 112 63 56% 112 24 Faculty of Engineering 25 31 434 547 459 79% 578 23
Engineering Sciences - Electrical and Computers Engineering 93 103 93 90% 103 23
Engineering Sciences - Civil Engineering 126 165 126 76% 165 23
Engineering Sciences - Environmental Engineering 10 24 10 42% 24 22
Engineering Sciences - Informatics and Computing Engineering 71 77 71 92% 77 22
Engineering Sciences - Metallurgical and Materials Engineering 9 12 9 75% 12 24
Engineering Sciences - Chemical Engineering 20 47 20 43% 47 23
Engineering Sciences - Industrial Engineering and Management 41 51 41 80% 51 22
Engineering Sciences - Mechanics 64 68 64 94% 68 23
Civil Engineering 1 2 1 50% 2 28
Mining and Geo-Environmental Engineering 8 12 8 67% 12 30
Electrical and Computers Engineering 6 6 6 100% 6 33
Informatics and Computing Engineering 1 1 1 100% 1 31
L L1 L + L1
M MF M MF M M/MF % MF
Age average
Chemical Engineering 1 1 1 100% 1 26
Management and Industrial Engineering 1 2 1 50% 2 30
Faculty of Pharmacy 27 150 27 18% 150 24
Basic Studies in Pharmaceutical Sciences 27 150 27 18% 150 24
Faculty of Arts 131 529 132 418 263 28% 947 27
Archaeology 17 40 13 30 30 43% 70 26
Information Science 10 27 5 29 15 27% 56 25
Communication Sciences: Journalism, Public Relations, Multimedia 9 47 9 19% 47 23
European Studies: Languages and International Relations 2 15 2 13% 15 24
Portuguese and Lusophone Studies 2 5 2 40% 5 26
Philosophy 15 36 20 57 35 38% 93 29
Geography 16 45 26 55 42 42% 100 27
History 23 59 21 43 44 43% 102 29
History of Art 5 36 9 25 14 23% 61 28
Journalism and Communication Sciences 8 55 8 15% 55 23
Modern Languages and Literature: Portuguese Lang. and Culture (Teaching Port. as a Foreign Lang.) 2 5 2 40% 5 28
Applied Languages 3 9 3 33% 9 22
Modern Languages and Literature: Portuguese Language, Literature and Culture 5 27 5 19% 27 27
Modern Languages and Literature: German Studies 2 0% 2 26
Modern Languages and Literature: Anglo-American Studies 4 20 4 20% 20 27
Modern Languages and Literature: French Studies 1 6 1 17% 6 24
L L1 L + L1
M MF M MF M M/MF % MF
Age average
Modern Languages and Literature: Portuguese and English Studies 6 47 6 13% 47 26
Languages and International Relations 7 17 7 41% 17 25
Languages, Literatures and Cultures 14 69 14 20% 69 30
Sociology 11 42 3 32 14 19% 74 26
Faculty of Medicine 230 711 230 32% 711 23
Basic Health Sciences 230 711 230 32% 711 23
Faculty of Dental Medicine 16 49 11 49 27 28% 98 24
Basic Studies in Oral Health 11 49 11 22% 49 22
Dental Medicine 16 49 16 33% 49 25
Faculty of Psychology and Education Science 4 41 12 116 16 10% 157 24
Education Sciences 4 41 5 37 9 12% 78 25
Psychological Sciences 7 79 7 9% 79 22
Institute of Biomedical Sciences Abel Salazar 53 198 74 193 127 32% 391 24
Basic Health Sciences 58 142 58 41% 142 23
Aquatic Sciences 4 10 2 5 6 40% 15 23
Basic Studies in Animal Health Sciences 14 46 14 30% 46 24
Medicine 38 133 38 29% 133 25
Veterinary Medicine 11 55 11 20% 55 26
U.Porto Total 702 1960 1177 2758 1879 40% 4718 25
Table 12: Number of Licenciados, per grades, no. of enrolments and programme (2008)
L L1 L+L1
MF Grades average Average no. of enrolments MF Grades average Average no. of enrolments MF Grades average Average no. of enrolment s Conclusio n in N (%) Faculty of Architecture 136 14.7 7 136 14.7 7 41% Architecture 136 14.7 7 136 14.7 7 41%
Faculty of Fine Arts 88 13.6 6 67 13.6 4 155 13.6 5 62%
Plastic Arts 33 13.1 5 33 13.1 5 67%
Plastic Arts - Sculpture 26 13.3 6 26 13.3 6 38%
Plastic Arts - Painting 25 13.5 6 25 13.5 6 52%
Communication Design 34 14.1 4 34 14.1 4 82%
Communication Design (Graphic Arts) 37 13.8 6 37 13.8 6 62%
Faculty of Sciences 275 14.0 6 410 13.0 5 685 13.4 5 37%
Landscape Architecture 21 14.0 5 21 14.0 5 67%
Astronomy 21 12.9 8 21 12.9 8 5%
Biology 56 14.2 5 62 13.4 4 118 13.7 4 52%
Biology and Geology (Teaching) 15 14.3 6 15 14.3 6 33%
Biochemistry 26 14.5 5 48 14.3 4 74 14.4 4 49%
Computer Science 50 14.0 6 69 12.6 7 119 13.2 6 28%
Engineering Sciences 22 11.8 3 22 11.8 3 100%
L L1 L+L1 MF Grades average Average no.
of enrolments MF Grades average Average no. of enrolments MF Grades average Average no. of enrolment s Conclusio n in N (%) Applied Physics 3 12.3 5 3 12.3 5 67%
Physics and Chemistry (Teaching) 10 14.2 7 10 14.2 7 10%
Technological Physics 1 15.0 3 1 15.0 3 100%
Applied Physics/Mathematics (Astronomy) 1 12.0 8 1 12.0 8 0%
Geology 15 12.8 5 3 13.3 3 18 12.9 5 44%
Mathematics 20 14.6 6 33 13.1 5 53 13.6 5 47%
Mathematics applied to Technology 8 13.3 5 8 13.3 5 50%
Chemistry 32 13.7 6 60 12.5 5 92 12.9 6 18%
Faculty of Nutrition and Food Science 60 14.7 5 60 14.7 5 90%
Nutrition Sciences 60 14.7 5 60 14.7 5 90%
Faculty of Sport 113 14.6 6 113 14.6 6 45%
Sports and Physical Education 113 14.6 6 113 14.6 6 45%
Faculty of Law 91 13.1 6 97 12,7 4 188 12.9 5 80% Law 91 13.1 6 97 12.7 4 188 12.9 5 80% Faculty of Economics 349 12.5 5 349 12.5 5 38% Economics 237 12.5 5 237 12.5 5 41% Management 112 12.5 6 112 12.5 6 34% Faculty of Engineering 31 12.0 9 547 n/d 4 578 n/d 5 36%
Engineering Sciences - Electrical and Computers
Engineering 103 n/d 5 103 n/d 5 25%
Engineering Sciences - Civil Engineering 165 n/d 4 165 n/d 4 44%
Engineering Sciences - Environmental Engineering 24 n/d 3 24 n/d 3 58%
Engineering Sciences - Informatics and Computing
L L1 L+L1 MF Grades average Average no.
of enrolments MF Grades average Average no. of enrolments MF Grades average Average no. of enrolment s Conclusio n in N (%)
Engineering Sciences - Metallurgical and Materials
Engineering 12 n/d 5 12 n/d 5 17%
Engineering Sciences - Chemical Engineering 47 n/d 5 47 n/d 5 21%
Engineering Sciences - Industrial Engineering and
Management 51 n/d 4 51 n/d 4 43%
Engineering Sciences - Mechanics 68 n/d 5 68 n/d 5 26%
Civil Engineering 2 11.0 8 2 11.0 8 0%
Mining and Geo-Environmental Engineering 12 12.3 8 12 12.3 8 8%
Electrical and Computers Engineering 6 11.8 9 6 11.8 9 33%
Informatics and Computing Engineering 1 13.0 7 1 13.0 7 0%
Mechanical Engineering 7 11.3 11 7 11.3 11 0%
Chemical Engineering 1 14.0 8 1 14.0 8 0%
Management and Industrial Engineering 2 13.0 8 2 13.0 8 0%
Faculty of Pharmacy 150 12.6 5 150 12.6 5 2%
Basic Studies in Pharmaceutical Sciences 150 12.6 5 150 12.6 5 2%
Faculty of Arts 529 13.2 5 418 13.1 4 947 13.2 4 62%
Archaeology 40 13.8 5 30 14.0 4 70 13.9 4 50%
Information Science 27 13.4 4 29 13.4 3 56 13.4 4 88%
Communication Sciences: Journalism, Public
Relations, Multimedia 47 13.8 3 47 13.8 3 96%
European Studies: Languages and International
L L1 L+L1 MF Grades average Average no.
of enrolments MF Grades average Average no. of enrolments MF Grades average Average no. of enrolment s Conclusio n in N (%) History of Art 36 13.6 5 25 14.2 3 61 13.9 4 70%
Journalism and Communication Sciences 55 14.0 4 55 14.0 4 95%
Modern Languages and Literature: Portuguese Lang.
and Culture (Teaching Port. as a Foreign Lang.) 5 13.8 4 5 13.8 4 100%
Applied Languages 9 13.4 3 9 13.4 3 78%
Modern Languages and Literature: Portuguese
Language, Literature and Culture 27 12.3 5 27 12.3 5 63%
Modern Languages and Literature: German Studies 2 14.5 4 2 14.5 4 100%
Modern Languages and Literature: Anglo-American
Studies 20 12.4 4 20 12.4 4 100%
Modern Languages and Literature: French Studies 6 13.2 4 6 13.2 4 100%
Modern Languages and Literature: French and
English Studies 8 13.6 6 8 13.6 6 38%
Modern Languages and Literature: English and
German Studies 20 13.2 6 20 13.2 6 50%
Modern Languages and Literature: Portuguese and
German Studies 8 12.1 7 8 12.1 7 0%
Modern Languages and Literature: Portuguese and
Spanish Studies 12 12.4 6 12 12.4 6 33%
Modern Languages and Literature: Portuguese and
French Studies 19 11.9 6 19 11.9 6 11%
Modern Languages and Literature: Portuguese and
English Studies 47 12.7 6 47 12.7 6 32%
Languages and International Relations 17 13.1 4 17 13.1 4 53%
Languages, Literatures and Cultures 69 12.7 4 69 12.7 4 57%
Sociology 42 13.8 6 32 12.8 3 74 13.4 5 72%
Faculty of Medicine 711 13.7 5 711 13.7 5 24%
Basic HealthSciences 711 13.7 5 711 13.7 5 24%
Faculty of Dental Medicine 49 13.1 5 49 13.4 2 98 13.3 4 46%
L L1 L+L1 MF Grades average Average no.
of enrolments MF Grades average Average no. of enrolments MF Grades average Average no. of enrolment s Conclusio n in N (%) Dental Medicine 49 13.1 5 49 13.1 5 47%
Faculty of Psychology and Education Science 41 14.8 4 116 14.4 3 157 14.5 3 88%
Education Sciences 41 14.8 4 37 15.1 3 78 14.9 4 90%
Psychological Sciences 79 14.1 3 79 14.1 3 86%
Institute of Biomedical Sciences Abel Salazar 198 14.3 6 193 13.1 4 391 13.7 5 64%
Basic Health Sciences 142 13.3 4 142 13.3 4 57%
Aquatic Sciences 10 14.1 4 5 12.2 4 15 13.5 4 73%
Basic Studies in Animal Health Sciences 46 12.7 5 46 12.7 5 35%
Medicine 133 14.6 6 133 14.6 6 86%
Veterinary Medicine 55 13.8 7 55 13.8 7 53%
U.Porto Total 1960 13.6 6 2758 13.3 4 4718 13.4 5 53%
Source: FAC – RAIDES/DIMAS
Notes: the average grades do not include the Licenciados whose final grade is not available; the estimate of the average no. of enrolments does not include the Licenciados with a no. of enrolments less than the programme length; the last column represents the proportion of Licenciados with N enrolments, where N is the number of years for a programme’s normal length.
Integrated Master graduates 2007/2008
Chart 7: Number of Integrated Master graduates in 2008, per age
11 312 453 212 97 52 22 26 34 7 4 7 3 0 50 100 150 200 250 300 350 400 450 500 22 23 24 25 26 27 28 29 30 - 34 35 - 39 40 - 44 45 - 49 >=50 0% 10% 20% 30% 40% 50% 60% 70% 80% 90% 100%
Chart 8: Number of Integrated Master graduates in 2008, per grades
9 159 328 315 240 144 36 9 0 50 100 150 200 250 300 350 11 12 13 14 15 16 17 18 0% 20% 40% 60% 80% 100% 120%
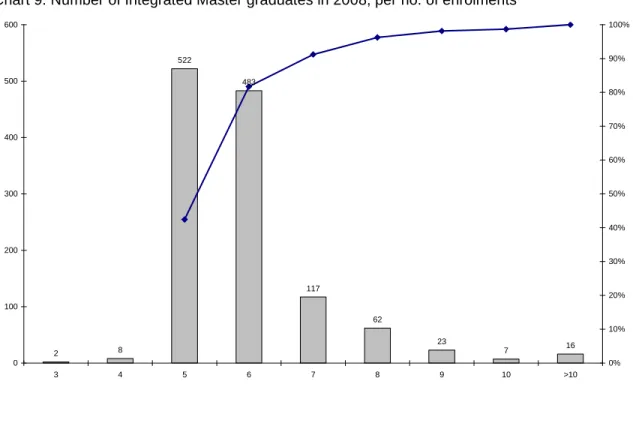
Chart 9: Number of Integrated Master graduates in 2008, per no. of enrolments
2 8 522 483 117 62 23 7 16 0 100 200 300 400 500 600 3 4 5 6 7 8 9 10 >10 0% 10% 20% 30% 40% 50% 60% 70% 80% 90% 100%Table 13: Number of Integrated Master graduates, per gender and faculty/school (2008)
M M/MF MF
Faculty of Sciences 12 80% 15
Faculty of Engineering 577 76% 763
Faculty of Pharmacy 32 18% 173
Faculty of Medicine 60 33% 183
Faculty of Psychology and Education Science 12 11% 106
U.Porto Total 693 56% 1240
Source: FAC – RAIDES/DIMAS
Table 14: Number of Integrated Master graduates, per nationality and faculty/school (2008)
FCUP FEUP FFUP FMUP FPCEUP U.Porto Total
Portugal 15 753 172 182 104 1226 Cape Verde 2 1 1 4 Angola 1 1 2 Venezuela 2 2 South Africa 1 1 Germany 1 1 Austria 1 1
Table 15: Number of Integrated Master graduates, per gender, age and programme (2008)
M M/MF % MF Age average
Faculty of Sciences 12 80% 15 25
Network Engineering and IT Systems 12 80% 15 25
Faculty of Engineering 577 76% 763 25
Civil Engineering 157 76% 206 25
Electrical and Computers Engineering 165 92% 179 25
Industrial Engineering and Management 26 57% 46 25
Informatics and Computing Engineering 112 93% 121 25
Mechanical Engineering 86 82% 105 27
Metallurgical and Materials Engineering 13 46% 28 26
Chemical Engineering 18 23% 78 25
Faculty of Pharmacy 32 18% 173 24
Pharmaceutical Sciences 32 18% 173 24
Faculty of Medicine 60 33% 183 25
Medicine 60 33% 183 25
Faculty of Psychology and Education Science 12 11% 106 25
Psychology 12 11% 106 25
U.Porto Total 693 56% 1240 25
Source: FAC – RAIDES/DIMAS
Table 16: Number of Integrated Master graduates, per grades, no. of enrolments and programme
(2008)
MF Grades average Average nb. of enrolments
Conclusion in N (%)
Faculty of Sciences 15 13.6 6 53%
Network Engineering and IT Systems 15 13.6 6 53%
Faculty of Engineering 763 13.7 6 50%
Civil Engineering 206 13.5 6 44%
Electrical and Computers Engineering 179 13.5 6 49%
Industrial Engineering and Management 46 14.4 6 63%
Informatics and Computing Engineering 121 14.4 6 56%
Mechanical Engineering 105 13.1 6 38%
Metallurgical and Materials Engineering 28 12.9 6 125%
Chemical Engineering 78 14.1 6 45%
Faculty of Pharmacy 173 13.6 6 39%
Pharmaceutical Sciences 173 13.6 6 39%
Faculty of Medicine 183 15.0 6 83%
Medicine 183 15.0 6 83%
Faculty of Psychology and Education Science 106 15.3 5 75%
Psychology 106 15.3 5 75%
U.Porto Total 1240 14.0 6 56%
Master graduates 2007/2008
Chart 10: Number of Master graduates in 2008, per age
1 24 40 50 65 71 85 68 199 73 51 24 18 0 50 100 150 200 250 22 23 24 25 26 27 28 29 30 - 34 35 - 39 40 - 44 45 - 49 >=50 0% 10% 20% 30% 40% 50% 60% 70% 80% 90% 100%
Chart 11: Number of Master graduates in 2008, per grades
103 448 100 150 200 250 300 350 400 450 500
Chart 12: Number of Master graduates in 2008, per no. of enrolments
21 268 269 138 50 18 3 1 1 0 50 100 150 200 250 300 1 2 3 4 5 6 7 8 9 0% 10% 20% 30% 40% 50% 60% 70% 80% 90% 100%Table 17: Number of Master graduates, per gender and faculty/school (2008)
M M2 M+M2
M MF M MF M MF M/MF
(%)
Faculty of Architecture 2 2 2 100%
Faculty of Fine Arts 6 17 17 41 23 58 40%
Faculty of Sciences 24 81 37 127 61 208 29%
Faculty of Nutrition and Food Science 6 6 6 100%
Faculty of Sport 40 77 40 77 52% Faculty of Economics 22 56 22 56 39% Faculty of Engineering 64 90 17 36 81 126 64% Faculty of Pharmacy 4 15 2 6 6 21 29% Faculty of Arts 14 39 2 14 41 34% Faculty of Medicine 2 4 15 54 17 58 29%
Faculty of Dental Medicine 3 5 3 5 60%
Faculty of Psychology and Education Science 8 56 1 16 9 72 13%
Institute of Biomedical Sciences Abel Salazar 3 39 3 39 8%
U.Porto Total 190 487 89 282 279 769 36%
Table 18: Number of Master graduates, per nationality and faculty/school (2008)
FAUP FBAUP FCUP FCNAUP FADEUP FEP FEUP FFUP FLUP FMUP FMDUP FPCEUP ICBAS U.Porto Total Portugal 2 56 203 5 54 48 118 19 32 58 5 71 38 709 Brazil 1 2 1 21 3 5 2 1 1 37 Cape Verde 1 2 9 12 Romania 3 3 Spain 2 2 Peru 2 2 South Africa 1 1 Germany 1 1 Angola 1 1 Russian Federation 1 1 Total 2 58 208 6 77 56 126 21 41 58 5 72 39 769
Table 19: Number of Master graduates, per gender, age and programme (2008)
M M2 M+M2 M MF M MF M M/MF (%) MF Age average Faculty of Architecture 2 0% 2 31Environment Planning and Urban Project 2 0% 2 31
Faculty of Fine Arts 6 17 17 41 23 40% 58 32
Multimedia Art 6 17 6 35% 17 34
Image design 6 12 6 50% 12 30
Sculpture 1 1 1 100% 1 42
Artistic Studies 1 5 1 20% 5 35
Drawing Practice and Theory 1 3 1 33% 3 29
Contemporary Artistic Practices 8 20 8 40% 20 32
Faculty of Sciences 24 81 37 127 61 29% 208 28
Astronomy 2 2 2 100% 2 24
Bioinformatics 2 5 2 40% 5 29
Biology 14 0% 14 28
Developmental Biology and Plant Reproduction 2 0% 2 29
Biology and Water Quality Management 1 6 1 17% 6 36
Biochemistry 8 19 8 42% 19 24
Computer Science 2 2 2 100% 2 25
Environmental Sciences and Technology 5 22 5 23% 22 26
Remote Sensing 3 5 3 60% 5 32
Applied Ecology 4 9 4 44% 9 31
Landscape Ecology and Nature Preservation 1 3 1 33% 3 29
Ecology, Environment and Land 1 2 1 50% 2 25
Multimedia Education 3 9 3 33% 9 30 Geographical Engineering 6 8 6 75% 8 27 Mathematical Engineering 1 5 1 20% 5 25 Teaching Astronomy 3 5 3 60% 5 34 Teaching Mathematics 2 9 2 22% 9 30 Medical Physics 1 1 1 100% 1 26 Teaching Physics 1 0% 1 27 Forensic Genetics 1 2 1 50% 2 23 Teaching Geology 3 0% 3 31
Geomaterials and Geological Resources 1 7 1 14% 7 28
Hydrobiology 8 0% 8 29
Computer Science 5 6 5 83% 6 32
Modelling, Analysis and Optimisation of
M M2 M+M2
M MF M MF M M/MF
(%)
MF Age
average
Exploration and Evaluation of Geological
Resources 1 3 1 33% 3 29
Chemistry 9 6 35 6 14% 44 28
Food Technology, Science and Safety 3 0% 3 34
Faculty of Nutrition and Food Science 6 0% 6 37
Clinical Nutrition 6 0% 6 37
Faculty of Sport 40 77 40 52% 77 31
Adapted Physical Activity 3 12 3 25% 12 31
Physical and Health Activities 2 4 2 50% 4 29
Physical Activity for the Elderly 2 7 2 29% 7 29
Sports Science 5 11 5 45% 11 31
Motor Skill Development 4 8 4 50% 8 34
Sports for Children and Youths 9 14 9 64% 14 32
Sports Management 6 10 6 60% 10 30
High-Yield Sports Training 9 11 9 82% 11 32
Faculty of Economics 22 56 22 39% 56 31
Data Analysis and Decision Support Systems 1 3 1 33% 3 27
Business Sciences 7 22 7 32% 22 32
Accountancy 2 4 2 50% 4 29
Development and Social Inclusion 1 2 1 50% 2 36
Economics 5 10 5 50% 10 29
Finances 2 5 2 40% 5 30
Marketing 4 10 4 40% 10 33
Faculty of Engineering 64 90 17 36 81 64% 126 31
Automation, Instrumentation and Control 6 6 6 100% 6 32
Building Construction 1 3 1 33% 3 31
Industrial Design 4 9 4 44% 9 36
Biomedical Engineering 7 15 7 47% 15 29
Occupational Safety and Hygiene Engineering 5 8 5 63% 8 34
Environmental Engineering 6 11 6 55% 11 32
Electrical and Computer Engineering 5 9 5 56% 9 29
M M2 M+M2 M MF M MF M M/MF (%) MF Age average Industrial Maintenance 1 3 1 33% 3 33
Computational Methods in Science and
Engineering 1 1 1 100% 1 37
Environment Planning and Urban Project 4 5 4 80% 5 35
Buildings Rehabilitation 5 9 5 56% 9 29
Communication Networks and Services 2 2 2 100% 2 30
Multimedia Technology 7 9 7 78% 9 32
Transports 2 4 2 50% 4 35
Faculty of Pharmacy 4 15 2 6 6 29% 21 30
Clinical Analyses 2 6 2 33% 6 30
Quality Control 2 6 2 33% 6 28
Environmental Analytical Chemistry 3 0% 3 31
Pharmaceutical Technology 2 6 2 33% 6 33 Faculty of Arts 14 39 2 14 34% 41 36 African Studies 7 11 7 64% 11 42 German Studies 1 0% 1 32 Anglo-American Studies 1 0% 1 51 Contemporary History 2 4 2 50% 4 28 History of Education 1 6 1 17% 6 39
History of Art in Portugal 2 6 2 33% 6 31
Linguistics 1 0% 1 38
Comparative Literature and Culture 2 0% 2 39
Modern and Contemporary Portuguese
Literature 2 5 2 40% 5 35
Sociology: Contemporary Portuguese Society,
Structures and Dynamics 2 0% 2 29
Terminology and Translation 1 0% 1 28
Drama Text 1 0% 1 44 Faculty of Medicine 2 4 15 54 17 29% 58 32 Bioethics 1 8 1 13% 8 31 Forensic Sciences 4 11 4 36% 11 34 Epidemiology 3 0% 3 36 Emergency Medicine 2 2 2 100% 2 39
Medicine and Molecular Oncology 4 21 4 19% 21 29
Molecular Oncology 2 0% 2 28
Public Health 6 11 6 55% 11 33
Faculty of Dental Medicine 3 5 3 60% 5 34
M M2 M+M2
M MF M MF M M/MF
(%)
MF Age
average
Faculty of Psychology and Education Science 8 56 1 16 9 13% 72 32
Education Sciences 2 18 1 2 11% 19 36
Development Studies in Social and Educational
Sciences 3 0% 3 31
Psychology 6 35 6 17% 35 32
Psychology Topics 1 15 1 7% 15 25
Institute of Biomedical Sciences Abel Salazar 3 39 3 8% 39 36
Nursing Sciences 1 14 1 7% 14 39
Sea Sciences – Marine Resources 1 5 1 20% 5 33
Social Service Sciences 1 0% 1 30
Forensic Medicine 8 0% 8 33
Oncology 1 11 1 9% 11 35
U.Porto Total 190 487 89 282 279 36% 769 31
Source: FAC – RAIDES/DIMAS
Specialisation graduates 2007/2008
Chart 13: Number of Specialisation graduates in 2008, per age
1 28 40 34 27 24 20 72 37 17 22 25 32 0 10 20 30 40 50 60 70 80 0% 10% 20% 30% 40% 50% 60% 70% 80% 90% 100%
Chart 14: Number of Specialisation graduates in 2008, per grades
5 8 17 35 60 76 66 67 21 1 1 14 7 1 0 10 20 30 40 50 60 70 80 1 0 1 1 1 2 1 3 1 4 1 5 1 6 1 7 1 8 1 9 A p p ro v e d G o o d G o o d , w it h d is ti n c ti o n V e ry G o o dChart 15: Number of Specialisation graduates in 2008, per no. of enrolments
292 51 20 11 5 0 50 100 150 200 250 300 350 1 2 3 5 7 0% 10% 20% 30% 40% 50% 60% 70% 80% 90% 100%
Table 20: Number of Specialisation graduates, per gender and faculty/school (2008)
M M/MF (%) MF Faculty of Sciences 0% 8 Faculty of Law 20 49% 41 Faculty of Engineering 3 75% 4 Faculty of Arts 25 18% 142 Faculty of Medicine 73 50% 146Faculty of Dental Medicine 1 25% 4
Faculty of Psychology and Education Science 3 9% 34
U.Porto Total 125 33% 379
Source: FAC – RAIDES/DIMAS
Table 21: Number of Specialisation graduates, per nationality and faculty/school (2008)
FCUP FDUP FEUP FLUP FMUP FMDUP FPCEUP U.Porto
Total Portugal 8 41 4 140 142 4 33 372 Spain 4 4 Belgium 1 1 France 1 1 Venezuela 1 1 Total 8 41 4 142 146 4 34 379
Table 22: Number of Specialisation graduates, per gender, age and programme (2008)
M M/MF (%) MF Age
average
Faculty of Sciences 0% 8 32
Mathematics for Teachers 0% 8 32
Faculty of Law 20 49% 41 33
Local Authorities Law 8 35% 23 34
Tax Law 12 67% 18 32
Faculty of Engineering 3 75% 4 35
Electrical and Computer Engineering 1 100% 1 33
Mechanical Engineering 0% 1 28 Information Management 1 100% 1 43 Industrial Maintenance 1 100% 1 35 Faculty of Arts 25 18% 142 28 Teaching 23 18% 125 28 Translation 2 12% 17 28 Faculty of Medicine 73 50% 146 35
Climatology and Hydrology 9 41% 22 34
Health Education 0% 13 35
Pain Medicine 8 36% 22 33
Sports Medicine 21 72% 29 30
Occupational Medicine 21 62% 34 41
Orthodontics: Basis, Fundaments and Practice 7 44% 16 31
Oral and Extra-oral Rehabilitation with Osseointegrated
Implants 7 70% 10 36
Faculty of Dental Medicine 1 25% 4 29
Periodontology 1 25% 4 29
Faculty of Psychology and Education Science 3 9% 34 36
Political Psychology 3 9% 34 36
U.Porto Total 125 33% 379 32
Doctorate graduates 2007/2008
Chart 16: Number of Doctorate graduates in 2008, per age
5 9 18 79 50 43 13 26 0 10 20 30 40 50 60 70 80 90 27 28 29 30 - 34 35 - 39 40 - 44 45 - 49 >=50 0% 10% 20% 30% 40% 50% 60% 70% 80% 90% 100%
Chart 17: Number of Doctorate graduates in 2008, per grades
239 100 150 200 250 300
Chart 18: Number of Doctorate graduates in 2008, per no. of enrolments
3 2 7 48 51 50 48 14 9 5 6 0 10 20 30 40 50 60 1 2 3 4 5 6 7 8 9 10 >10 0% 10% 20% 30% 40% 50% 60% 70% 80% 90% 100%Table 23: Number of Doctorate graduates, per gender, age and faculty/school (2008)
D D3 D+D3
M MF M MF M M/MF
(%)
MF
Faculty of Architecture 2 3 2 67% 3
Faculty of Fine Arts 2 2 2 100% 2
Faculty of Sciences 14 33 14 42% 33
Faculty of Nutrition and Food Science 1 2 1 50% 2
Faculty of Sport 7 11 7 64% 11 Faculty of Economics 10 13 10 77% 13 Faculty of Engineering 37 61 2 3 39 61% 64 Faculty of Pharmacy 2 9 2 22% 9 Faculty of Arts 11 20 11 55% 20 Faculty of Medicine 10 16 10 63% 16
Faculty of Psychology and Education Science 2 15 2 13% 15
Institute of Biomedical Sciences Abel Salazar 22 55 22 40% 55
U.Porto Total 120 240 2 3 122 50% 243
Table 24: Number of Doctorate graduates, per nationality and faculty/school (2008)
FAUP FBAUP FCUP FCNAUP FADEUP FEP FEUP FFUP FLUP FMUP FPCEUP ICBAS U.Porto Total Portugal 3 2 31 1 6 13 58 9 19 16 15 53 226 Brazil 1 1 5 3 10 Thailand 1 2 3 Colombia 1 1 France 1 1 Mozambique 1 1 Romania 1 1 Total 3 2 33 2 11 13 64 9 20 16 15 55 243
Table 25: Number of Doctorate graduates, per gender, age and programme/field of knowledge
(2008)
D D3 D+D3 M MF M MF M M/MF (%) MF Age average Faculty of Architecture 2 3 2 67% 3 38 Architecture 2 3 2 67% 3 38Faculty of Fine Arts 2 2 2 100% 2 51
Communication Design 2 2 2 100% 2 51 Faculty of Sciences 14 33 14 42% 33 34 Landscape Architecture 1 0% 1 34 Astronomy 2 3 2 67% 3 30 Biology 2 8 2 25% 8 35 Agricultural Sciences 1 0% 1 30 Computer Sciences 2 2 2 100% 2 36
Environmental Sciences and Technology 2 0% 2 34
Geographical Engineering 1 0% 1 40 Physics 1 1 1 100% 1 29 Geology 1 1 1 100% 1 35 Mathematics 1 1 1 100% 1 32 Applied Mathematics 2 4 2 50% 4 37 Chemistry 3 8 3 38% 8 31
Faculty of Nutrition and Food Science 1 2 1 50% 2 34
Human Nutrition 1 2 1 50% 2 34 Faculty of Sport 7 11 7 64% 11 45 Sports Science 7 11 7 64% 11 45 Faculty of Economics 10 13 10 77% 13 39 Business Sciences 5 7 5 71% 7 37 Economics 5 6 5 83% 6 41 Faculty of Engineering 37 61 2 3 39 61% 64 36 Engineering Sciences 7 15 7 47% 15 37 Biomedical Engineering 1 1 1 100% 1 36 Civil Engineering 3 8 3 38% 8 36
Electrical and Computer Engineering 10 14 1 10 67% 15 37
Industrial Engineering and Management 1 1 1 1 2 100% 2 32
Informatics Engineering 1 0% 1 38
Mechanical Engineering 9 9 9 100% 9 37
Chemical and Biological Engineering 7 13 7 54% 13 34
D D3 D+D3 M MF M MF M M/MF (%) MF Age average Pharmacology 1 0% 1 38 Analytical Chemistry 1 3 1 33% 3 30 Pharmaceutical Technology 1 3 1 33% 3 37 Toxicology 1 0% 1 27 Faculty of Arts 11 20 11 55% 20 44
Medieval and Renaissance Studies 1 1 1 100% 1 32
Arts 10 19 10 53% 19 44
Faculty of Medicine 10 16 10 63% 16 37
Human Biology 5 10 5 50% 10 33
Medicine 5 5 5 100% 5 44
Public Health 1 0% 1 34
Faculty of Psychology and Education Science 2 15 2 13% 15 39
Psychology 2 15 2 13% 15 39
Institute of Biomedical Sciences Abel Salazar 22 55 22 40% 55 38
Biomedical Sciences 9 26 9 35% 26 31
Nursing Sciences 6 12 6 50% 12 45
Aquatic Sciences 1 3 1 33% 3 33
Social Service Sciences 1 0% 1 59
Medical Sciences 5 9 5 56% 9 47
Veterinary Sciences 1 0% 1 33
Mental Health 1 3 1 33% 3 46
U.Porto Total 120 240 2 3 122 50% 243 38