José Filipe
Miranda Melo
CARACTERIZAÇÃO DA RESPOSTA CÍCLICA DE
ELEMENTOS DE BETÃO ARMADO COM
ARMADURA LISA
CHARACTERISATION OF THE CYCLIC RESPONSE
OF REINFORCED CONCRETE ELEMENTS WITH
PLAIN BARS
José Filipe
Miranda Melo
CARACTERIZAÇÃO DA RESPOSTA CÍCLICA DE
ELEMENTOS DE BETÃO ARMADO COM
ARMADURA LISA
CHARACTERISATION OF THE CYCLIC BEHAVIOUR
OF REINFORCED CONCRETE ELEMENTS WITH
PLAIN BARS
Tese apresentada à Universidade de Aveiro para cumprimento dos requisitos necessários à obtenção do grau de Doutor em Engenharia Civil, realizada sob a orientação científica do Prof. Doutor Humberto Varum, Professor Catedrático do Departamento de Engenharia Civil da Faculdade de Engenharia da Universidade do Porto, e coorientação da Prof. Doutora Tiziana Rossetto, Professora Catedrática do Department of Civil, Environmental & Geomatic Engineering da University College London.
Apoio financeiro da FCT e do FSE no âmbito do III Quadro Comunitário de Apoio.
o júri
presidente Prof. Doutor Armando da Costa Duarte
professor catedrático da Universidade de Aveiro
Prof. Doutor Humberto Varum
professor catedrático da Faculdade de Engenharia da Universidade do Porto
Prof. Doutor Aníbal Costa
professor catedrático da Universidade de Aveiro
Prof. Doutor António Arêde
professor associado da Faculdade de Engenharia da Universidade do Porto
Prof. Doutor José Sena Cruz
professor associado da Escola de Engenharia da Universidade do Minho
Prof. Doutor Hugo Rodrigues
professor adjunto da Escola Superior de Tecnologia e Gestão de Leiria do Instituto Politécnico de Leiria
agradecimentos
acknowledgements
Firstly, I would like to express my gratefulness to Professor Humberto Varum, supervisor of this thesis, who has been coordinating my academic career since the beginning. I also thank him for the constant motivation, friendship and dedication.
To Professor Tiziana Rossetto, co-supervisor of this thesis, for her guidance, friendship and encouragement, especially when I was at University College London for one year.
To Professor Aníbal Costa, for his advices in the definition of the experimental campaign.
To Professor Hugo Rodrigues, for his friendship, motivation and assistance in the numerical modelling.
To Eng. Randolph Borg, for his support, friendship and assistance in the experimental testing campaign.
To Eng. Renato Garcia, Eng. Silvia Louro and Eng. Diogo Mariano, for their friendship and assistance in the experimental programme.
To the staff of the Civil Engineering Laboratory at the University of Aveiro, for the support in the preparation and development of the testing campaign.
To Fundação para a Ciência e a Tecnologia, for the financial support provided in the form of the PhD grant with reference SFRH/BD/62110/2009.
To University College London for hosting me during one year of my PhD studies. To my wife Tânia, for her constant encouragement, friendship, patience and love. My academic achievements have been much harder without her support. Finally, to my parents and family, for their unconditional support and
palavras-chave edifícios existentes de betão armado, armadura lisa, escorregamento, ensaios de arrancamento, ensaios cíclicos, pilares, nós viga-pilar, modelação numérica.
resumo Sismos recentes comprovam a elevada vulnerabilidade dos edifícios existentes
de betão armado. A resposta das estruturas aos sismos é fortemente condicionada pelas características da aderência aço-betão, que exibe
degradação das propriedades iniciais quando sujeitas a carregamentos cíclicos e alternados. Este fenómeno é ainda mais gravoso para elementos com armadura lisa, predominantes na maioria das estruturas construídas até à década de 70 nos países do sul da Europa. A prática corrente de conceção, dimensionamento e pormenorização das estruturas antigas leva a que tenham características de comportamento e níveis de segurança associados não compatíveis com as exigências atuais. Os estudos realizados sobre o comportamento cíclico de elementos estruturais de betão armado com
armadura lisa são ainda insuficientes para a completa caracterização deste tipo de elementos.
Esta tese visou a caraterização da relação tensão de aderência versus escorregamento para elementos estruturais com armadura lisa e o estudo da resposta cíclica de pilares e nós viga-pilar de betão armado com armadura lisa. Foram realizados dez séries de ensaios de arrancamento (nove monotónicos e um cíclico) em provetes com varões lisos. Os resultados destes ensaios permitiram propor novas expressões empíricas para a estimativa dos
parâmetros usados num modelo disponível na literatura para representação da relação tensão de aderência versus escorregamento. É ainda proposto um novo modelo monotónico para a relação tensão de aderência versus escorregamento que representa melhor a resposta após a resistência máxima de aderência. Uma campanha de ensaios unidirecionais em pilares e nós viga-pilar foi também realizada com o objetivo principal de caracterizar o comportamento cíclico deste tipo de elementos. No total foram realizados oito ensaios em pilares, sete ensaios em nós viga-pilar interiores e seis ensaios em nós viga-pilar exteriores representativos de estruturas antigas de betão armado com armadura lisa. Os resultados experimentais permitiram avaliar a influência do escorregamento e estudar o mecanismo de corte em nós e a evolução dos danos para elementos com armadura lisa. Com base nos resultados experimentais foi proposta uma adaptação na expressão do Eurocódigo 8-3 para o cálculo da capacidade última de rotação de elementos com armadura lisa.
Foi também desenvolvido um estudo paramétrico, com diferentes estratégias de modelação não linear, para a simulação da resposta de pilares considerando o escorregamento da armadura lisa. Por último, foi proposto um novo modelo
keywords old reinforced concrete structures, plain reinfrocing bars, bond-slip, pull-out tests, cyclic tests, columns, beam-column joints, numerical modelling.
abstract Recent earthquakes have shown the significant vulnerability of existing
reinforced concrete buildings. The seismic response of structures is largely conditioned by the bond-slip properties that may experience an accelerated degradation under cyclic loading. The influence of this effect can be even larger for elements with plain reinforcing bars, as typically used in structures built before the 1970s in Southern European countries. The principles, design and practice adopted in the past do not guarantee that the existing reinforced concrete structures meet performance requirements recommended in modern codes. The available studies on the cyclic behaviour of reinforced concrete elements with plain reinforcing bars are still limited.
This thesis intended to contribute for the characterization of the bond-slip relationship for plain reinforcing bars and to study of the cyclic response of columns and beam-column joints reinforced with plain bars representative of existing building structures.
Ten sets of pull-out tests (nine monotonic and one cyclic) were performed on specimens built with plain bars, which allowed to propose new empirical expressions for some parameters adopted in bond-slip models available in the literature for plain bars. Also, a new monotonic bond-slip model was proposed better representing the post-peak strength bond-slip relationship.
An experimental campaign of unidirectional tests on full-scale columns and beam-column joints was carried out to characterize their cyclic response. In total eight columns, seven interior beam-column joints and six exterior beam-column joints were tested, representing old reinforced concrete building structures. The experimental results confirms the influence of the reinforcing bars’ slippage and allowed to better understand the shear mechanism in the joints and damage evolution of elements with plain reinforcing bars. Based on the experimental results, it was proposed a modification to the Eurocode 8-3 expression used to calculate the ultimate rotation capacity of elements with plain reinforcing bars. A comparative study of different strategies for the non-linear numerical modelling of columns taking into account the slippage was also developed. Finally, a new simplified tri-linear steel model was proposed that includes the effect of slippage of plain reinforcing bars.
Table of Contents ... i
List of Figures ... v
List of Tables ... ix
CHAPTER 1 - Introduction, objectives and organization of the thesis .... 1
1.1 Motivation and introduction ... 1
1.2 Objectives and methodology ... 3
1.3 Organisation of the thesis ... 4
CHAPTER 2 - Experimental study of bond-slip in RC structural
elements with plain bars ... 7
2.1 Abstract ... 7
2.2 Introduction ... 8
2.3 Previous work on bond-slip ... 9
2.3.1 Factors affecting bond-slip ... 9
2.3.2 Review of bond-slip models ... 10
2.3.3 A critical gap... 12
2.4 Experimental campaign, materials characterisation and testing setup ... 13
2.5 Results and comparison with available models ... 16
2.5.1 Monotonic tests ... 16
2.5.2 Cyclic tests ... 18
2.5.3 Summary of main results ... 19
2.6 Improved constitutive model for the bond-slip relationship and empirical expressions for the parameters involved ... 20
2.6.1 Fundamentals and formulation of the proposed model and empirical expressions ... 20
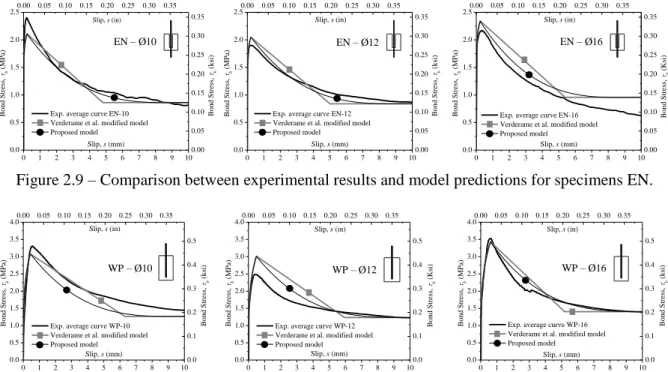
2.6.2 Comparison of the model predictions with the experimental results ... 25
2.7 Conclusions ... 27
2.8 References ... 28
CHAPTER 3 - Experimental cyclic behaviour of RC columns with plain
bars ... 31
3.1 Abstract ... 31
3.2 Introduction ... 32
3.3 Experimental campaign ... 34
3.3.1 Specimens detailing and materials properties... 34
3.4 Experimental results and discussion ... 38
3.4.1 Force-drift response ... 39
3.4.2 Dissipated energy evolution and equivalent damping versus displacement ductility ... 42
3.4.3 Ultimate rotation capacity ... 47
3.4.3.1 Experimental results ... 47
3.4.3.2 Proposed correction factor to EC8-3 ... 50
3.4.4 Damage state ... 54
3.4.5 HRC-damage index ... 55
3.4.6 Displacement components ... 57
3.5 Conclusions ... 59
3.6 References ... 61
CHAPTER 4 - Cyclic behaviour of interior beam-column joints
reinforced with plain bars ... 65
4.1 Abstract... 65
4.2 Introduction ... 66
4.3 Specimens detailing, material properties and test setup ... 67
4.3.1 Detailing of joint specimens ... 67
4.3.2 Test setup, loading conditions and monitoring ... 70
4.4 Experimental results and discussion ... 71
4.4.1 Global force-drift response ... 72
4.4.2 Dissipated energy evolution ... 75
4.4.3 Displacement ductility and equivalent damping ... 79
4.4.4 Final damage pattern ... 83
4.4.5 HRC damage index ... 84
4.4.6 Displacement components ... 86
4.4.7 Joint shear capacity ... 89
4.5 Conclusions ... 92
4.6 References ... 94
CHAPTER 5 - Cyclic tests on exterior beam-column joints
non-seismically designed ... 97
5.1 Abstract... 97
5.2 Introduction ... 98
5.3 Specimens detailing, material properties and test setup ... 99
5.3.1 Detailing of joint specimens ... 99
5.3.2 Test setup, loading conditions and monitoring ... 101
5.4 Experimental results and discussion ... 103
5.4.1 Global force-drift response and strength degradation ... 103
5.4.2 Dissipated energy evolution ... 106
5.4.3 Displacement ductility and equivalent damping ... 109
5.4.4 Final damage state ... 113
5.4.5 HRC damage index ... 114
5.4.6 Displacement components ... 115
5.4.7 Joint shear strength ... 119
5.6 References ... 123
CHAPTER 6 - Numerical modelling of RC columns and a new steel
model for elements with plain bars ... 127
6.1 Abstract ... 127
6.2 Introduction ... 128
6.3 Numerical modelling of RC columns under cyclic loading ... 129
6.3.1 Specimens detailing, material properties and loading conditions ... 129
6.3.2 Numerical modelling with OpenSees ... 131
6.3.2.1 NonlinearBeamColumn element ... 131
6.3.2.2 BeamWithHinges element ... 132
6.3.2.3 Zero-length section element ... 132
6.3.2.4 Material models adopted ... 133
6.3.3 Numerical modelling with SeismoStruct ... 134
6.4 Numerical results ... 135
6.4.1 Numerical results of the specimen with plain reinforcing bars ... 136
6.4.2 Numerical results of the specimen with deformed reinforcing bars ... 138
6.5 A new simplified tri-linear reinforcing steel model for plain bars including the slippage ... 141
6.5.1 Assumptions and calibration of the proposed simplified model ... 141
6.5.2 Numerical validation of the proposed model... 143
6.6 Conclusions ... 144
6.7 References ... 146
CHAPTER 7 - Conclusions and future work ... 149
7.1 Conclusions ... 149
7.2 Future work ... 151
L
IST OF
F
IGURES
CHAPTER 2 - Experimental study of bond-slip in RC structural elements with plain bars
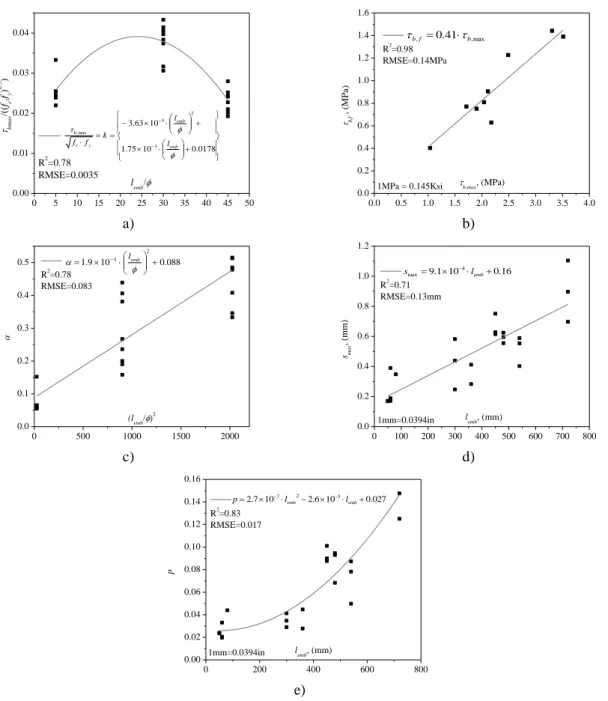
Figure 2.1 – Bond-slip relationship for hot rolled reinforcing bars adapted from: a) CEB-217 and CEB-F (plain bars); and b) Verderame et al. (plain bars) and Eligehausen et al. (deformed bars). ... 11 Figure 2.2 – Testing setup: a) schematics; b) general view; fixing elements and monitoring details for specimens c) EN and d) WP and SP. ... 16 Figure 2.3 – Comparison between experimental results and existing curves for specimens EN. ... 17 Figure 2.4 – Comparison between experimental results and existing curves for specimens WP. ... 18 Figure 2.5 – Comparison between experimental results and existing curves for specimens SP. ... 18 Figure 2.6 – Cyclic test results (EN-C12) and comparison with results of monotonic tests and empirical model. ... 19 Figure 2.7 – Bond-slip models: a) Verderame et al. modified model; b) proposed model. 22 Figure 2.8 – Relationship between the model parameters and the material properties and
geometrical characteristics: a) τb,max; b) τb,f; c) α; d) smax; and e) p. ... 23
Figure 2.9 – Comparison between experimental results and model predictions for specimens EN. ... 26 Figure 2.10 – Comparison between experimental results and model predictions for specimens WP. ... 26 Figure 2.11 – Comparison between experimental results and model predictions for specimens SP. ... 26
CHAPTER 3 - Experimental cyclic behaviour of RC columns with plain bars
Figure 3.1 – Geometry, dimensions and reinforcement detailing of the specimens. ... 35 Figure 3.2 – Test apparatus: a) support and loading conditions idealized and imposed lateral displacement history; b) general view; c) test setup schematics; and d) monitoring scheme. ... 38 Figure 3.3 – Lateral force versus drift: a) CPA-3 versus CD; b) CPA-3 versus CPB; c) CPA-3 versus CPA-1; d) CPA-3 versus CPC; e) CPC versus CPD; and f) CPA-3 versus CPE and CPF. ... 40
Figure 3.4 – Force-drift envelopes for all column specimens. ... 41 Figure 3.5 – Hysteretic dissipated energy evolutions. ... 43 Figure 3.6 – Bilinear approach method adopted to find the yield displacement. ... 44 Figure 3.7 – Equivalent damping-displacement ductility diagrams: a) experimental results and fitted curves; and b) comparison between the experimental results and equations proposed by other authors. ... 45 Figure 3.8 – Comparison between the experimental equivalent damping-displacement results and the equations proposed by other authors. ... 47 Figure 3.9 – Comparison between the correction coefficient present in Corrigenda of
EC8-3 and the proposed by Ricci et al. ... 51 Figure 3.10 – Prediction of the ultimate rotation capacity of columns with different correction coefficients: a) Corrigenda EC8; b) Corrigenda EC8 considering the plain bars correction; c) Ricci et al. correction; and d) proposed correction. .. 53 Figure 3.11 – Damage state at the end of the tests (top face of the specimens) ... 55 Figure 3.12 – HRC-damage index curve and experimental observations ... 57 Figure 3.13 – Top displacement components for specimens: a) CPA-3; and b) CPB. ... 58
CHAPTER 4 - Cyclic behaviour of interior beam-column joints reinforced with plain bars
Figure 4.1 – Specimens (geometry, dimensions and reinforcement detailing). ... 68 Figure 4.2 – Test setup and monitoring: a) support and loading conditions idealized and imposed lateral displacement history; b) general view; c) test setup schematics; and d) monitoring scheme. ... 71 Figure 4.3 – Lateral force-drift relationships: a) IPA-1 versus ID; b) IPA-1 versus IPB; c) IPA-1 versus IPD; d) IPA-1 versus IPE; e) IPA-1 versus IPF; and f) IPA-1 versus IPA-2. ... 73 Figure 4.4 – Experimental force-drift envelopes. ... 74 Figure 4.5 – Evolutions of the hysteretic dissipated energy. ... 75 Figure 4.6 – Contribution to the total dissipated energy of different components: joint, beams and columns. ... 78 Figure 4.7 – Equivalent damping-displacement ductility diagrams. ... 81 Figure 4.8 – Equivalent damping-displacement ductility diagrams: comparison between all experimental results and curves fitted to experimental results of other authors for elements with plain reinforcing bars. ... 83 Figure 4.9 – Final damage state for the top face of the specimens. ... 84 Figure 4.10 – HRC-damage index curve for bare non-ductile MRF and experimental observations ... 85
Figure 4.11 – Contribution to the total lateral displacement of the different deformation mechanisms: columns shear, linear elastic bending in beams and columns, non-linear bending in beams and columns, joint relative rotation and joint shear distortion. ... 88
CHAPTER 5 - Cyclic tests on exterior beam-column joints non-seismically designed
Figure 5.1 – Specimens (geometry, dimensions and reinforcement detailing). ... 100 Figure 5.2 – Test-setup and monitoring: a) support and loading conditions idealized and imposed lateral displacement history; b) general view; c) test setup schematics; and d) monitoring scheme. ... 102 Figure 5.3 – Lateral force-drift relationships: a) TPA-2 versus TD; b) TPA-2 versus
TPB-2; c) TPA-2 versus TPC; and d) TPA-1 versus TPB-1. ... 104 Figure 5.4 – Experimental force-drift envelopes. ... 105 Figure 5.5 – Strength degradation: a) between the first and second cycles; and b) between the first and third cycles. ... 106 Figure 5.6 – Evolutions of the hysteretic dissipated energy. ... 107 Figure 5.7 – Contribution to the total dissipated energy of different components: joint, beams and columns. ... 109 Figure 5.8 – Bilinear approach method adopted to find the yield displacement. ... 110 Figure 5.9 – Equivalent damping-displacement ductility diagrams. ... 111 Figure 5.10 – Equivalent damping-displacement ductility diagrams: comparison between all experimental results and curves fitted to experimental results of other authors for elements with plain reinforcing bars. ... 112 Figure 5.11 – Final damage state for the top face of the specimens... 114 Figure 5.12 – HRC-damage index curve for bare non-ductile MRF and experimental observations ... 115 Figure 5.13 – Contribution to the total lateral displacement of the different deformation mechanisms: columns shear, linear elastic bending in columns and beam, non-linear bending in columns and beam, joint relative rotation and joint shear distortion. ... 118 Figure 5.14 – Nominal principal tensile stresses. ... 122
CHAPTER 6 - Numerical modelling of RC columns and a new steel model for elements with plain bars
Figure 6.1 – Column specimens: a) dimensions and reinforcement detailing; b) cross-sections. ... 130 Figure 6.2 – a) Support and loading conditions idealized; b) imposed lateral displacement history. ... 130
Figure 6.3 – NonlinearBeamColumn element with spread of plasticity and five integration points. ... 131 Figure 6.4 – Linear element and zero-length section element. ... 132 Figure 6.5 – Comparison between the experimental and numerical force-drift diagrams of specimen CPA-3: a), b) and c) numerical results considering elements with distributed plasticity; d), e) and f) numerical results considering elements with plastic hinges. ... 137 Figure 6.6 – Numerical and experimental dissipated energy evolutions of specimen CPA-3.
... 138 Figure 6.7 – Comparison between the experimental and numerical force-drift diagrams of specimen CD: a), b) and c) numerical results considering elements with distributed plasticity; d), e) and f) numerical results considering elements with plastic hinges. ... 139 Figure 6.8 – Dissipated energy evolutions of specimen CD (numerical and experimental results). ... 141 Figure 6.9 – Idealized stress distribution in a section subjected to bending and axial load.
... 142 Figure 6.10 – Idealized stress-strain diagrams: a) concrete; and b) reinforcing steel ... 142 Figure 6.11 – Numerical (with and without slippage) and experimental force-displacement relationships: a) column CPA-3; and b) column CD ... 144
L
IST OF
T
ABLES
CHAPTER 2 - Experimental study of bond-slip in RC structural elements with plain bars
Table 2.1 – Resume of the main outcomes of previous experimental studies on bond-slip
mechanism of plain reinforcing bars. ... 12
Table 2.2 – Specimens. ... 14
Table 2.3 – Mean values of the material mechanical properties. ... 15
Table 2.4 – Mean values of the parameters defining the bond-slip relationship. ... 20
Table 2.5 – Errors (ratio model/experimental) of the both models parameters estimative. 27 CHAPTER 3 - Experimental cyclic behaviour of RC columns with plain bars Table 3.1 – Mean values of the materials (concrete and steel) mechanical properties ... 37
Table 3.2 – Force and drift for the maximum strength and ultimate points. ... 41
Table 3.3 – Yield force, yield drift, equivalent damping and displacement ductility at ultimate point. ... 45
Table 3.4 – Ratios between the experimental observed and the predicted ultimate rotation capacity. ... 49
Table 3.5 – Typical damage expected in non-ductile MRF according to HRC-scale. ... 56
CHAPTER 4 - Cyclic behaviour of interior beam-column joints reinforced with plain bars Table 4.1 – Concrete and steel mechanical properties (mean values) ... 70
Table 4.2 – Force and drift for the maximum strength and ultimate points. ... 74
Table 4.3 – Yield force, yield drift, displacement ductility at ultimate point and equivalent damping. ... 80
Table 4.4 – Equivalent damping-displacement ductility relationships... 81
Table 4.5 – Maximum shear forces and maximum principal tensile stress in the joint. ... 91
CHAPTER 5 - Cyclic tests on exterior beam-column joints non-seismically designed Table 5.1 – Concrete and steel mechanical properties (mean values) ... 101
Table 5.2 – Force and drift for the maximum strength and ultimate points. ... 105 Table 5.3 – Yield force, yield drift, displacement ductility and equivalent damping at
Table 5.4 – Equivalent damping-displacement ductility relationships. ... 112 Table 5.5 – Maximum shear force ratios. ... 121
CHAPTER 6 - Numerical modelling of RC columns and a new steel model for elements with plain bars
Table 6.1 – Mean values of the materials (concrete and steel) mechanical properties ... 130 Table 6.2 – Values adopted for the Concrete02 model parameters. ... 134 Table 6.3 – Values adopted for the Steel02 and Bond_SP01 model parameters. ... 134 Table 6.4 – Experimental to numerical dissipated energy ratio for different levels of imposed drift in specimen CPA-3. ... 138 Table 6.5 – Experimental to numerical dissipated energy ratio for different levels of imposed drift in specimen CD. ... 141
CHAPTER 1
I
NTRODUCTION
,
O
BJECTIVES AND
O
RGANIZATION OF THE THESIS
1.1 M
OTIVATION AND INTRODUCTIONNatural disasters like earthquakes are responsible for large human and material losses. The earthquake damage level depends not only on the seismic magnitude, but also on the structural solution, materials properties, elements’ detailing and soil properties. In the last decades many studies focused on the improvement of the buildings’ seismic performance, particularly for reinforced concrete structures (RC). However, the seismic behaviour of old RC structures is still not completely understood and it is recognised the need for the assessment and strengthening of these structures.
The damage observed in the last earthquakes demonstrates the large vulnerability of RC structures, especially of the existing structures built with plain reinforcing bars. Moreover, a significant number of existing RC buildings are located in areas with high seismic activity and were built before the 1970s, prior to the enforcement of the current seismic design philosophies. Consequently, many of these structures are not provided of adequate ductility and specific detailing for seismic demands. These seismic performance limitations are even more significant when plain reinforcing bars are used, which is commonly found in old RC structures.
The cyclic loads induced by the earthquakes lead to progressive bond degradation, resulting in relative displacement (slippage) between the reinforcing bars and the surrounding concrete, which is frequently addressed as bond-slip. The bond-slip
mechanism is reported as one of the common causes of severe damage and even collapse of RC structures under seismic loading.
In the regions where demands are larger, such as beam-column joints and extremities of the columns, the bond-slip mechanism may have an important contribution to the lateral deformation of the elements and, as a consequence, condition the overall response of the structure. The bond-slip mechanism is caused by the force transfer between reinforcing bars and the surrounding concrete. If bar slippage occurs, the force transfer mechanism is affected and might lead to reduction in stiffness and dissipation energy capacity of the structure.
It is internationally recognised that bar slippage may influence the cyclic behaviour of the RC structures dramatically. However, bond-slip is typically neglected in the numerical analysis of RC structures. Moreover, the specifications of recent RC design codes were developed under the assumption of perfect bond between concrete and steel. As a consequence the seismic behaviour of RC structures built with plain reinforcing bars can be substantially different from theoretical predictions.
In the last years several experimental studies have investigated the cyclic behaviour of RC elements, but few focused on the behaviour of elements designed according to old RC codes. In particular, experimental data on the cyclic behaviour of RC elements with substandard details built with plain reinforcing bars is scarce in comparison with that available for elements with deformed bars. Consequently, the cyclic and post-elastic behaviour of elements with plain bars is still not well known.
The proper characterisation of the cyclic behaviour of RC elements is only possible based on extensive experimental data that covers a wide range of reinforcement detailing, typical geometrical characteristics, material mechanical properties and loading conditions. A broad experimental database representative of the existing structures is essential for the development of empirical and semi-empirical formulas and for the development of models that can be used to represent the cyclic behaviour of RC elements with plain bars. The experimental data is also crucial to calibrate and upgrade numerical models for the adequate simulation of the cyclic behaviour of this type of elements. Essentially, the available numerical models for simulating the bar slippage effects are limited to the
analysis of specific types of elements or too difficult to implement as a consequence of the limited experimental data available.
1.2 O
BJECTIVES AND METHODOLOGYThe main objective of this PhD thesis is the characterisation of the effect of the bond-slip mechanism on the cyclic behaviour of RC elements representative of existing structures built with plain reinforcing bars. In particular, this research aimed to:
i) Identify, based on the literature review, the lacunas in terms of available
experimental results and the knowledge limits regarding the cyclic behaviour of RC structural elements with plain reinforcing bars;
ii) Develop an experimental programme to study at local level the bond-slip
relationship intending to develop an upgraded bond-slip model for plain reinforcing bars;
iii) Contribute to enlarge the existing experimental database on the cyclic behaviour of
RC columns and beam-column joints with plain reinforcing bars, which can be used to develop empirical expressions and to calibrate numerical models that better simulate the cyclic behaviour of this type of structural elements;
iv) Contribute to the understanding of the cyclic behaviour of RC elements built with
plain reinforcing bars by quantifying the influence of the bond-slip mechanism in different parameters and mechanisms of the structural response, such as: the bending and shear deformation contributions for the cyclic response of the elements, the energy dissipation capacity and the damage mechanisms;
v) Develop and calibrate numerical models that take into account the slippage of plain
reinforcing bars;
vi) Compare the conclusions derived in this work with the main outputs from similar
research available in the literature.
The strategy adopted to achieve these objectives can be summarised as follows:
i) Development of a literature review related to: the seismic vulnerability of existing
for seismic safety; and, the available experimental data concerning the cyclic behaviour of RC elements built with plain reinforcing bars;
ii) Preparation and development of an extensive experimental campaign, including:
pull-out tests, RC columns and beam-column joints (interior and exterior), detailed according to the old Portuguese RC codes and built with plain reinforcing bars;
iii) Proposal of empirical expressions for the bond-slip relationship model and proposal
of improvement of Eurocode 8 formula for the ultimate rotation capacity, based on the experimental results on pull-out specimens and on the tests on full-scale RC elements built with plain reinforcing bars;
iv) Development and calibration of numerical non-linear models to simulate the
experimental response of the tested column specimens, investigating the influence of the bond-slip mechanism. Also based on the experimental results and analytical correlations, a new simplified steel model taking into account the bond-slip mechanism is proposed.
1.3 O
RGANISATION OF THE THESISThis thesis has been structured into seven chapters. The main chapters of this thesis corresponds to work that has been published, or submitted, for publication in peer-reviewed journals. This first chapter presents the motivation and introduces the subjects addressed in the thesis. Chapter two reports the experimental results of pull-out tests and the proposed new empirical expressions for the bond-slip relationship between concrete and plain reinforcing bars. In chapters three, four and five are presented and discussed the experimental tests carried out on full-scale RC elements with plain reinforcing bars developed to characterise their cyclic behaviour. Chapter six presents the results of the numerical models developed to simulate the response of columns, considering the bar slippage effect. The last chapter discusses the main conclusions of this research and presents possible future directions of research on this subject. The contents of each chapter are described in further detail in the next paragraphs.
The second chapter presents the results of ten sets of pull-out tests (nine monotonic and one cyclic) performed on specimens built with plain bars. Based on the experimental results, upgraded empirical expressions are proposed for the parameters adopted in one of
the more recent bond-slip models for plain bars available in the literature. The new empirical expressions take into account the concrete compressive strength, rebar yield stress, embedded length and bar diameter. A new monotonic bond-slip model is also proposed, better representing the bond-slip relationship after the peak strength.
Chapter three describes the results of a testing campaign composed of unidirectional cyclic and monotonic tests performed on full-scale columns built with plain bars, without adequate reinforcement detailing for seismic demands. The influence of bond properties, cold joint at the column base, lapping of longitudinal reinforcing bars, amount of reinforcing steel, cross-section dimensions and of the imposed loading history is studied. A correction coefficient of the expressions of EC8-3 for the calculation of the ultimate rotation capacity of columns with plain reinforcing bars is also proposed in this chapter.
The fourth chapter reports the results of cyclic tests carried out on interior full-scale beam-column joints built with plain bars. These joint specimens are also representative of existing reinforced concrete structures, i.e. built without adequate reinforcement detailing for seismic demands. The specimens and the testing campaign were designed and detailed so as to allow the investigation of the influence of bond properties, lapping of the longitudinal bars in columns and beams, bent-up bars in the beams, slab contribution and concrete strength.
The fifth chapter addresses the cyclic and monotonic testing of full-scale RC exterior beam-column joints built with plain reinforcing bars. These specimens are also representative of RC structures built without adequate reinforcement detailing for seismic demands. For these elements, the influence of bond properties, lapping of the longitudinal bars, anchorage of the beam reinforcing bars and loading on the beam-column joints response are investigated.
Chapter six is devoted to the numerical modelling of the cyclic response of two RC columns, one built with deformed bars and the other with plain bars. For each column, different modelling strategies were adopted. The numerical models were built using the OpenSees and SeismoStruct platforms, and were calibrated with the experimental test results presented in Chapter 3. The bond-slip effects were included in the OpenSees models using a simple modelling strategy. A new simplified tri-linear steel material model
that considers slippage of the plain reinforcing bars in RC structural elements is also proposed.
Chapter seven summarises the main conclusions of the present work and outlines possible future research directions.
CHAPTER 2
E
XPERIMENTAL STUDY OF BOND
-
SLIP IN
RC
STRUCTURAL ELEMENTS WITH PLAIN BARS
Melo, J., Rossetto, T., Varum, H. (in press) Experimental study of bond–slip in RC
structural elements with plain bars. Materials and Structures. doi:
http://dx.doi.org/10.1617/s11527-014-0320-9
2.1 A
BSTRACTA considerable number of reinforced concrete buildings in European countries were built before the 1970s according to rules and principles which are now obsolete, and using reinforcing bars with plain surface that do not guarantee proper bond properties. Most existing studies concerning the characterisation of the bond-slip relationship have been carried out on elements built with deformed reinforcing bars. The bond-slip relationship for plain bars is still not well known, and current empirical expressions are found not to take into account all the factors that influence bond-slip performance. This chapter presents the results of ten sets of pull-out tests (nine monotonic and one cyclic) performed on specimens built with hot-rolled plain bars. One additional set of specimens built with deformed bars was tested monotonically to highlight the difference, in terms of bond-slip relationship, between plain and deformed rebars. Based on the experimental results, new empirical expressions are proposed for the parameters adopted in one of the more recent bond-slip models for plain bars available in the literature. The new empirical expressions take into account the concrete compressive strength, rebar yield stress, embedded length and bar diameter, and are an improvement on existing expressions. Finally, a new
monotonic bond-slip model is proposed, which better represents the bond-slip relationship after the peak strength.
2.2 I
NTRODUCTIONIt is recognised that the behaviour of reinforced concrete (RC) structures is conditioned by the bond-slip mechanism between concrete and steel. This mechanism may influence the performance of structures in terms of strength, deformation, ductility, energy dissipation capacity and, eventually, the type and distribution of damage under cyclic loads. For RC structures built before the 1970s, designed according to old codes and built with plain reinforcing bars, the influence of the bond-slip is particularly important. In these types of structures, the bond stress developed at the interface between the concrete and steel is insufficient to avoid the slippage of the bar, and consequently the deformations of the structure are largely increased. This phenomenon is discussed in recent studies carried out on RC elements built with plain bars [1-5].
This chapter aims to study the bond-slip relationship for RC elements built with plain bars and proposes a new bond-slip monotonic model based on experimental results. Empirical expressions are commonly used to estimate the maximum bond stress. With few exceptions (e.g. [6,7]) most of these empirical expressions take into account only the concrete strength neglecting other parameters that also influence the maximum bond stress. Hence, a new empirical expression is proposed to compute the maximum bond stress that considers not only the compressive concrete strength, but also the bar diameter, embedded length and yield stress of the rebar.
The chapter first presents the factors that affect the bond-slip relationship, and the bond-slip constitutive relationships available in the literature. Next the pull-out experiments carried out for this study are described: specimen details, material properties and test setup. Existing bond-slip relationships are compared with the experiments and found to justify the need for empirical equations and model. Finally, a new bond-slip model is proposed that better represents the experimental results obtained in this campaign than other models obtained by other authors.
2.3 P
REVIOUS WORK ON BOND-
SLIP2.3.1 Factors affecting bond-slip
A limited number of studies are available in the literature on bond-slip mechanisms in structural elements with plain bars. Few expressions are also available for the parameters used in the definition of the constitutive bond-slip relationship. In contrast, for deformed reinforcing bars several theoretical models may be found for the interaction mechanisms between steel bars and surrounding concrete [8].
One of the first studies on bond-slip behaviour in RC was conducted by Abrams [9], who describes the results of more than one thousand tests carried out on beams and pull-out specimens with plain and deformed bars. In this testing campaign, different variables were studied, such as bar diameter, embedded length, concrete block dimensions, bar surface, age and concrete mix, anchoring ends and storage conditions. Abrams concluded that the bond between concrete and plain reinforcing bars is influenced in terms of resistance by two main components, adhesive and sliding resistance. Adhesive resistance takes place before the slippage starts and is responsible for about 60% of the maximum bond stress. This ratio does not vary much for a wide range of mixes, ages, bar sizes and conditions of storage. Sliding resistance starts when the relative movement between both materials begins. Another conclusion was that the maximum bond stress is developed for a slip value about 0.25mm (0.01in).
Stoker and Sozen [10] state that the bond-slip on plain reinforcing bars is provided by two mechanisms: i) a physical interlocking between the microscopic, rough steel surface and the surround concrete before the slip starts and ii) a frictional mechanism between two sliding contact surfaces after the original interlocks have sheared off. Stoker and Sozen [10] also state that the bond-slip may be represented by a curve idealized by three linear branches: one vertical to represent the initial interlocking mechanism between steel and concrete, followed by a descending transition linear branch, and one horizontal branch to represent the mechanism of sliding friction. The authors state that both mechanisms are related to the shear strength of concrete. For the interlocking phase, the strength is influenced by the roughness of the steel surface and is independent of the lateral stress. For the frictional phase, the bond strength is influenced by the lateral stress.
Recently, a few studies [7,11-14] have been published that report the results of pull-out tests on specimens with plain reinforcing bars, with the intention to better define the parameters influencing the constitutive bond-slip relationship. Feldman and Barlett [7,13] have carried out around 250 pull-out tests on specimens with plain round and square reinforcing bars. Based on their results they have suggested an empirical expression to compute the maximum bond stress, as a function of the concrete strength, and reinforcing bar section shape (round or square), roughness and diameter. Moreover, Feldman and Barlett [13] propose a simple adhesion-sliding bond model that provides the force distribution along the bar length as a function of the applied load for an idealized bond stress-slip relationship. Based on this model, the bond stresses can be evaluated analytically using the mechanics-based relationships provided between bond stress and slip, slip and bar force, and bar force and bond stress.
2.3.2 Review of bond-slip models
CEB-217 [15] and CEB-FIB [6] report an idealized bond-slip curve for hot rolled plain reinforcing bars, which is shown in Figure 2.1a. The model includes a non-linear initial
branch given by expression (2.1) until smax followed by a second constant branch. smax is
defined as the slip value corresponding to the maximum bond stress. max max , s s b b (2.1)
CEB-217 [15] and CEB-FIB [6] suggest that for plain hot rolled bars: smax = 0.10mm
(0.004in) and the empirical factor α = 0.5. A maximum bond stress (τb,max) equal to
ck
f
30 .
0 is suggested for good bond conditions or 0.15 fck for poor bond conditions,
smax=0.1mm (0.004in) slip, s (mm) b,max= 0.15·fc1/2 b,max= 0.30·fc1/2
Poor bond conditions Good bond conditions
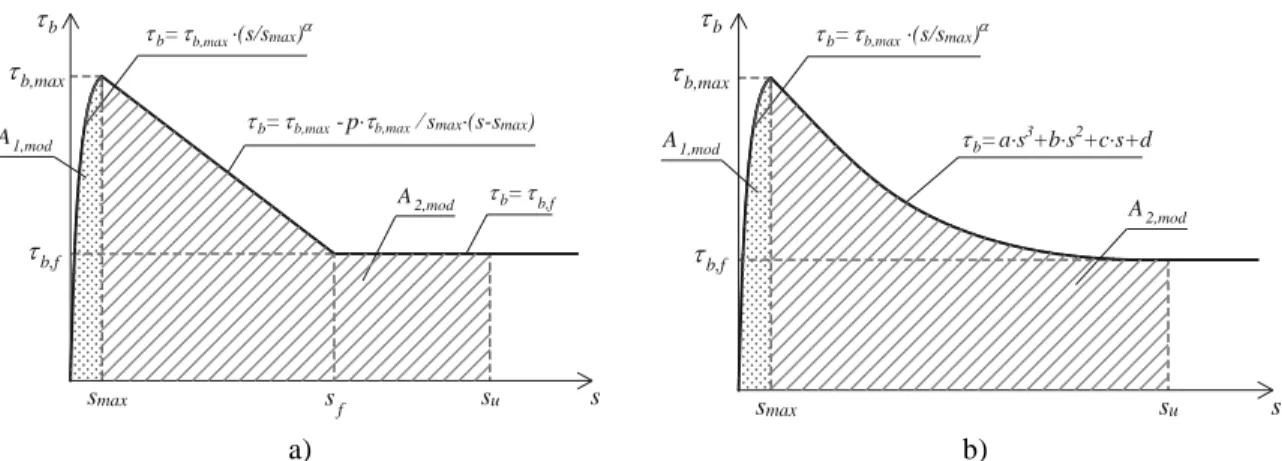
Bo nd s tres s, b (MP a) 1 b,max b,f 1 p·(b,max /smax) smax sf su s b sf
Eligehausen et al. model
Verderame et al. model
s2
(deformed bars)
(plain bars)
(b,max /smax)
a) b)
Figure 2.1 – Bond-slip relationship for hot rolled reinforcing bars adapted from: a) CEB-217 [15] and CEB-FIB [6] (plain bars); and b) Verderame et al. [11] (plain bars) and Eligehausen et al. [16]
(deformed bars).
Verderame et al. [11,12] report the results of a series of monotonic and cyclic pull-out tests with plain round bars. Based on the experimental results, the authors suggest a modification on the bond-slip model proposed by Eligehausen et al. [16] for deformed bars. Basically, the proposed model is similar to the model proposed by Eligehausen et al. [16], but without the plateau (see Figure 2.1b). Verderame et al. [11] have also proposed a new model for the representation of the cyclic response of the steel-concrete interface for elements with plain reinforcing bars.
Based on their experimental results, Verderame et al. [11] proposed the following
parameters for the model: b,max 0.31 fc, smax=0.23mm (0.0091in), α=0.26, b,f 0.43b,max
and p=0.06, where τb,max, smax and α have the same meaning as in the CEB-217 [15] model.
τb,f is the frictional bond stress, fc is the cylindrical concrete compressive strength and p
represents the slope of the softening branch expressed as a function of the secant stiffness
(τb,max/smax). These mean values were obtained from results of pull-out tests carried out on
specimens with 12mm (0.47in) reinforcing bar diameter, with an embedded length equal to 10 times the bar diameter and a mean concrete cylindrical strength equal to 15.9MPa (2.31ksi). In the later experimental campaign, the tests were done under displacement control. Table 2.1 summarises the main outcomes from several previous studies [7,9-13].
Table 2.1 – Resume of the main outcomes of previous experimental studies on bond-slip mechanism of plain reinforcing bars.
Reference No. of
tests Type of tests Output Observations
Abrams [9] 804
Monotonic pull-out tests on round plain bars
c b,max 0.19f max , ,f 0.50 b b
τb,max is reached at smax equals to
0.25mm (0.01in). τb,max is equal to about 19% of fc. The frictional bond stress is approximately 50% of τb,max. Small bar diameters give higher bond strength than the large bars during the early stages. The slippage begins at about 60% of τb,max. Stoker and Sozen [10] 26 Monotonic pull-out tests on round plain wires
τb,max increase approximately linearly
with the bar diameter. The bond strength increase by approximately 10% per 6.9MPa (1Ksi) of concrete compressive strength. Feldman and Barlett [7,13] 252 Monotonic pull-out tests on round and square 16mm (0.63in) and 32mm (1.26in) plain bars
For 16mm round plain bars:
emb y y c b l R R f 5 max , 10 7 . 2 19 . 0 emb y y c f b l R R f 5 , 10 65 . 1 042 . 0
For 32mm round plain bars:
emb y y c b l R R f 5 max , 10 3 . 1 12 . 0 emb y y c f b l R R f 5 , 10 65 . 1 051 . 0
Empirical bond-slip relationship:
) log( 2 3 1 max , , max , , s b f b b f b b τb,max and τb,f are proportional to the
fc for the same group of bars. When the surface roughness increases,
maximum bond stress and the
associate slip increase. τb,max tend to decrease when the bar diameter increase. The bond-slip relationship is
non-linear. Mechanics based
relationships show that bond stress is a function of relative bar slip, slip is a function of bar force, and bar force is a function of bond stress.
Verderame et al. [11,12] 11 Monotonic and cyclic pull-out tests on 12mm (0.47in) round plain bars
For 12mm round plain bars:
c b,max 0.31 f max , ,f 0.43 b b
The maximum bond is proportional to fc. The frictional bond stress corresponds to 43% of the maximum bond. The bond-slip relationship is given as show in Figure 2.1b.
Notes: Ry is the surface roughness; lemb is the embedded length; τb is the bond stress; and s is the slip.
2.3.3 A critical gap
From the studies presented in the previous sections and summarised in Table 2.1, it is clear that bond performance is affected by concrete compressive strength, bar diameter, embedded length, surface roughness, storage conditions and lateral stress parameters. However, only concrete compressive strength is included in almost all the models present
in Section 2.3.2. Moreover, most models consider linear branches after peak strength bond, which do not reflect the shape obtained experimentally. The empirical bond-slip relationship proposed by Feldman and Barlett [7] take into account other factors besides compressive concrete strength. Their empirical relationships are based on 16mm (0.63in) and 32mm (1.26in) bar diameters and show a dependence of bond on bar diameter. However, these particular bars diameters are not very representative of the bar diameters used in the construction of most existing RC buildings in the Mediterranean area, which tend to be smaller [17-19]. Therefore, there appears to be a need for a new empirical bond-slip model for plain bars that includes more of the parameters that influence bond-bond-slip and better represent its behaviour after peak bond strength.
This chapter presents the approach followed to develop this new bond-slip model. Firstly, the experimental campaign of pull-out tests used to generate the empirical data for the new model is presented. Secondly, the experimental results are compared with existing slip relationships (Verderame et al. [11] and by CEB-217 [15]). Finally, a new bond-slip model is proposed in the present chapter that adopts the Verderame et al. [11] shape up to peak but better characterises the descending branch of the bond-slip model. This new empirical model is derived based on the results of 27 experiments. This work has the potential to change how bond-slip is modelled in structural analyses and highlights the need for further experimental work to further refine the model.
2.4 E
XPERIMENTAL CAMPAIGN,
MATERIALSCHARACTERISATION AND TESTING SETUP
An experimental campaign on pull-out tests was carried out in the Department of Civil Engineering at University of Aveiro with the aim of study the bar diameter, embedded length and yield bar stress on bond-slip performance. The campaign consisted of a series of monotonic and cyclic pull-out tests carried out on specimens built with plain bars in order to characterize the bond-slip relationship in old RC structures.
Table 2.2 summarises the nomenclature adopted for the specimens, the details and bar diameter (ϕ) for each test. For each bar diameter and specimen type (EN, WP and SP) studied, a set of three specimens where built. Two additional sets of three EN specimens with 12mm (0.47in) bar diameter were also built. One of these sets was built with
the results for the specimens with plain bars. The other set was built with plain bars, and was used for cyclic pull-out tests (labelled as EN-C12). Hence, in total 33 specimens were tested, 30 under monotonic pull-out and 3 under cyclic pull-out.
The specimens labelled as EN follow the specifications of the standard EN 10080 [20], which define the details and specimen dimensions for pull-out tests. Therefore, in these specimens the embedded length is equal to 5 times the bar diameter (5 ϕ), and the cross-section dimensions of the concrete block are 0.20m × 0.20m (7.94in × 7.94in). To guarantee the bond between concrete and steel for the length specified in the standard, a plastic tube with 0.20m length (7.94in) was used to isolate the bar from the surrounding concrete in the upper part of the concrete block. The cross-section dimensions of specimens WP and SP are 0.25m × 0.25m (9.93in × 9.93in) and the embedded length is equal to 30 ϕ and 45 ϕ, respectively. The embedded length of specimens SP is the length recommended for full straight anchorage of plain bars according to CEB-217 [15]. The embedded length of specimens WP was defined based on the recommendations included in the first Portuguese codes [21,22], but adopting a straight shape, i.e. without hook. All specimens were cast in the horizontal position as specified in EN 10080 [20].
Table 2.2 – Specimens.
Specimen type
EN WP SP
Detailed according to EN 10080 [20]
Straight anchorage with the embedded length
suggested in codes [21,22] but without hook
Full straight anchorage according to CEB-217 [15] Detailing (dimensions in meters, 1m=39.7in) 0.20 0.20 5 Ø 0.10 0.25 30 Ø 0.05 0.25 45 Ø 0.05 Bar diameter, mm (in) 10, 12 and 16 (0.40, 0.47 and 0.64) 10, 12 and 16 (0.40, 0.47 and 0.64) 10, 12 and 16 (0.40, 0.47 and 0.64)
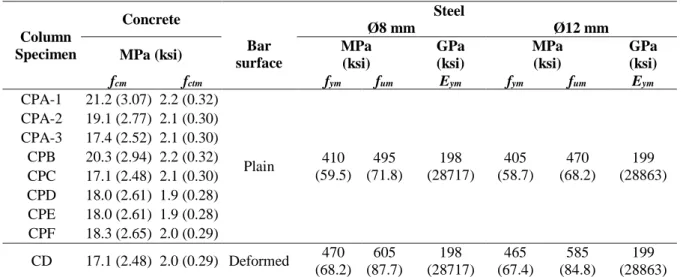
The mean values of the mechanical properties of concrete and steel reinforcement are presented in Table 2.3. Cylinder samples of concrete with dimensions ϕ150mm×300mm (ϕ 5.9in×11.8in) were used for determining the compressive strength. The concrete samples were tested simultaneously with the pull-out tests, and after 90 days of concrete
curing. The grades of the hot-rolled plain and deformed reinforcing bars used in the specimens were A235 and A400NRSD, respectively. For each bar diameter, tensile tests were performed on three specimens according to the standard EN ISO 6892-1 [23]. The mean static values of yield and ultimate stress and young’s modulus for each series of steel specimens are presented in Table 2.3.
Table 2.3 – Mean values of the material mechanical properties.
Concrete Steel fcm, MPa (ksi) Grade Bar diameter, mm (in) fym, MPa (ksi) fum, MPa (ksi) Eym, GPa (ksi) 15.8 (2.3) A235 (plain) 10 (0.39) 427 (62) 501 (73) 201 (29152) 12 (0.47) 405 (59) 470 (68) 199 (28863) 16 (0.63) 525 (76) 581 (84) 200 (29008) A400NRSD (deformed) 12 (0.47) 465 (67) 585 (85) 199 (28863)
The pull-out tests were performed with the setup shown in Figure 2.2. A reaction steel frame supports, in the upper part, the servo-actuator connected to load-cell and to the grip, and at the base a mechanism was installed to fix the specimen. For the tests of specimens EN, the bar slippage was measured with a linear variable differential transformer (LVDT) installed under the concrete block (Figure 2.2c), while for the other specimens the LVDT was mounted at the upper face of the concrete block. The relative displacement measured with the LVDT in the testing setup adopted for specimens WP and SP includes the elongation of the steel bar. To discount this elongation, an extensometer was installed at the bar. The elongation of the bar inside the concrete block of specimens EN was a
maximum of 3% of the smax value. Therefore, measuring of displacements at the loaded end
(specimens WP and SP) or at the unloaded end (specimens EN) are approximately the same.
2 56 0 . vp LVDT Specimen Load cells Servo-actuator Hinge Steel Frame Suport Bar Displ ace me nt LVDT Force = b·Ab Concrete block Support F Bar Steel plate Rubber F c) LVDT Force = b·Ab Concrete block Support F Bar Steel plate F a) b) d)
Figure 2.2 – Testing setup: a) schematics; b) general view; fixing elements and monitoring details for specimens c) EN and d) WP and SP.
The monotonic pull-out tests were carried out under force controlled conditions, with a
load ratio velocity (vp) of (N/s), as specified in CEN EN 10080 [20],
where ϕ is the nominal bar diameter in mm. The cyclic tests were performed under displacement controlled conditions, with a velocity equal to 0.1mm/sec (0.004in/sec).
2.5 R
ESULTS AND COMPARISON WITH AVAILABLE MODELS2.5.1 Monotonic tests
The experimental campaign carried out has contributed to improve knowledge on the monotonic constitutive bond-slip relationship of RC elements with plain reinforcing bars. The interaction between concrete and reinforcing steel bars is usually described by the relationship between bond stress and slip. For the analysis of the experimental results, as has been commonly adopted in previous works (namely in CEB-217 [15] and CEB-FIP [6]), the bond stress was computed considering a constant bond stress distribution along
the embedded bar length. Hence, the bond stress τb is calculated according to equation (2),
where F is the tensile force measured during the test, ϕ is the bar diameter and lemb is the
embedded bar length. In this work it is assumes that smax occurs close to the interface
between the steel bar and concrete block, as commonly adopted in the literature, CEB-FIP [8].
emb b l F (2.2)
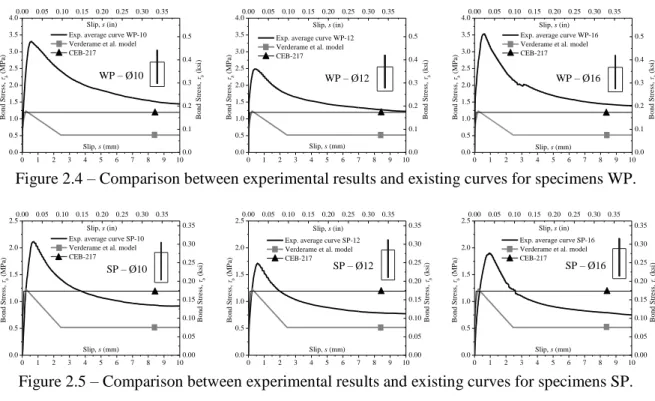
For each testing set, the average curve of the three individual bond-slip curves for each tested specimen was derived. The average curves are compared with the bond-slip relationships proposed by Verderame et al. [11] and by CEB-217 [15], as shown in Figure 2.3 to Figure 2.5, for specimens EN, WP and SP, respectively. The results are represented up to a slip equal to 10mm (0.39in), since after this point the bond-slip relationship becomes approximately constant. Splitting failure were not observed in the tests.
For the comparison with Verderame et al. [11] the mean values of parameters defined in their work were used. For the CEB-217 [15] model, good bond conditions and
plain hot rolled bars were considered, resulting in b,max 0.3 fc, smax0.1mm(0.004in)
and 0.5.
Figure 2.3 also shows the average curve of the specimens built with deformed bars, as well as the CEB-217 [15] law based on the model for deformed bars considering good bond conditions and hot rolled bars. The tests show that the maximum bond stress obtained was approximately 6.6 times larger than the maximum bond stress achieved on the specimens with plain reinforcing bars.
0 1 2 3 4 5 6 7 8 9 10 0.0 0.5 1.0 1.5 2.0 2.5
Exp. average curve EN-10 Verderame et al. model CEB-217 Bond S tre ss, b ( MP a) Slip, s (mm) 0.00 0.05 0.10 0.15 0.20 0.25 0.30 0.35 0.00 0.05 0.10 0.15 0.20 0.25 0.30 0.35 Bond S tre ss, b ( ksi) Slip, s (in) 0 1 2 3 4 5 6 7 8 9 10 0.0 0.5 1.0 1.5 2.0 2.5 Bond S tre ss, b ( MP a) Slip, s (mm)
Exp. average curve EN-12 Verderame et al. model CEB-217 0.00 0.05 0.10 0.15 0.20 0.25 0.30 0.35 0.00 0.05 0.10 0.15 0.20 0.25 0.30 0.35 Bond S tre ss, b ( ksi) Slip, s (in) 0 1 2 3 4 5 6 7 8 9 10 0.0 0.5 1.0 1.5 2.0 2.5 Bond S tre ss, b ( MP a) Slip, s (mm)
Exp. average curve EN-16 Verderame et al. model CEB-217 0.00 0.05 0.10 0.15 0.20 0.25 0.30 0.35 0.00 0.05 0.10 0.15 0.20 0.25 0.30 0.35 Bond S tre ss, b ( ksi) Slip, s (in) 0 1 2 3 4 5 6 7 8 9 10 0 2 4 6 8 10 12 14 16 Bond S tre ss, b ( MP a) Slip, s (mm) Exp. average curve EN-12D CEB-217 0.00 0.05 0.10 0.15 0.20 0.25 0.30 0.35 0.00 0.25 0.50 0.75 1.00 1.25 1.50 1.75 2.00 2.25 Bond S tre ss, b ( ksi) Slip, s (in)
Figure 2.3 – Comparison between experimental results and existing curves for specimens EN.
EN – Ø10 EN – Ø12
0 1 2 3 4 5 6 7 8 9 10 0.0 0.5 1.0 1.5 2.0 2.5 3.0 3.5 4.0 Bond S tre ss, b ( MP a) Slip, s (mm) Exp. average curve WP-10 Verderame et al. model CEB-217 0.00 0.05 0.10 0.15 0.20 0.25 0.30 0.35 0.0 0.1 0.2 0.3 0.4 0.5 Slip, s (in) Bond S tre ss, b ( ksi) 0 1 2 3 4 5 6 7 8 9 10 0.0 0.5 1.0 1.5 2.0 2.5 3.0 3.5 4.0 Bond S tre ss, b ( MP a) Slip, s (mm) Exp. average curve WP-12 Verderame et al. model CEB-217 0.00 0.05 0.10 0.15 0.20 0.25 0.30 0.35 0.0 0.1 0.2 0.3 0.4 0.5 Bond S tre ss, b ( ksi) Slip, s (in) 0 1 2 3 4 5 6 7 8 9 10 0.0 0.5 1.0 1.5 2.0 2.5 3.0 3.5 4.0 Bond S tre ss, b ( MP a) Slip, s (mm) Exp. average curve WP-16 Verderame et al. model CEB-217 0.00 0.05 0.10 0.15 0.20 0.25 0.30 0.35 0.0 0.1 0.2 0.3 0.4 0.5 Bond S tre ss, b ( ksi) Slip, s (in)
Figure 2.4 – Comparison between experimental results and existing curves for specimens WP.
0 1 2 3 4 5 6 7 8 9 10 0.0 0.5 1.0 1.5 2.0 2.5 Bond S tre ss, b ( MP a) Slip, s (mm) Exp. average curve SP-10 Verderame et al. model CEB-217 0.00 0.05 0.10 0.15 0.20 0.25 0.30 0.35 0.00 0.05 0.10 0.15 0.20 0.25 0.30 0.35 Bond S tre ss, b ( ksi) Slip, s (in) 0 1 2 3 4 5 6 7 8 9 10 0.0 0.5 1.0 1.5 2.0 2.5 Bond S tre ss, b ( MP a) Slip, s (mm) Exp. average curve SP-12 Verderame et al. model CEB-217 0.00 0.05 0.10 0.15 0.20 0.25 0.30 0.35 0.00 0.05 0.10 0.15 0.20 0.25 0.30 0.35 Bond S tre ss, b ( ksi) Slip, s (in) 0 1 2 3 4 5 6 7 8 9 10 0.0 0.5 1.0 1.5 2.0 2.5 Bond S tre ss, b ( MP a) Slip, s (mm) Exp. average curve SP-16 Verderame et al. model CEB-217 0.00 0.05 0.10 0.15 0.20 0.25 0.30 0.35 0.00 0.05 0.10 0.15 0.20 0.25 0.30 0.35 Bond S tre ss, b ( ksi) Slip, s (in)
Figure 2.5 – Comparison between experimental results and existing curves for specimens SP.
From Figure 2.3 to Figure 2.5 it is evident that the model proposed by Verderame et al. [11] with three branches tends to better represent the experimental results than the CEB-217 model. But for deformed bars (set EN-12D) the CEB-CEB-217 [15] model represents better the experimental bond-slip relationship than for the other sets with plain bars.
The differences in terms of maximum bond stress and softening effect (bond degradation) found between the experimental results and the two considered models can be justified by several factors that are not taken into account by the models, such as: i) bar diameter [7,9,13]; ii) embedded length [9]; iii) surface roughness [7,9,13]; iv) storage conditions [9]; or v) lateral stress [10]. Another aspect that may justify the differences observed is the loading conditions, since the tests performed in this work were force controlled, as recommended in EN 10080 [20], while the model proposed by Verderame et al. [11] is based on pull-out tests performed under displacement control.
2.5.2 Cyclic tests
Figure 2.6 shows the results of the cyclic tests performed (EN-C12-i), as well as the average curve of the monotonic tests on similar specimens (EN-12). Figure 2.6 presents
also the cyclic model proposed by Verderame et al. [11], considering b,max 0.31 fc,
fc f b, 0.13 , b,r 0.09 fc, b,c 0.05 fc, smax 0.23mm(0.009in), α=0.26 and WP – Ø10 WP – Ø12 WP – Ø16 SP – Ø10 SP – Ø12 SP – Ø16
p=0.06, where τb,r is the residual bond stress and τb,c is the cyclic bond resistance. In one test a problem with the control system occurred and so the results of this test are here disregarded. The experimental results indicate that after reaching the maximum capacity in one loading direction the capacity in the opposite direction may not be limited to the residual value, but can be larger. This fact is in agreement with the experimental observations obtained by other authors in cyclic tests (Verderame et al. [11]). The cyclic model proposed by Verderame et al. [11] underestimates the bond stress, principally for the first cycles with small slippage values. Due to the lower number of cyclic tests performed in this study, is not possible to suggest improvements to Verderame et al. [11]. Future work should develop an extensive experimental campaign of cyclic pull-out tests in order to propose a new model based on the cyclic model of Verderame et al. [11].
-10 -8 -6 -4 -2 0 2 4 6 8 10 -2.0 -1.5 -1.0 -0.5 0.0 0.5 1.0 1.5 2.0 Bo n d Stres s, b (MP a) Slip, s (mm) EN-C12-1 EN-C12-2
Verderame et al. model Monotonic EN-12 -0.3 -0.2 -0.1 0.0 0.1 0.2 0.3 -0.25 -0.20 -0.15 -0.10 -0.05 0.00 0.05 0.10 0.15 0.20 0.25 Bo n d Stres s, b (K si) Slip, s (in)
Figure 2.6 – Cyclic test results (EN-C12) and comparison with results of monotonic tests and empirical model.
Another aspect investigated in this comparison is the bond stress degradation for cyclic loading with increasing amplitude. Even if the number of tests performed is limited, results evidence the reduction of the bond capacity after maximum stress is reached but this is seen not tend immediately to the residual value. It was also observed that the maximum bond capacity for both, monotonic and cyclic tests, are similar.
2.5.3 Summary of main results
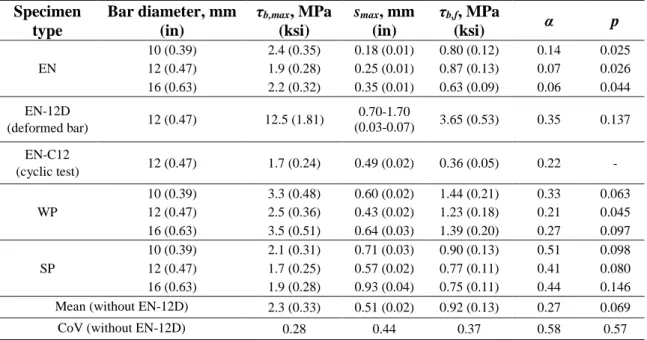
The mean values of the main properties of the bond-slip response (τb,max, smax, τb,f) obtained
Verderame et al. [11], in order to best-fit the experimental results, i.e., for each branch of the curve, equilibrating the area underneath the experimental and the empirical curves. The mean values and the coefficient of variation (CoV) presented in Table 2.4 correspond to the statistical measures of the specimens with plain bars. The variability found for the main properties of the bond-slip results is considerable, as indicated by the coefficients of variation. So, this conclusion confirms the influence of the studied variables (bar diameter, embedded length and reinforcement yield stress) in the bond properties, enforcing the need to include these variables in the empirical expressions for the estimation of the bond-slip laws.
Table 2.4 – Mean values of the parameters defining the bond-slip relationship. Specimen type Bar diameter, mm (in) τb,max, MPa (ksi) smax, mm (in) τb,f, MPa (ksi) α p EN 10 (0.39) 2.4 (0.35) 0.18 (0.01) 0.80 (0.12) 0.14 0.025 12 (0.47) 1.9 (0.28) 0.25 (0.01) 0.87 (0.13) 0.07 0.026 16 (0.63) 2.2 (0.32) 0.35 (0.01) 0.63 (0.09) 0.06 0.044 EN-12D (deformed bar) 12 (0.47) 12.5 (1.81) 0.70-1.70 (0.03-0.07) 3.65 (0.53) 0.35 0.137 EN-C12 (cyclic test) 12 (0.47) 1.7 (0.24) 0.49 (0.02) 0.36 (0.05) 0.22 - WP 10 (0.39) 3.3 (0.48) 0.60 (0.02) 1.44 (0.21) 0.33 0.063 12 (0.47) 2.5 (0.36) 0.43 (0.02) 1.23 (0.18) 0.21 0.045 16 (0.63) 3.5 (0.51) 0.64 (0.03) 1.39 (0.20) 0.27 0.097 SP 10 (0.39) 2.1 (0.31) 0.71 (0.03) 0.90 (0.13) 0.51 0.098 12 (0.47) 1.7 (0.25) 0.57 (0.02) 0.77 (0.11) 0.41 0.080 16 (0.63) 1.9 (0.28) 0.93 (0.04) 0.75 (0.11) 0.44 0.146
Mean (without EN-12D) 2.3 (0.33) 0.51 (0.02) 0.92 (0.13) 0.27 0.069
CoV (without EN-12D) 0.28 0.44 0.37 0.58 0.57
2.6 I
MPROVED CONSTITUTIVE MODEL FOR THE BOND-
SLIPRELATIONSHIP AND EMPIRICAL EXPRESSIONS FOR THE PARAMETERS INVOLVED
2.6.1 Fundamentals and formulation of the proposed model and
empirical expressions
As discussed in Section 2.4, and supported by different authors, the bond-slip response is dependent on the compressive concrete strength, surface roughness and diameter of the bars [7,9,11-13], among other parameters. However, in the two models presented and discussed in Section 2.5 the maximum bond stress is estimated only from the compressive
![Figure 2.1 – Bond-slip relationship for hot rolled reinforcing bars adapted from: a) CEB-217 [15]](https://thumb-eu.123doks.com/thumbv2/123dok_br/15911957.1092780/33.893.149.757.133.345/figure-bond-slip-relationship-rolled-reinforcing-bars-adapted.webp)