Applica bilit y of SERV QUAL in r e st a u r a n t s: a n
e x plor a t or y st u dy in a Por t u gu e se r e sor t
Vera Patrício ([email protected])
Rogério Puga Leal ([email protected])
Faculty of Science and Technology, Universidade Nova de Lisboa, Portugal
Zulema Lopes Pereira ([email protected])
Faculty of Science and Technology, Universidade Nova de Lisboa, Portugal
Abst r a ct
SERVQUAL is the most popular instrument to ascertain service quality. However, some debate exists about its ability to characterize different service environments. Furthermore, there is not a consensus about the inclusion of customer expectations in the model. The research presented in this paper intends to discuss the applicability of SERVQUAL to restaurant services and to analyze the inclusion of customer expectations in such environment. The research was developed in a Portuguese resort and more than 300 customers, from two different restaurants, were invited to participate in the study.
I n t r odu ct ion
It has been well recognized the crucial role played by service organizations in developed countries, being quality and corresponding customer satisfaction essential to increase the effectiveness, efficiency and competitiveness of these organizations (Leal and Pereira, 2003).
Tourism industry has become not only a driver for economic progress of many countries, of which Portugal is a good example, but also a vehicle to approximate people and cultures. Various policies have been issued and several initiatives aimed at improving tourism quality have also been fostered and implemented by private and public organizations all over the world. Despite these facts, it has been acknowledged both by tourists and public authorities that the level of quality has to be enhanced rapidly in all tourism activities, catering included. Being SERVQUAL the most utilized model in service quality research and applications, it seems interesting to analyze how well the SERVQUAL structure can be applied to restaurant services.
SERVQUAL was originated in 1988 and it was founded on the conceptual model developed by Parasuraman et al.(1985). The early work of these researchers was based on the comparison of service performance against a single expectation standard. According to this, perceived service quality can be expressed as follows:
Despite the recent multi-expectation approaches advocated by several authors (e.g.
Johnston, 1995; Wirtz and Bateson, 1999; Walker and Baker, 2000), the work presented in this paper is based on the aforementioned single expectation standard. Thus, the original SERVQUAL instrument (Parasuraman et al., 1988) is used to assess customer’s expectations and perceptions.
The instrument includes five dimensions of service quality (Zeithaml et al, 1990). To ascertain the quality of service provided by a restaurant, the following 22 items were considered within these dimensions:
Ta n gible s ( fou r it e m s)
1. Restaurant has modern-looking equipment 2. The physical facilities are visually appealing 3. Employees are neat-appearing
4. Materials associated with the service are visually appealing
Re lia bilit y ( five it e m s)
5. When the restaurant promises to do something by a certain time, it does so
6. When a customer has a problem, the restaurant shows a sincere interest in solving it 7. The restaurant performs the service right the first time
8. Services are provided at the time the restaurant promises to do 9. The records are error-free
Re sponsive n e ss ( four it e m s)
10. Employees tell customers when services will be performed 11. Employees give prompt service to customers
12. Employees are willing to help customers
13. Employees are never too busy to respond to customer’s requests
Assu r a n ce ( fou r it e m s)
14. The behaviour of employees instil confidence in customers 15. Customers feel safe in their transactions
16. Employees are consistently courteous
17. Employees have the knowledge to answer customer’s questions
Em pa t h y ( five it e m s)
18. Restaurant gives individual attention to the customer 19. Employees give personal attention to customers
20. Restaurant understands specifics needs of its customers 21. Restaurant has customer’s interest at heart
22. Operating hours are convenient to all customers
D a t a Colle ct ion
Two restaurants of different segments were selected to perform the study. Restaurant A has 60 seated places. It delivers complete meals in a formal environment. By contrast, Restaurant B is targeted to serve light meals in a very informal environment. It has 70 seated places.
A convenience sample of 150 customers (75 female and 75 male) was collected for each restaurant. All respondents were Portuguese citizens and the questionnaires were gathered from December 2002 to April 2003.
Beyond the 22 items of SERVQUAL, an extra item related to customer’s global satisfaction was added to the questionnaire.
Ex plor a t or y D a t a An a lysis
As mentioned before, it was decided to compare how well the presented SERVQUAL structure could be replicated for Portuguese restaurant services under two perspectives: “Perception-minus-expectation” framework against the performance framework.
These two perspectives led to different exploratory factor analysis approaches. One of the approaches considered the score differences ( percept ions m inus expect at ions) , for each item of the questionnaire, as the input, while the other just considered the perceptions.
First of all, it was important to decide if Factor Analysis was the appropriate technique for analyzing the available data. The KMO (Kaiser-Meyer-Olkin) measure of sampling adequacy and the test of sphericity were carried out for each of the aforementioned approaches, both for segments A and B. Table 1 presents these results and reveals that Factor Analysis is appropriate for the subsequent analysis.
Table 1. KMO’s and tests of sphericity
P-E P P-E P
KMO 0.707 0.785 0.622 0.648
Approx. Chi-Square 1882.754 2400.783 720.978 1082.181
df 231 231 231 231
Sig. 0.000 0.000 0.000 0.000
Segment A
Bartlett's Test of Sphericity
Segment B
The results are considerably poorer for segment B. As later component rotation for this segment did not produce a meaningful structure, it was discarded from further analysis. Probably, more research on sampling plans and data acquisition is needed for segment B, as well as further improvement in the administration of the questionnaire.
Table 2. Number of factors and explained variance
P-E P P-E P
Number of extracted factors 7 5 8 8
Total variance explained (%) 74.937 70.488 63.912 64.243 Segment A Segment B
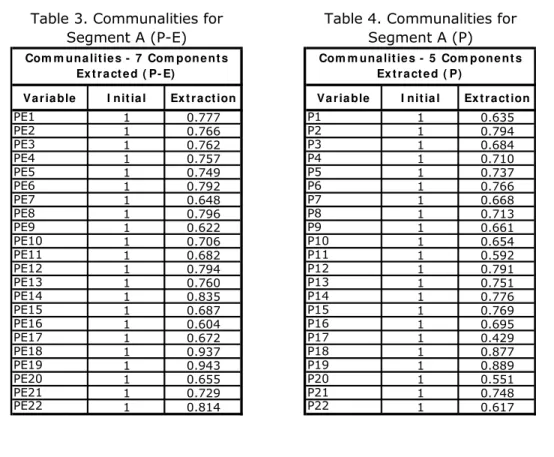
As regards segment A, the communalities for the variables of each framework are presented in Tables 3 and 4.
Va r ia ble I nit ia l Ex t r a ct ion Va r ia ble I nit ia l Ex t r a ct ion
PE1 1 0.777 P1 1 0.635
PE2 1 0.766 P2 1 0.794
PE3 1 0.762 P3 1 0.684
PE4 1 0.757 P4 1 0.710
PE5 1 0.749 P5 1 0.737
PE6 1 0.792 P6 1 0.766
PE7 1 0.648 P7 1 0.668
PE8 1 0.796 P8 1 0.713
PE9 1 0.622 P9 1 0.661
PE10 1 0.706 P10 1 0.654
PE11 1 0.682 P11 1 0.592
PE12 1 0.794 P12 1 0.791
PE13 1 0.760 P13 1 0.751
PE14 1 0.835 P14 1 0.776
PE15 1 0.687 P15 1 0.769
PE16 1 0.604 P16 1 0.695
PE17 1 0.672 P17 1 0.429
PE18 1 0.937 P18 1 0.877
PE19 1 0.943 P19 1 0.889
PE20 1 0.655 P20 1 0.551
PE21 1 0.729 P21 1 0.748
PE22 1 0.814 P22 1 0.617
Com m una lit ie s - 5 Com pon e nt s Ex t r a ct e d ( P)
Com m u n a lit ie s - 7 Com pon e nt s Ex t r a ct e d ( P- E)
Table 4. Communalities for Segment A (P) Table 3. Communalities for
Segment A (P-E)
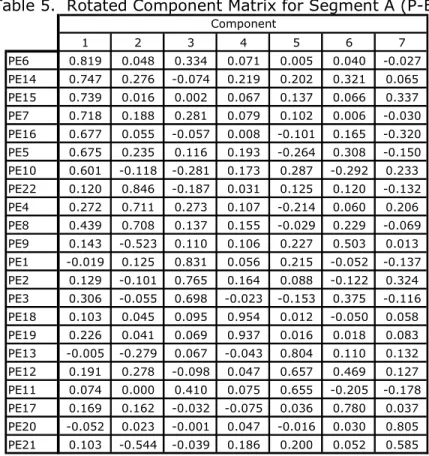
I nt e r pr e t a t ion of “Pe r ce pt ion- m inu s- e x pe ct a t ion” fr a m e w or k
Table 5. Rotated Component Matrix for Segment A (P-E)
1 2 3 4 5 6 7
PE6 0.819 0.048 0.334 0.071 0.005 0.040 -0.027 PE14 0.747 0.276 -0.074 0.219 0.202 0.321 0.065 PE15 0.739 0.016 0.002 0.067 0.137 0.066 0.337 PE7 0.718 0.188 0.281 0.079 0.102 0.006 -0.030 PE16 0.677 0.055 -0.057 0.008 -0.101 0.165 -0.320 PE5 0.675 0.235 0.116 0.193 -0.264 0.308 -0.150 PE10 0.601 -0.118 -0.281 0.173 0.287 -0.292 0.233 PE22 0.120 0.846 -0.187 0.031 0.125 0.120 -0.132 PE4 0.272 0.711 0.273 0.107 -0.214 0.060 0.206 PE8 0.439 0.708 0.137 0.155 -0.029 0.229 -0.069 PE9 0.143 -0.523 0.110 0.106 0.227 0.503 0.013 PE1 -0.019 0.125 0.831 0.056 0.215 -0.052 -0.137 PE2 0.129 -0.101 0.765 0.164 0.088 -0.122 0.324 PE3 0.306 -0.055 0.698 -0.023 -0.153 0.375 -0.116 PE18 0.103 0.045 0.095 0.954 0.012 -0.050 0.058 PE19 0.226 0.041 0.069 0.937 0.016 0.018 0.083 PE13 -0.005 -0.279 0.067 -0.043 0.804 0.110 0.132 PE12 0.191 0.278 -0.098 0.047 0.657 0.469 0.127 PE11 0.074 0.000 0.410 0.075 0.655 -0.205 -0.178 PE17 0.169 0.162 -0.032 -0.075 0.036 0.780 0.037 PE20 -0.052 0.023 -0.001 0.047 -0.016 0.030 0.805 PE21 0.103 -0.544 -0.039 0.186 0.200 0.052 0.585
Component
According to Hair et al. (1995), only factor loadings above 0.500 can be considered significant for the considered sample size. Although a meaningful structure appears to emerge, it must be noticed that some variables are not easy to allocate to a single factor (e.g. variables 21 and 9).
Factors 4 and 7 include the variables that belong to the “Empathy” dimension of SERVQUAL. However, it seems that customers tend to consider separately the “individual attention”, which seems logical due to the type of service provided.
Factor 5 generically includes those variables that SERVQUAL assumes to represent the “Responsiveness” dimension. The only item excluded is PE10, which is regarded as a variable more related to reliability by restaurant customers. In fact, this variable is included, together with variables 5, 6 and 7, in factor 1. This result can be considered logical, as PE10 represents, in a large scale, a reliability characteristic.
Factor 1 also includes variables 14 and 15 that reflect confidence and safety, i.e., issues strongly related to reliability.
Factor 3 includes the variables associated to “Tangibles” in SERVQUAL, with the exception of variable 4.
Factor 2 includes variables 8 and 22. It is not a surprise that they are grouped together. In fact, both variables are related to time characteristics. This factor also includes, with slightly lower factor loading, variable 8, which is not easy to explain.
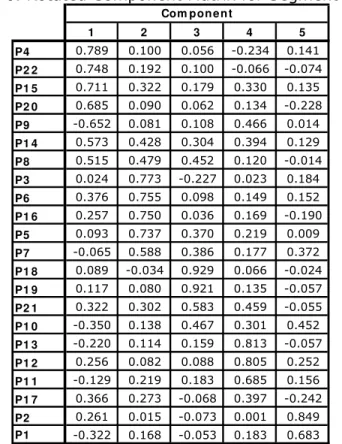
I n t e r pr e t a t ion of Sin gle pe r ce pt ion fr a m e w or k
Table 6 presents the rotated component matrix for the performance framework.
Table 6. Rotated Component Matrix for Segment A (P)
1 2 3 4 5
P4 0.789 0.100 0.056 -0.234 0.141 P2 2 0.748 0.192 0.100 -0.066 -0.074 P1 5 0.711 0.322 0.179 0.330 0.135 P2 0 0.685 0.090 0.062 0.134 -0.228 P9 -0.652 0.081 0.108 0.466 0.014 P1 4 0.573 0.428 0.304 0.394 0.129 P8 0.515 0.479 0.452 0.120 -0.014 P3 0.024 0.773 -0.227 0.023 0.184 P6 0.376 0.755 0.098 0.149 0.152 P1 6 0.257 0.750 0.036 0.169 -0.190 P5 0.093 0.737 0.370 0.219 0.009 P7 -0.065 0.588 0.386 0.177 0.372 P1 8 0.089 -0.034 0.929 0.066 -0.024 P1 9 0.117 0.080 0.921 0.135 -0.057 P2 1 0.322 0.302 0.583 0.459 -0.055 P1 0 -0.350 0.138 0.467 0.301 0.452 P1 3 -0.220 0.114 0.159 0.813 -0.057 P1 2 0.256 0.082 0.088 0.805 0.252 P1 1 -0.129 0.219 0.183 0.685 0.156 P1 7 0.366 0.273 -0.068 0.397 -0.242 P2 0.261 0.015 -0.073 0.001 0.849 P1 -0.322 0.168 -0.053 0.183 0.683
Com pon e n t
Generally speaking, a structure with some meaning, and some similarities to the (P-E) framework, appears to emerge. However, it must be stressed that the number of items whose allocation is not immediate (variables 8, 10, 14, 17 and 21) increases and that there are factors whose interpretation is far from being straightforward.
Factor 1, for instance, combines variables from several SERVQUAL dimensions and does not offer an easy interpretation.
Regardless the considered framework, variables associated to service customization tend to be aggregated, as happens with variables 18, 19 and 21
Variables 5, 6 and 7, belonging to SERVQUAL’s Reliabilit y, are grouped together with variables 3 and 16. The inclusion of variable 16 in this factor is acceptable, as it regards behavior consistency, which can be easily linked to reliability. When compared to (P-E) framework, variables 11, 12 and 13 are still included in the same factor – Responsiveness.
Finally, as regards Tangibles, restaurant’s facilities (variables 1 and 2) tend to be separately considered from those concerning employee’s appearance and materials associated to service delivery, which makes some sense.
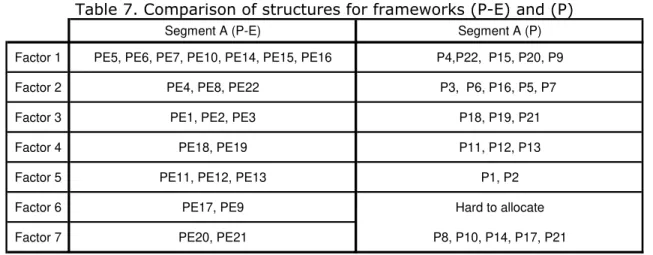
Table 7 presents a summary of the variables allocated to each factor in each framework.
Table 7. Comparison of structures for frameworks (P-E) and (P)
Segment A (P-E) Segment A (P)
Factor 1 PE5, PE6, PE7, PE10, PE14, PE15, PE16 P4,P22, P15, P20, P9
Factor 2 PE4, PE8, PE22 P3, P6, P16, P5, P7
Factor 3 PE1, PE2, PE3 P18, P19, P21
Factor 4 PE18, PE19 P11, P12, P13
Factor 5 PE11, PE12, PE13 P1, P2
Factor 6 PE17, PE9 Hard to allocate
Factor 7 PE20, PE21 P8, P10, P14, P17, P21
Thus, despite some interesting insights provided by the perceptions framework, it must be recognized that a more consistent structure was achieved trough the “perceptions-minus-expectations” framework. Therefore, the later, and not the former, will be used to develop the next stage of the study.
Summarizing, a structure for service quality in restaurants can be proposed as presented in Table 8.
Table 8. Structure for service quality in restaurants
Name of the factor Surrogate Variable
Factor 1 Reliability PE6
Factor 2 Time Convenience PE22
Factor 3 Tangibles PE1
Factor 4 Customization PE18
Factor 5 Responsiveness PE13
Factor 6 Technical Skills PE17
Factor 7 Empathy PE20
Guide lin e s for M a n a ge m e n t
From a management perspective, it is vital to identify the areas where greater efforts should be allocated. Beyond the obvious approach, that areas poorly rated by customers should be carefully looked at, it is important to identify which factors more strongly affect customer’s satisfaction. To achieve this objective, a multiple regression model was developed.
coefficients might constitute a good approach to the weight given by customers to the several factors.
A stepwise procedure was adopted to select variables. Variables PE1 (Tangibles) and PE13 (Responsiveness) were not included in the model in any step.
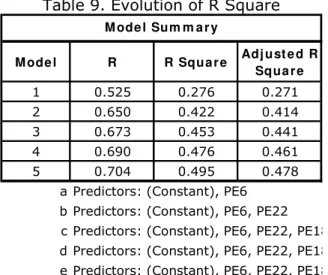
Table 9 shows the evolution of RSquare. A value circa 50% was obtained, which is quite reasonable for this type of study.
Table 9. Evolution of R Square
M ode l R R Squa r e Adj u st e d R Squa r e
1 0.525 0.276 0.271
2 0.650 0.422 0.414
3 0.673 0.453 0.441
4 0.690 0.476 0.461
5 0.704 0.495 0.478
a Predictors: (Constant), PE6 b Predictors: (Constant), PE6, PE22 c Predictors: (Constant), PE6, PE22, PE18 d Predictors: (Constant), PE6, PE22, PE18 e Predictors: (Constant), PE6, PE22, PE18
M ode l Sum m a r y
The regression coefficients for the final model are shown in Table 10.
Table 10. Regression Coefficients
St a n da r diz e d Coe fficie nt s
M ode l B St d.
Er r or Be t a t Sig.
5 (Constant) 5.760 0.079 73.039 0.000
PE6 0.299 0.041 0.445 7.255 0.000
PE22 0.102 0.017 0.369 6.112 0.000
PE18 0.118 0.042 0.173 2.836 0.005
PE20 0.052 0.021 0.149 2.496 0.014
PE17 0.102 0.044 0.143 2.341 0.021
a
Un st a nda r diz e d Coe f ficie n t s
Dependent Variable: SatisglobA
A relative weight for each factor can be calculated from the standardized coefficients presented in Table 10:
∑
==
kj j i
i
1
factor
of
importance
Relative
β
β
Fa ct or Re la t iv e W e igh t ( % )
Reliability 34.8
Time Convenience 28.9
Customization 13.5
Technical Skills 11.1
Empathy 11.7
Table 11. Relative weight of the factors
The highest importance attributed to Reliability is consistent with the findings of several other authors, including Parasuraman et al. (1991).
However, the dimension “Time Convenience”, which reflects the operating hours of the restaurant as well as its ability to provide the service on time, also reveals a very high weight which is not surprising according to the type of service. Therefore, it seems that an enlargement of the operating hours might have a very positive impact on customer satisfaction.
Curiously, the variable representing the “Tangibles” factor was not significant at the regression. Although a further study is needed, it is not possible to exclude that “Tangibles” are a sort of basic characteristics under Kano’s perspective.
Con clu sion s
The importance of SERVQUAL within service quality research is unquestionable. However, as SERVQUAL is a general model, it is always interesting to discuss its applicability to specific service environments. This is was the aim of this research focused on Portuguese restaurants. Nevertheless, it must be recognized that convenience sampling was adopted, which reinforces the exploratory nature of the study and the necessity of confirming the presented results with further research.
Despite some similarities, the SERVQUAL structure was not fully replicated in none of the analyzed frameworks. Single performance framework (P) produced a 5-factor structure, like SERVQUAL, but with some differences in variables allocation. On the other hand, “perception-minus-expectation” framework produced a final structure with seven factors, which is consistent with several others presented in literature, which can be considered meaningful and challenging to analyze.
It is very interesting to notice the emergence of a factor that reflects individual attention given to customers. This is completely aligned with current marketing trends and must constitute a strategic driver for the tourism industry.
The items contained in the original SERVQUAL dimensions of “Reliability” and “Assurance” are merged into a single factor, reflecting that restaurant’s customers do not differentiate those issues. Time convenience appeared as a significant factor, revealing an increased demand of customers for service availability. The non-significance of tangibles is somehow surprising. Although further research is needed, it seems that tangibles are a sort of basic characteristics under Kano’s perspective, i.e., only their lack of adequacy is noticed.
Finally, it is worth mentioning that the enlargement of operating periods, despite the associated costs, also constitutes an important measure to fulfil customer’s requirements.
Re fe r e n ce s
Carman, James M.(1990) - Consumer Perceptions of Service Quality: An
Assessment of the SERVQUAL Dimensions, Journal of Ret ailing; Vol. 66, No. 1;
Spring 1990, pp 33-55.
Hair, Joseph, Anderson, Rolph, Tatham, Ronald, Black, William (1995)- Mult ivariat e
Dat a Analy sis w it h Readings, 4ª ed., New Jersey, Prentice-Hall Inc.
Johnston, R. (1995), The Zone of Tolerance: exploring the relationship between
service transactions and satisfaction with the overall service, I nt ernat ional
Journal of Service I ndust ry Managem ent , Vol.6 No.2, pp. 46-61.
Leal, R P. and Pereira, Z. L. (2003), Service Recovery at a financial institution,
I nt ernat ional Journal of Qualit y and Reliabilit y Managem ent , Vol.20 No.6, pp.
646-663.
Parasuraman, A., Berry, L. and Zeithaml, V.A. (1991), Understanding customer
expectations of service, Sloan Managem ent Review, Spring, pp. 39-48.
Parasuraman, A., Zeithaml, V. A. and Berry, L. L. (1988), SERVQUAL: A
Multiple-Item Scale for Measuring Consumer Perceptions of Service Quality, Journal of
Ret ailing, Vol. 6 No. 1; Spring, pp. 12-40.
Walker, J. and Baker, J. (2000), An exploratory study of a multi-expectation
framework for services, Journal of Serv ices Market ing, Vol.14 No.5, pp.
411-431.
Wirtz, J. J. and Bateson, J. E.G. (1999), Introducing uncertain performance
expectations in satisfaction models for services, I nt ernat ional Journal of
Ser vice I ndust r y Managem ent , Vol.10 No.1, pp. 82-99.
Zeithaml, Valarie A., Parasuraman, A., Berry, Leonard L.(1990) - Delivering Qualit y
Ser vice: Balancing Cust om er Per cept ions and Expect at ions; The Free Press, A