www.jped.com.br
ORIGINAL ARTICLE
First report on simplified diagnostic criteria for pre-hypertension
and hypertension in a national sample of adolescents from the
Middle East and North Africa: the CASPIAN-III study
夽
Roya Kelishadi
a, Ramin Heshmat
b, Gelayol Ardalan
c, Mostafa Qorbani
d,e,
Mahnaz Taslimi
f, Parinaz Poursafa
g, Kasra Keramatian
h, Majzoubeh Taheri
c,
Mohammad-Esmaeil Motlagh
h,∗aPediatrics Department, Child Growth and Development Research Center, Isfahan University of Medical Sciences, Isfahan, Iran bChronic Diseases Research Center, Endocrinology and Metabolism Population Sciences Institute, Endocrinology and Metabolism
Research Institute, Tehran University of Medical Sciences, Tehran, Iran
cBureau of Population, Family, and School Health, Ministry of Health and Medical Education, Tehran, Iran dDepartment of Public Health, Alborz University of Medical Sciences, Karaj, Iran
eDepartment of Epidemiology, Iran University of Medical Sciences, Tehran, Iran
fSchool Health Department, Bureau of Health and Fitness, Ministry of Education, Tehran, Iran
gEnvironment Department, Environment Research Center, Isfahan University of Medical Sciences, Isfahan, Iran hPediatrics Department, Ahvaz Jundishapur University of Medical Sciences, Ahvaz, Iran
Received 18 March 2013; accepted 19 June 2013 Available online 13 October 2013
KEYWORDS
Blood pressure; Screening; Pre-hypertension; Hypertension; Adolescence
Abstract
Objective: this study aimed to simplify the diagnostic criteria of pre-hypertension (pre-HTN) and hypertension (HTN) in the pediatric age group, and to determine the accuracy of these simple indexes in a nationally-representative sample of Iranian children and adolescents. Method: the diagnostic accuracy of the indexes of systolic blood pressure-to-height ratio (SBPHR) and diastolic BPHR (DBPHR) to define pre-HTN and HTN was determined by the area under the curve of the receiver operator characteristic curves.
Results: the study population consisted of 5,738 Iranian students (2,875 females) with mean (SD) age of 14.7 (2.4) years. The prevalences of pre-HTN and HTN were 6.9% and 5.6%. The optimal thresholds for defining pre-HTN were 0.73 in males and 0.71 in females for SBPHR, and 0.47 in males and 0.45 in females for DBPHR, respectively. The corresponding figures for HTN were 0.73, 0.71, 0.48, and 0.46, respectively. In both genders, the accuracies of SBPHR and DBPHR in diagnosing pre-HTN and HTN were approximately 80%.
夽 Please cite this article as: Kelishadi R, Heshmat R, Ardalan G, Qorbani M, Taslimi M, Poursafa P, et al. First report on simplified diagnostic criteria for pre-hypertension and hypertension in a national sample of adolescents from the Middle East and North Africa: the CASPIAN-III study. J Pediatr (Rio J). 2014;90:85---91.
∗Corresponding author.
E-mail:[email protected] (M.-E. Motlagh).
86 Kelishadi R et al.
Conclusions: BPHR is a valid, simple, inexpensive, and accurate tool to diagnose pre-HTN and HTN in adolescents. The optimal thresholds of SBPHR and DBPHR were consistent with the corresponding figures in other populations of children and adolescents with different racial and ethnic backgrounds. Thus, it is suggested that the use of these indexes can be generalized in programs aiming to screen elevated blood pressure in the pediatric age group.
© 2013 Sociedade Brasileira de Pediatria. Published by Elsevier Editora Ltda. All rights reserved.
PALAVRAS-CHAVE
Pressão sanguínea; Triagem;
Pré-hipertensão; Hipertensão; Adolescência
Primeiro relatório sobre critérios de diagnóstico simplificado para pré-hipertensão e hipertensão em uma amostra nacional de adolescentes do Oriente Médio e da África do Norte: o estudo CASPIAN-III
Resumo
Objetivo: este estudo visa simplificar os critérios de diagnóstico da pré-hipertensão (pré-HTA) e hipertensão (HTA) na faixa etária pediátrica e determinar a precisão desses índices simples em uma amostra nacionalmente representativa de crianc¸as e adolescentes iranianos.
Método: a precisão diagnóstica dos índices de relac¸ão pressão arterial sistólica/altura (RPASA) e RPAA diastólica (RPADA) para definir a pré-HTA e HTA foi determinada pela área sob as curvas de características de operac¸ão do receptor.
Resultados: a populac¸ão estudada contou com 5738 alunos iranianos (2875 meninas) com idade média (DP) de 14,7 (2,4) anos. A prevalência de pré-HTA e HTA foi 6,9% e 5,6%. Os limites ideais para a definic¸ão de pré-HTA foram 0,73 em meninos e 0,71 em meninas com relac¸ão à RPASA e 0,47 em meninos e 0,45 em meninas com relac¸ão à RPADA, respectivamente. Os valores correspondentes com relac¸ão à HTA foram 0,73, 0,71, 0,48 e 0,46, respectivamente. Em ambos os gêneros, a precisão de RPASA e RPADA no diagnóstico de pré-HTA e HTA foi de aproximadamente 80%.
Conclusões: a RPAA é uma ferramenta válida, simples, barata e precisa no diagnóstico da pré-HTA e HTA em adolescentes. Os limites ideais de RPASA e RPADA foram compatíveis com os números correspondentes em outra populac¸ão de crianc¸as e adolescentes com diferentes históricos raciais e étnicos, assim, sugerimos que a utilizac¸ão desses índices possa ser general-izada em programas de triagem com relac¸ão à PA elevada na faixa etária pediátrica.
© 2013 Sociedade Brasileira de Pediatria. Publicado por Elsevier Editora Ltda. Todos os direitos reservados.
Introduction
Hypertension (HTN) is a global health problem, and it is well-documented that increased blood pressure (BP) becomes
established in childhood.1,2Nowadays, health care providers
focus on the screening and treatment of hypertension in adults; however, they should also consider the importance of the BP tracking from early life and the increasing prevalence of pre-hypertension (pre-HTN) and HTN in the pediatric age
group.3,4A growing body of evidence indicates not only that
HTN gradually damages the function of vital organs, but also
that pre-HTN has the same harmful effects.5,6
The fourth report on the diagnosis, evaluation, and treat-ment of high BP in children and adolescents emphasized that all children older than 3 years attended to in a
medi-cal setting should have their BP measured.7Since pre-HTN
and HTN in children are classified as systolic BP (SBP) and/or
diastolic BP (DBP) between 90thand 95th percentile, and≥
95thpercentile, respectively, and considering that the
accu-rate diagnosis of high BP requires adjusting the values for age, gender, and height, the interpretation of the BP level is time-consuming and difficult to use. This is a probably reason why, in many countries, BP measurement is not an integrated part of physical examination for healthy children. Providing simple indexes for interpreting the BP levels would increase the knowledge regarding the BP status of children
further follow-up for definitive diagnosis of HTN. In some populations, simplified indexes, such as SBP-to-height ratio (SBPHR) and DBP-to-height ratios (DBPHR), have been used for easy interpretation of BP levels in the pediatric age
group.8,9These studies have recommended determining the
sensitivity and specificity of these indexes in various popula-tions. Education regarding the prevalence of elevated BP in the pediatric population would be useful for policy makers, in order to highlight the importance of training health pro-fessionals about integrating BP measurement and tracking in healthy children, and to increase the public awareness about the importance of prevention and control of pre-HTN from early life.
This study aimed to simplify the diagnostic criteria of pre-HTN and pre-HTN in children and adolescents, and to determine the accuracy of these simple indexes in a nationally-representative sample of Iranian children and adolescents, as the first national study of its kind in the pediatric popu-lation of the Middle East and North Africa (MENA).
Methods
Study population
behav-report
on
simplified
diagnostic
criteria
for
pre-hypertension
and
hypertension
87
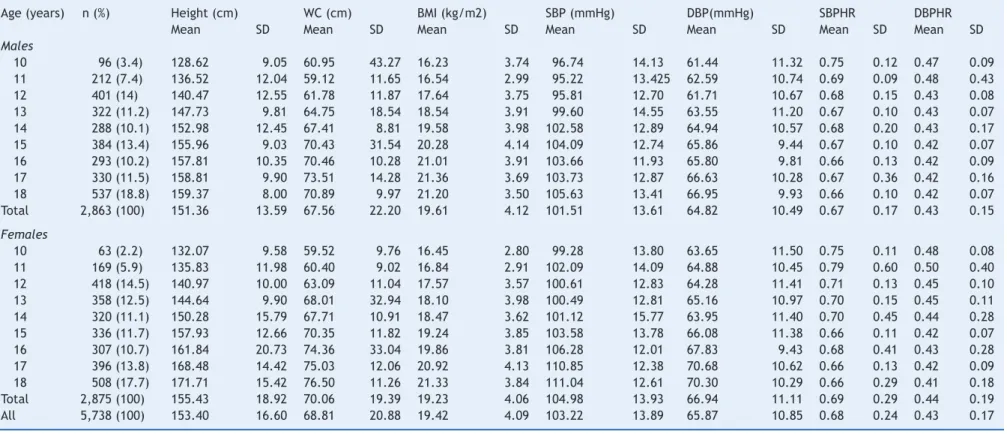
Table 1 Characteristics of the study population by age and gender: the CASPIAN-III Study.
Age (years) n (%) Height (cm) WC (cm) BMI (kg/m2) SBP (mmHg) DBP(mmHg) SBPHR DBPHR
Mean SD Mean SD Mean SD Mean SD Mean SD Mean SD Mean SD
Males
10 96 (3.4) 128.62 9.05 60.95 43.27 16.23 3.74 96.74 14.13 61.44 11.32 0.75 0.12 0.47 0.09
11 212 (7.4) 136.52 12.04 59.12 11.65 16.54 2.99 95.22 13.425 62.59 10.74 0.69 0.09 0.48 0.43
12 401 (14) 140.47 12.55 61.78 11.87 17.64 3.75 95.81 12.70 61.71 10.67 0.68 0.15 0.43 0.08
13 322 (11.2) 147.73 9.81 64.75 18.54 18.54 3.91 99.60 14.55 63.55 11.20 0.67 0.10 0.43 0.07
14 288 (10.1) 152.98 12.45 67.41 8.81 19.58 3.98 102.58 12.89 64.94 10.57 0.68 0.20 0.43 0.17
15 384 (13.4) 155.96 9.03 70.43 31.54 20.28 4.14 104.09 12.74 65.86 9.44 0.67 0.10 0.42 0.07
16 293 (10.2) 157.81 10.35 70.46 10.28 21.01 3.91 103.66 11.93 65.80 9.81 0.66 0.13 0.42 0.09
17 330 (11.5) 158.81 9.90 73.51 14.28 21.36 3.69 103.73 12.87 66.63 10.28 0.67 0.36 0.42 0.16
18 537 (18.8) 159.37 8.00 70.89 9.97 21.20 3.50 105.63 13.41 66.95 9.93 0.66 0.10 0.42 0.07
Total 2,863 (100) 151.36 13.59 67.56 22.20 19.61 4.12 101.51 13.61 64.82 10.49 0.67 0.17 0.43 0.15
Females
10 63 (2.2) 132.07 9.58 59.52 9.76 16.45 2.80 99.28 13.80 63.65 11.50 0.75 0.11 0.48 0.08
11 169 (5.9) 135.83 11.98 60.40 9.02 16.84 2.91 102.09 14.09 64.88 10.45 0.79 0.60 0.50 0.40
12 418 (14.5) 140.97 10.00 63.09 11.04 17.57 3.57 100.61 12.83 64.28 11.41 0.71 0.13 0.45 0.10
13 358 (12.5) 144.64 9.90 68.01 32.94 18.10 3.98 100.49 12.81 65.16 10.97 0.70 0.15 0.45 0.11
14 320 (11.1) 150.28 15.79 67.71 10.91 18.47 3.62 101.12 15.77 63.95 11.40 0.70 0.45 0.44 0.28
15 336 (11.7) 157.93 12.66 70.35 11.82 19.24 3.85 103.58 13.78 66.08 11.38 0.66 0.11 0.42 0.07
16 307 (10.7) 161.84 20.73 74.36 33.04 19.86 3.81 106.28 12.01 67.83 9.43 0.68 0.41 0.43 0.28
17 396 (13.8) 168.48 14.42 75.03 12.06 20.92 4.13 110.85 12.38 70.68 10.62 0.66 0.13 0.42 0.09
18 508 (17.7) 171.71 15.42 76.50 11.26 21.33 3.84 111.04 12.61 70.30 10.29 0.66 0.29 0.41 0.18
Total 2,875 (100) 155.43 18.92 70.06 19.39 19.23 4.06 104.98 13.93 66.94 11.11 0.69 0.29 0.44 0.19
All 5,738 (100) 153.40 16.60 68.81 20.88 19.42 4.09 103.22 13.89 65.87 10.85 0.68 0.24 0.43 0.17
88 Kelishadi R et al.
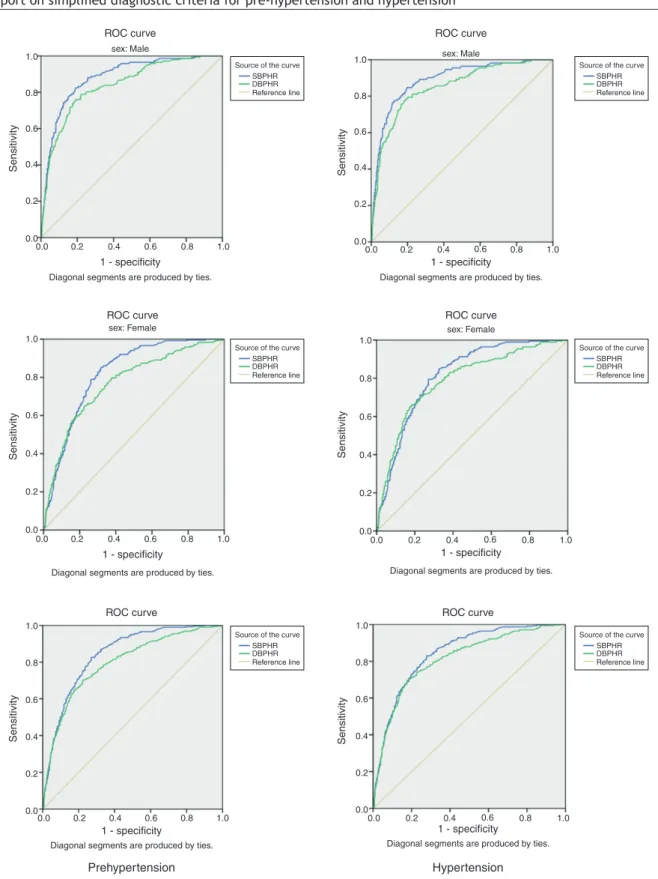
Table 2 Receiver operator characteristic curve of blood pressure-to-height ratios for identifying children with pre-hypertension and hypertension: the CASPIAN-III Study.
Prehypertension Hypertension
Gender-specific value
Threshold Sensitivity Specificity AUC (95% CI) Threshold Sensitivity Specificity AUC (95% CI)
SBPHR
Males 0.73 0.82 0.81 0.88 (0.85-0.90) 0.73 0.82 0.82 0.89 (0.86-0.92)
Females 0.71 0.79 0.74 0.84 (0.80-0.87) 0.71 0.75 0.75 0.85 (0.81-0.88)
Total 0.71 0.77 0.77 0.84 (0.82-0.86) 0.72 0.77 0.77 0.84 (0.82-0.86)
DBPHR
Males 0.47 0.79 0.78 0.82 (0.79-0.84) 0.48 0.79 0.80 0.81 (0.79-0.84)
Females 0.45 0.70 0.70 0.77 (0.74-0.80) 0.46 0.73 0.72 0.79 (0.76-0.82)
Total 0.46 0.73 0.73 0.80 (0.77-0.82) 0.47 0.75 0.75 0.81 (0.78-0.84)
AUC, area under curve; CI, confidence interval; DBPHR, diastolic blood pressure-to-height ratio; SBPHR, systolic blood pressure-to-height ratio.
surveillance system entitled the Childhood and Adolescence Surveillance and PreventIon of Adult Non-communicable
dis-ease (CASPIAN) Study.10,11The third survey of this nationwide
school-based health survey (CASPIAN-III Study) was con-ducted in 27 provinces of Iran. Details of data collection and
the sampling framework have been explained elsewhere,12
and are presented here in brief.
Study participants
The study was approved by institutional review boards at the national and provincial level. The Research and Ethical Committee of the Bureau of Population, Family, and School Health, Ministry of Health and Medical Education, and the Research and Ethical Committee of the Ministry of Education and Training approved the study. After complete explana-tion of the objectives and protocols of the study, informed consents were obtained from parents and oral assent from students. The present survey included 5,680 students aged 10-18 years, who were recruited by multistage random clus-ter sampling from the urban and rural areas of 27 provinces of Iran.
Procedure and measurements
A team of trained health care professionals and physi-cians recorded information, and conducted the physical examination under standard protocols by using calibrated instruments. Body mass index (BMI) was calculated as weight
(kg) divided by height squared (m2).
SBP and DBP were measured on the right arm, with the individual in a sitting position and at rest for at least 5 min, using standardized mercury sphygmomanometers and appro-priate size cuff. Two measurements at two-minute intervals were recorded, and the average was used for the statistical
analysis.7The indexes were computed by using the following
equations: SBPHR = SBP (mmHg) / height (cm) and DBPHR = DBP (mmHg) / height (cm).
Statistical analysis
Quantitative variables were expressed as means (standard
To determine the optimal threshold for predicting ele-vated BP, the receiver operator characteristic (ROC) curve analysis was plotted with an estimation of the variable’s sensitivity and specificity. Optimal thresholds for SBPHR and DBPHR were assessed by the minimum
value of (1−sensitivity)2+(1−specificity)2,
13 which
represented the maximum sum of sensitivity and speci-ficity.
The area under curve (AUC) corresponded to the overall ability of SBPHR and DBPHR as a diagnostic test for pre-dicting elevated BP. The AUC value ranges between 0 to 1; it can be interpreted according to the following principles: test equal to chance (AUC = 0.5), less accurate (0.5 < AUC
≤0.7), moderately accurate (0.7 < AUC≤0.9), highly
accu-rate (0.9 < AUC ≤ 1.0), and perfect performance (AUC =
1.0). Data were analyzed by using the Statistical Package for Social Sciences (SPSS) version 16.0 (SPSS Inc. - Chicago, IL, USA); p-values of less than 0.05 were considered statistically significant.
Results
Complete data of 5,738 students were obtained for the cur-rent study, and are reported here. Participants consisted of 2,863 males and 2,875 females, with mean (SD) age of 14.7 (2.4) years. Table 1 presents the characteristics of the study participants. The mean (SD) of SBP and DBP were 103.22 (13.89) and 65.87 (10.85) mmHg, respectively. The preva-lence of pre-HTN and HTN were 6.9% and 5.6%, respectively. The means (SD) for SBPHR and DBPHR were 0.68 (0.24) and 0.43 (0.17), respectively.
ROC curve ROC curve
ROC curve ROC curve
ROC curve ROC curve
sex: Male
1 - specificity 1 - specificity
Sensitivity
Diagonal segments are produced by ties. Diagonal segments are produced by ties.
1.0
0.8
0.6
0.4
0.2
0.0
0.0 0.2 0.4 0.6 0.8 1.0
sex: Male
sex: Female sex: Female
Sensitivity
1.0
0.8
0.6
0.4
0.2
0.0
0.0 0.2 0.4 0.6 0.8 1.0
1 - specificity 1 - specificity
Sensitivity
Diagonal segments are produced by ties. Diagonal segments are produced by ties.
1.0
0.8
0.6
0.4
0.2
0.0
0.0 0.2 0.4 0.6 0.8 1.0
Sensitivity
1.0
0.8
0.6
0.4
0.2
0.0
0.0 0.2 0.4 0.6 0.8 1.0
Source of the curve SBPHR DBPHR Reference line
Source of the curve SBPHR DBPHR Reference line
Source of the curve SBPHR DBPHR Reference line
Source of the curve SBPHR DBPHR Reference line
Source of the curve SBPHR DBPHR Reference line
Source of the curve SBPHR DBPHR Reference line
1 - specificity 1 - specificity
Sensitivity
Diagonal segments are produced by ties. Diagonal segments are produced by ties.
Hypertension Prehypertension
1.0
0.8
0.6
0.4
0.2
0.0
0.0 0.2 0.4 0.6 0.8 1.0
Sensitivity
1.0
0.8
0.6
0.4
0.2
0.0
0.0 0.2 0.4 0.6 0.8 1.0
Figure 1 Receiver operating characteristic curves of sensitivities and specificities for the optimal thresholds of blood pressure-to-height ratios for diagnosing pre-hypertension and hypertension by gender: CASPIAN-III study.
values for the accuracy of SBPHR and DBPHR in diagnos-ing pre-HTN were 0.84 and 0.80, respectively, and the accuracy of SBPHR and DBPHR in diagnosing HTN was 0.84 and 0.81, respectively, which indicates suitable accu-racy.
Discussion
90 Kelishadi R et al.
identifying pre-HTN and HTN. In the present study, the optimal thresholds for SBPHR and DBPHR for diagnosing sys-tolic/diastolic pre-HTN were 0.73 and 0.47 in males, and 0.71 and 0.45 in females, respectively. These findings are consistent with the some previous studies conducted in chil-dren and adolescents, which provided optimal thresholds of BPHR for diagnosing elevated BP, but also suggested the
development of these indexes in various populations.8,9,14,15
In a study among 3,136 Han adolescents aged between 13 and 17 years, the optimal thresholds of SBPHR and DBPHR for defining pre-HTN were 0.75 and 0.48 for males, and 0.78 and 0.51 for females, respectively. The corresponding figures for defining HTN were 0.81 and 0.57 for males, and 0.84 and 0.63
for females, respectively.8In a population-based study with
1,173 Nigerian adolescents aged 11 to 17 years, the optimal thresholds of SBPHR and DBPHR for diagnosing pre-HTN were 0.72 and 0.46 in males, and 0.73 and 0.48 in females; the corresponding figures for HTN were 0.75 and 0.51 in males
and 0.77 and 0.50 in females.9In a population-based study
of 1,352 Han children aged 7 to 12 years, DBPHR cutoff val-ues for elevated DBP were 0.51 and 0.60 mmHg/cm in males, and 0.51 and 0.58 mmHg/cm in females. SBPHR cutoff values for elevated SBP were 0.76 and 0.88 in males, and 0.78 and
0.90 in females.14 The National Health and Nutrition
Exam-ination Survey (NHANES) in 2006-2007 included the data of
3,775 American children and adolescents, and confirmed the high sensitivity and specificity of BPHR in detecting elevated BP in this age group. The cutoffs for SBPHR and DBPHR were
≥ 0.75 and ≥ 0.46 in males, and ≥ 0.75 and ≥ 0.48 in
females, respectively.15 In all these studies,8,9,14,15 as well
as in the current study, the cutoff points obtained are in a similar range, and BPHRs had high accuracy in identifying elevated BP in the pediatric age group. The similarity of the indexes obtained in the present and in previous studies, as well as the appropriate sensitivity and specificity of these indexes in all these studies, indicates that simple indexes of BPHR can be used in various populations of children and adolescents.
Currently, a large number of children and adolescents with pre-HTN and HTN remain undiagnosed. This problem is not restricted to low- and middle-income countries with limited health care facilities; even physicians with access to electronic files and computer programs in industrialized countries still have difficulties with integrating BP monitor-ing of children and adolescents into their routine clinical
practice.16 Providing simple indexes for BPHR would help
the implementation of scientific guidelines for routine mea-surement and tracking of BP from childhood.
By considering the strong effects of overweight, and envi-ronmental factors such as air pollution, noise pollution, and
passive smoking on elevated BP,17---19it is suggested that the
prevalence of pre-HTN and HTN will continue to increase in the pediatric age group. Moreover, elevated BP has various
adverse effects even in children and adolescents.20 Thus,
using simplified diagnostic tools for SBPHR and DBPHR would help to screen and identify children and adolescents who need further assessment for elevated BP.
It should be acknowledged that obtaining BPHR indexes requires the measurement of both BP and height, and also requires the calculation of their ratio; thus, they are subject to measurement error. BPHR indexes cannot be considered
in the diagnosis of elevated BP, but they can be easily used as screening tools.
The optimal thresholds of SBPHR and DBPHR for defining elevated BP were consistent with the corresponding figures in other populations of children and adolescents with
differ-ent racial and ethnic backgrounds,8,9,14,15thus it is suggested
that the use of these simple, inexpensive, and accurate indexes should be standardized into screening programs for elevated BP in the pediatric age group.
Funding
This study was conducted as part of a national school-based survey.
Conflicts of interest
The authors declare no conflicts of interest.
References
1. Balagopal PB, de Ferranti SD, Cook S, Daniels SR, Gidding SS, Hayman LL, et al. Nontraditional risk factors and biomarkers for cardiovascular disease: mechanistic, research, and clinical con-siderations for youth: a scientific statement from the American Heart Association. Circulation. 2011;123:2749---69.
2. Sun SS, Grave GD, Siervogel RM, Pickoff AA, Arslanian SS, Daniels SR. Systolic blood pressure in childhood predicts hypertension and metabolic syndrome later in life. Pediatrics. 2007;119:237---46.
3. Assadi F. The growing epidemic of hypertension among children and adolescents: a challenging road ahead. Pediatr Cardiol. 2012;33:1013---20.
4. Riley M, Bluhm B. High blood pressure in children and adoles-cents. Am Fam Physician. 2012;85:693---700.
5. Lubrano R, Travasso E, Raggi C, Guido G, Masciangelo R, Elli M. Blood pressure load, proteinuria and renal function in pre-hypertensive children. Pediatr Nephrol. 2009;24:823---31. 6. Lucini D, Mela GS, Malliani A, Pagani M. Impairment in
car-diac autonomic regulation preceding arterial hypertension in humans: insights from spectral analysis of beat-by-beat cardio-vascular variability. Circulation. 2002;106:2673---9.
7. National High Blood Pressure Education Program Working Group on High Blood Pressure in Children and Adolescents. The fourth report on the diagnosis, evaluation, and treatment of high blood pressure in children and adolescents. Pediatrics. 2004;114:555---76.
8. Lu Q, Ma CM, Yin FZ, Liu BW, Lou DH, Liu XL. How to simplify the diagnostic criteria of hypertension in adolescents. J Hum Hypertens. 2011;25:159---63.
9. Ejike CE. Blood pressure to height ratios as simple, sensitive and specific diagnostic tools for adolescent (pre)hypertension in Nigeria. Ital J Pediatr. 2011;37:30.
10. Kelishadi R, Ardalan G, Gheiratmand R, Gouya MM, Razaghi EM, Delavari A, et al. Association of physical activity and dietary behaviours in relation to the body mass index in a national sample of Iranian children and adolescents: CASPIAN Study. Bull World Health Organ. 2007;85:19---26.
12. Kelishadi R, Heshmat R, Motlagh ME, Majdzadeh R, Kerama-tian K, Qorbani M, et al. Methodology and early findings of the third survey of CASPIAN Study: a national school-based surveil-lance of students’ high risk behaviors. Int J Prev Med. 2012;3: 394---401.
13. Perkins NJ, Schisterman EF. The inconsistency of ‘‘optimal’’ cutpoints obtained using two criteria based on the receiver operating characteristic curve. Am J Epidemiol. 2006;163:670---5.
14. Lu Q, Ma C, Yin F, Wang R, Lou D, Liu X. Blood pressure-to-height ratio as a screening measure for identifying children with hypertension. Eur J Pediatr. 2013;172:99---105.
15. Galescu O, George M, Basetty S, Predescu I, Mongia A, Ten S, et al. Blood pressure over height ratios: simple and accurate method of detecting elevated blood pressure in children. Int J Pediatr. 2012;2012:253497.
16. Hansen ML, Gunn PW, Kaelber DC. Underdiagnosis of hyperten-sion in children and adolescents. JAMA. 2007;298:874---9. 17. Kelishadi R, Poursafa P, Keramatian K. Overweight, air and noise
pollution: universal risk factors for pediatric pre-hypertension. J Res Med Sci. 2011;16:1234---50.
18. Benz MR, Lee SH, Kellner L, Döhlemann C, Berweck S. Hyperintense lesions in brain MRI after exposure to a mer-curic chloride-containing skin whitening cream. Eur J Pediatr. 2011;170:747---50.
19. Simonetti GD, Schwertz R, Klett M, Hoffmann GF, Schaefer F, Wühl E. Determinants of blood pressure in preschool children: the role of parental smoking. Circulation. 2011;123:292---8. 20. Falkner B, DeLoach S, Keith SW, Gidding SS. High risk blood