Inflammatory and nutritional statuses of patients submitted to
resection of gastrointestinal tumors
Estado inflamatório e nutricional em pacientes submetidos à ressecção cirúrgica
de tumores do trato gastrointestinal
AnA VAlériA GonçAlVes Fruchtenicht1; Aline Kirjner PoziomycK1; Audrey mAchAdodos reis1; cArlos roberto GAliA1; GeorGiA brum KAbKe1; luis FernAndo moreirA, tcbc-rs1
INTRODUCTION
C
ancer has become a public health problem throughout the world, and it is unquestionable that the sharp increase in its incidence represents a crisis for the health systems of several countries1. Malnutrition,which is highly evident when the neoplasm reaches the gastrointestinal tract (GIT), is associated with decreased response to specific treatment and quality of life, with greater risks of postoperative infection and increased morbidity and mortality2. Several methods and tools
for nutritional assessment have been proposed over the years to detect early malnutrition. However, there is no gold standard nutritional evaluation method established for cancer patients. The assessment is highly variable in clinical practice due to a large number of metabolic
changes that affect these patients in different ways3.
There is growing evidence that the systemic inflammatory response associated with cancer has a great influence on disease-related outcomes4. A variety
of prognostic methods for different types of cancer derive from a combination of several pre-existing, simple-to-use biochemical markers, easily measured and often available in clinical practice. On the other hand, inflammatory markers have been consistently studied because of the easy and potential application for cancer prognosis, such as the modified Glasgow Prognostic Score (mGPS), the Neutrophil/Lymphocyte Ratio (NLR), the Onodera Prognostic Nutrition Index (mPNI), the Inflammatory-Nutritional Index (INI) and the adapted version of the Prognostic Inflammatory-Nutritional Index (mPINI). Such markers and instruments based on inflammation could
1 - Federal University of Rio Grande do Sul, Post-Graduation Program in Surgical Sciences, Porto Alegre, RS, Brazil.
A B S T R A C T
Objective: to evaluate the association between the nutritional and the inflammatory statuses of patients with cancer of the gastrointestinal tract undergoing surgical resection and to identify predictors of mortality in these patients. Methods: we conducted a prospective study of 41 patients with gastrointestinal tract cancer submitted to surgery between October 2012 and December 2014. We evaluated the nutritional status by subjective and objective methods. We assessed the inflammatory response and prognosis using the modified Glasgow Prognostic Score (mGPS), Neutrophil/Lymphocyte Ratio (NLR), Onodera Prognostic Nutritional Index (mPNI), Inflammatory-Nutritional Index (INI) and C-Reactive Protein/Albumin ratio (mPINI). Results: half of the patients were malnourished and 27% were at nutritional risk. There was a positive association between the percentage of weight loss (%WL) and the markers NLR (p=0.047), mPINI (p=0.014) and INI (p=0.015). Serum albumin levels (p=0.015), INI (p=0.026) and mPINI (p=0.026) were significantly associated with the PG-SGA categories. On multivariate analysis, albumin was the only inflammatory marker independently related to death (p=0.004). Conclusion: inflammatory markers were significantly associated with malnutrition, demonstrating that the higher the inflammatory response, the worse the PG-SGA (B and C) scores and the higher the %WL in these patients. However, further studies aimed at improving surgical outcomes and determining the role of these markers as predictors of mortality are required.
be useful tools for assessing nutritional status in cancer patients, based on the premise that these patients are in a persistent state of chronic inflammation, a factor that contributes to nutritional depletion and the development of cachexia5. Therefore, recognizing the effects of systemic
inflammation on nutritional depletion could allow appropriate nutritional strategies with the objective of preventing progressive weight loss5,6, reversing the clinical
picture through appropriate and targeted nutritional intervention7, and minimizing or even eliminating the
resulting morbimortality8.
Thus, the main objective of this study was to evaluate the association between the nutritional and the inflammatory statuses in patients with GIT cancer submitted to surgical resection, as well as to identify predictors of mortality in such patients.
METHODS
We conducted a prospective study of 41 patients (20 women and 21 men), with mean age (±SD) of 59 years (±12), attended at the Ambulatory Service of Gastrointestinal Neoplasms of Porto Alegre Clinics Hospital (HCPA/UFRGS) from October 2012 to December 2014. This work belongs to the gastrointestinal tumors research line of the Southern Surgical Oncology Research Group (SSORG), and was approved by the Ethics in Research Committee (HCPA/UFRGS) under protocol number IRB #13-0520.
We included patients older than 18 years, with diagnosis of gastrointestinal cancer in different clinical stages9, with indication of surgical treatment. All
patients were able to communicate, understand, and provide written consent to participate in the study. We excluded patients with previous history of antineoplastic treatment or patients undergoing chemotherapeutic and radiotherapeutic treatment, as well as those with other immunological or catabolic diseases, such as chronic kidney disease and autoimmune diseases.
All patients had their nutritional status assessed during the preoperative outpatient visits through the Patient-Generated Subjective Global Assessment (PG-SGA). We also recorded classical anthropometric variables, including current body weight (BW) and
height, percentage of weight loss (%WL) and body mass index (BMI). Results of PG-SGA were classified as A (well nourished), B (moderately undernourished), and C (severely malnourished)10. BMI was classified according
to the tables proposed by WHO11 and by Lipschitzet al.12
for adult and elderly patients, respectively. We calculated the %WL according to the formula [(usual weight - actual weight) x 100 / usual weight] and classified it according to Blackburn & Bistrian13.
For the evaluation of the inflammatory and prognostic statuses, we used the inflammatory markers modified Glasgow Prognostic Score (mGPS), Neutrophil/ Lymphocyte Ratio (NLR), Onodera Prognostic Nutrition Index (mPNI), Inflammatory-Nutritional Index (INI), and modified Prognostic Inflammatory-Nutritional Index (mPINI). At the time of the preoperative interview, we requested the laboratory tests CRP, albumin, neutrophils and lymphocytes, necessary for classification of the markers, and the results were retrieved from the electronic medical records.
We considered levels of albumin <35g/L and CRP>10mg/L in the sample as altered. For classification of mGPS, we evaluated albumin and CRP and defined the score based on the combination of the results. Patients with high CRP (>10mg/L) and hypoalbuminemia (<35g/L) received a score equal to 2, associated with a worse prognosis. Patients with only altered serum CRP (>10 mg/L) received a score equal to 1, and those with no alterations in these values (serum CRP≤10mg/L and albumin ≥35g/L) received score 04. For the classification of NLR (defined
as the ratio between the absolute neutrophil counts and the absolute lymphocyte count), we considered abnormal values ≥514.
We calculated the mPNI by the formula: 10 x serum albumin (g/dL) + 0.005 × lymphocyte count (per mm3). Values <40 were related to the worse prognosis15.
The INI, based on the albumin/CRP ratio, classifies patients as well-nourished (ASG A) with values =1.25, while malnourished ones (ASG C) display values =0.106.
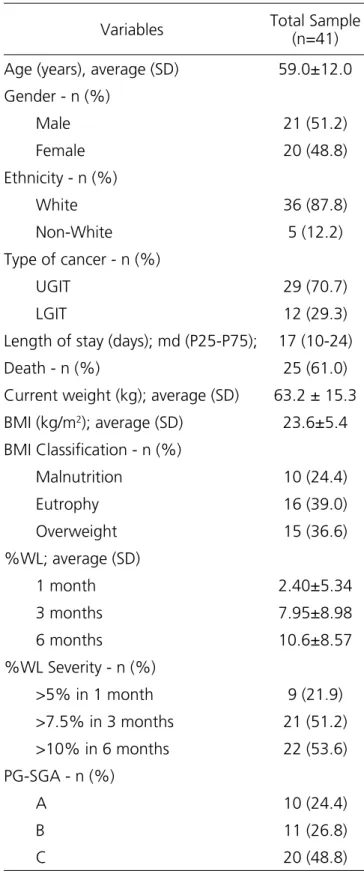
Table 1- Characterization of the sample.
Variables Total Sample (n=41)
Age (years), average (SD) 59.0±12.0
Gender - n (%)
Male 21 (51.2)
Female 20 (48.8)
Ethnicity - n (%)
White 36 (87.8)
Non-White 5 (12.2)
Type of cancer - n (%)
UGIT 29 (70.7)
LGIT 12 (29.3)
Length of stay (days); md (P25-P75); 17 (10-24)
Death - n (%) 25 (61.0)
Current weight (kg); average (SD) 63.2 ± 15.3
BMI (kg/m2); average (SD) 23.6±5.4
BMI Classification - n (%)
Malnutrition 10 (24.4)
Eutrophy 16 (39.0)
Overweight 15 (36.6)
%WL; average (SD)
1 month 2.40±5.34
3 months 7.95±8.98
6 months 10.6±8.57
%WL Severity - n (%)
>5% in 1 month 9 (21.9)
>7.5% in 3 months 21 (51.2)
>10% in 6 months 22 (53.6)
PG-SGA - n (%)
A 10 (24.4)
B 11 (26.8)
C 20 (48.8)
UGIT= upper gastrointestinal tract; LGIT= lower gastrointestinal tract; BMI= body mass index; %WL= percentage of weight loss; PG-SGA= Patient-Generated Subjective Global Assessment; SD= Standard Deviation; md= median.
mortality rate, we verified death through the electronic medical record or, when this information was not available, by telephone contact with patients’ relatives. The mean follow-up time was 1.5 years (30 days to 4 years).
For statistical analysis, due to the small sample size, we grouped the patients with mGPS scores 1 and 2, associated with a worse prognosis, and compared them with patients with score 0. We did the same for the PG-SGA, in which patients classified as grades B and C were considered undernourished, while patients classified as grade A were considered well nourished.
We described quantitative variables by mean and standard deviation or median and interquartile range. For comparison of means, we used student’s t-test for independent samples and, in case of asymmetry, the Mann-Whitney test. We described qualitative variables using absolute and relative frequencies. For comparison of proportions between the groups, we applied Pearson’s chi-square test or Fisher’s exact test. To evaluate association between quantitative and ordinal variables, we used Pearson or Spearman linear correlation tests, respectively. To control confounding factors in relation to death and malnutrition by PG-SGA, we used the Poisson Regression model. As an effect measure, we calculated the Relative Risk (RR) with the respective 95% confidence intervals. The criterion for inclusion of a variable in the multivariate model was a p-value <0.20 in the bivariate analysis. On multivariate model for malnutrition, we considered each marker separately to control effect of multicollinearity, and calculated the risk of other variables in relation to the best predictor. The significance level adopted was 5% (p≤0.05) and we analyzed the data with the SPSS software (Statistical Package for the Social Sciences), version 18.0.
RESULTS
Most patients presented disease in advanced clinical stages, with 34 (83%) in stages III/IV. Twenty-five (61%) patients died during the postoperative period. The mean time of death was ten months (one day to two years) and the mean time (md) of hospitalization was 17 (10 to 24) days, with no relation to mortality in these patients (p=0.702).
According to the evaluation of nutritional status by the PG-SGA, almost half of the patients were malnourished (49%) or at risk of malnutrition (27%) (classification of subgroups in C and B, respectively), while the BMI classified only 24% of the patients as malnourished.
We found a high prevalence of systemic
inflammation represented by altered values of CRP (70%) and a high risk of complications represented by mPINI (73%). As for the other inflammatory markers, both mGPS (1 and 2) and mPNI (<40) displayed altered results in the studied population (70% and 56%, respectively).
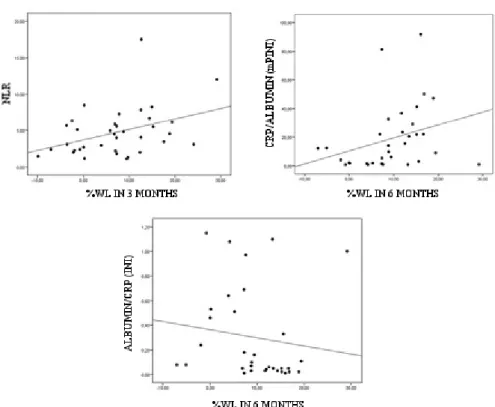
We observed statistically significant associations between %WL at three months with NLR (rs=0.334, p=0.047) and %WL at six months with mPINI (rs=0.422, p=0.014) and INI (rs=-0.420, p=0.015), demonstrating that the more altered the inflammatory markers, the higher the percentage of weight loss during the months (Figure 1).
Figure 1. Association between inflammatory markers and %WL.
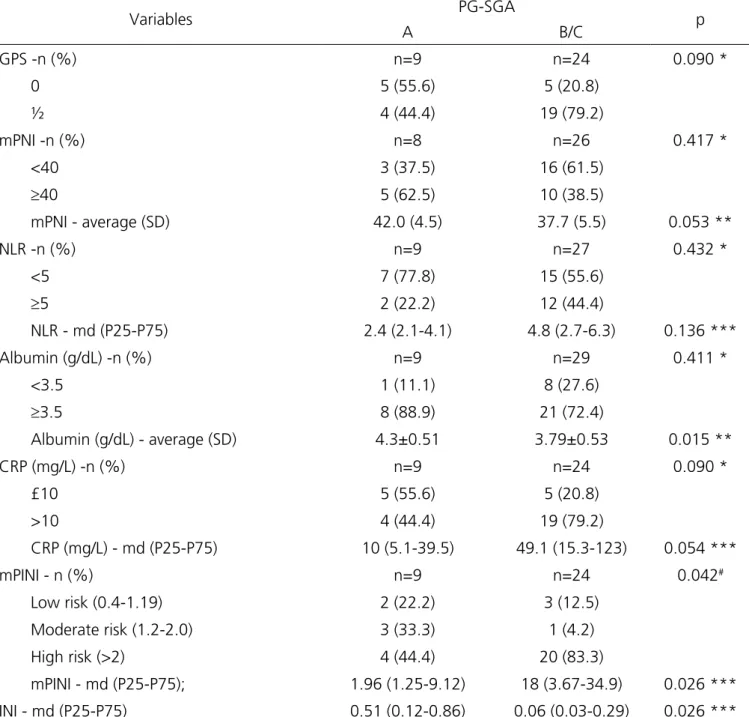
We found no statistically significant association between the PG-SGA and the markers mGPS (p=0.090), NLR (p=0.432) and mPNI (p=0.417). In contrast, the
Table 2. Association of PG-SGA with inflammatory markers.
Variables PG-SGA p
A B/C
GPS -n (%) n=9 n=24 0.090 *
0 5 (55.6) 5 (20.8)
½ 4 (44.4) 19 (79.2)
mPNI -n (%) n=8 n=26 0.417 *
<40 3 (37.5) 16 (61.5)
≥40 5 (62.5) 10 (38.5)
mPNI - average (SD) 42.0 (4.5) 37.7 (5.5) 0.053 **
NLR -n (%) n=9 n=27 0.432 *
<5 7 (77.8) 15 (55.6)
≥5 2 (22.2) 12 (44.4)
NLR - md (P25-P75) 2.4 (2.1-4.1) 4.8 (2.7-6.3) 0.136 ***
Albumin (g/dL) -n (%) n=9 n=29 0.411 *
<3.5 1 (11.1) 8 (27.6)
≥3.5 8 (88.9) 21 (72.4)
Albumin (g/dL) - average (SD) 4.3±0.51 3.79±0.53 0.015 **
CRP (mg/L) -n (%) n=9 n=24 0.090 *
£10 5 (55.6) 5 (20.8)
>10 4 (44.4) 19 (79.2)
CRP (mg/L) - md (P25-P75) 10 (5.1-39.5) 49.1 (15.3-123) 0.054 ***
mPINI - n (%) n=9 n=24 0.042#
Low risk (0.4-1.19) 2 (22.2) 3 (12.5)
Moderate risk (1.2-2.0) 3 (33.3) 1 (4.2)
High risk (>2) 4 (44.4) 20 (83.3)
mPINI - md (P25-P75); 1.96 (1.25-9.12) 18 (3.67-34.9) 0.026 ***
INI - md (P25-P75) 0.51 (0.12-0.86) 0.06 (0.03-0.29) 0.026 ***
* Fisher exact test; ** student’s t test; *** Mann-Whitney Test; # Pearson’s Chi-square Test; PG-SGA= Patient-Generated Subjective Global Assessment; GPS= Glasgow Prognostic Score; mPNI= modified Prognostic Nutritional Index; NLR= Neutrophil/Lymphocyte ratio; CRP= C-Reactive Protein; mPINI= modified Prognostis Inflammatory and Nutritional Index; INI= Inflammatory Nutritional Index; SD= Standard Deviation; md= median.
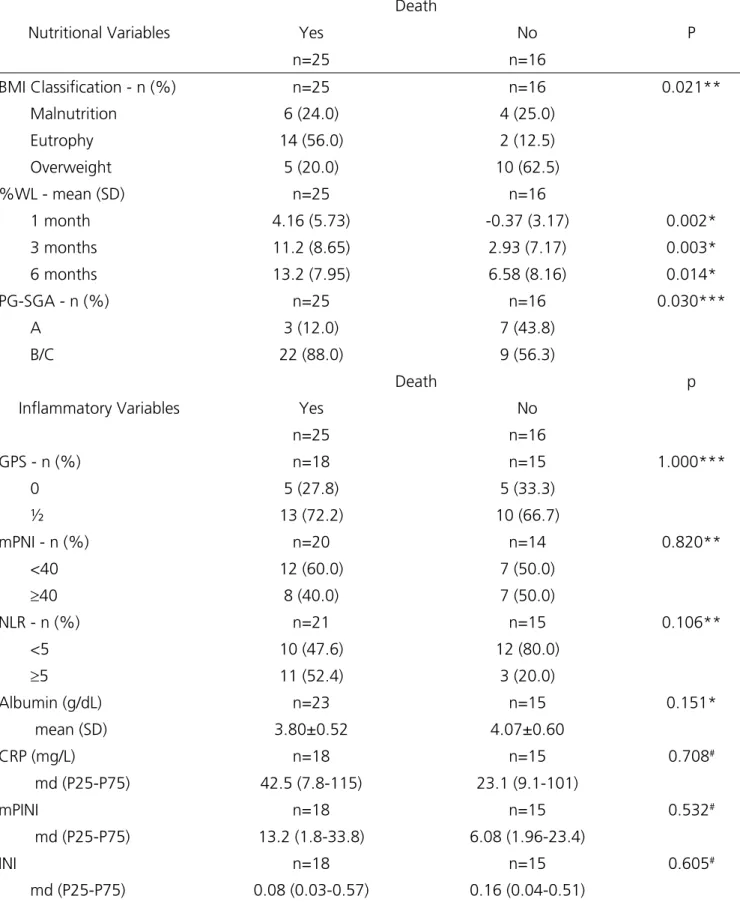
There was a statistically significant association between mortality and tumor staging (p=0.008), BMI (p=0.021), PG-SGA (p=0.030) and %WL at one month (p=0.002), three months (p=0.003) and six months
Table 3. Association of variables with death.
Nutritional Variables
Death
P
Yes No
n=25 n=16
BMI Classification - n (%) n=25 n=16 0.021** Malnutrition 6 (24.0) 4 (25.0)
Eutrophy 14 (56.0) 2 (12.5)
Overweight 5 (20.0) 10 (62.5) %WL - mean (SD) n=25 n=16
1 month 4.16 (5.73) -0.37 (3.17) 0.002*
3 months 11.2 (8.65) 2.93 (7.17) 0.003*
6 months 13.2 (7.95) 6.58 (8.16) 0.014*
PG-SGA - n (%) n=25 n=16 0.030***
A 3 (12.0) 7 (43.8)
B/C 22 (88.0) 9 (56.3)
Inflammatory Variables
Death p
Yes No
n=25 n=16
GPS - n (%) n=18 n=15 1.000***
0 5 (27.8) 5 (33.3)
½ 13 (72.2) 10 (66.7)
mPNI - n (%) n=20 n=14 0.820** <40 12 (60.0) 7 (50.0)
≥40 8 (40.0) 7 (50.0)
NLR - n (%) n=21 n=15 0.106**
<5 10 (47.6) 12 (80.0)
≥5 11 (52.4) 3 (20.0)
Albumin (g/dL) n=23 n=15 0.151*
mean (SD) 3.80±0.52 4.07±0.60
CRP (mg/L) n=18 n=15 0.708#
md (P25-P75) 42.5 (7.8-115) 23.1 (9.1-101)
mPINI n=18 n=15 0.532#
md (P25-P75) 13.2 (1.8-33.8) 6.08 (1.96-23.4)
INI n=18 n=15 0.605#
md (P25-P75) 0.08 (0.03-0.57) 0.16 (0.04-0.51)
* Student’s t test; ** Pearson’s Chi-square test; Fisher’s exact test; # Mann Whitney test. BMI= body mass index; %WL= percentage of weight loss;
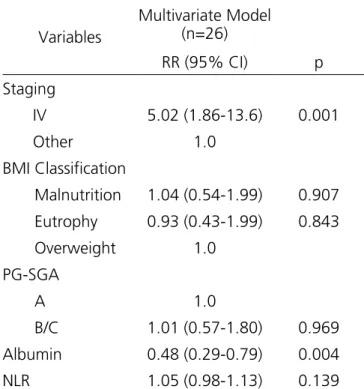
The NLR was the marker that most correlated with death. Significantly higher NLR values were found in death cases (p=0.033), when comparing patients who died (median 5.12) with those who did not (median 2.95). After multivariate analysis, however, NLR did not remain statistically significant as a predictor of mortality (p=0.139). In the multivariate analysis assessing factors independently associated with death, tumor staging (p=0.001) and albumin (p=0.004) were the only independent predictors of mortality (Table 4).
Table 4. Multivariate Analysis through the Poisson regression model to evaluate factors independently associated with death.
Variables
Multivariate Model (n=26)
RR (95% CI) p
Staging
IV 5.02 (1.86-13.6) 0.001
Other 1.0 BMI Classification
Malnutrition 1.04 (0.54-1.99) 0.907
Eutrophy 0.93 (0.43-1.99) 0.843 Overweight 1.0
PG-SGA
A 1.0
B/C 1.01 (0.57-1.80) 0.969 Albumin 0.48 (0.29-0.79) 0.004
NLR 1.05 (0.98-1.13) 0.139
BMI= body mass index; PG-SGA= Patient-Generated Subjective Global Assessment; NLR= Neutrophil/Lymphocyte ratio; RR= Relative Risk; CI= confidence interval.
DISCUSSION
Malnutrition was highly prevalent in the patients included in this study. According to the global subjective assessment (PG-SGA), 76% of the patients were malnourished or at risk of malnutrition (categories B and C), whereas BMI detected less than a quarter of undernourished patients. A similar result was found in a previous study (n=30) that evaluated preoperatively
patients with GIT tumors, where PG-SGA detected 83% of malnutrition and BMI was able to detect malnutrition in only 40% of the patients16. In another study conducted
with 51 patients with advanced colorectal cancer, PG-SGA was able to detect 56% of malnourished patients or at nutritional risk, whereas BMI was not a sensitive measure according to the authors17.
Although BMI is a commonly used measure in the evaluation of nutritional status, including surgical and oncological patients, these results demonstrate that BMI cannot be relied upon to evaluate malnutrition, because it is not an appropriate tool to differentiate body components16,18. In the present study, the results for BMI
were not statistically significant in the multivariate analysis to assess independent factors associated with PG-SGA malnutrition (RR 0.98, 95% CI 0.93-1.04, p=0.491).
Due to the inadequacy of several methods for evaluating nutritional status when used alone, studies have been undertaken with the objective of combining the evaluation measures, such as anthropometric, laboratory and subjective tools, in order to increase the sensitivity and specificity of the methods, which would allow to evaluate and to draw nutritional strategies more suitable for these patients18.
Recently, studies have demonstrated an important association between nutritional depletion and inflammation in cancer patients4-6,14,16,17,19-22, including
GIT tumors. Since cancer patients are in a constant state of inflammation, and considering the role of this systemic inflammation in progressive weight loss and muscle mass, cancer cachexia can be identified by the presence and alteration of certain inflammatory markers5-7. In our study,
several inflammatory markers were altered, especially in patients with high weight loss and malnourished, demonstrating that, as marker values were inadequate, inflammation was worse and %WL was higher. Limaet al.16 and Costa et al.19 evaluated the association between
may compromise the comparison and extrapolation of the data6,14.
Both mGPS and NLR have been proposed as markers of inflammatory response and predictors of prognosis in surgical procedures23, and the association
between these markers and nutritional status has been previously assessed14,22. A recent Asian study of 64 patients
with esophageal cancer found a strong association between nutritional status by PG-SGA and performance scores. However, such association was weak in relation to prognostic scores such as GPS22. On the other hand, in a
study including patients with advanced tumors (n=114), the authors found that 60% of the patients who were malnourished by the PG-SGA presented high mGPS when compared with well-nourished ones (p=0.046). Although in our study 79% of malnourished patients had high mGPS compared with well-nourished individuals, this difference was not significant. The same occurs with NLR, since the authors found a significant association between the PG-SGA categories with this inflammatory marker, which we did not observe, and that can be justified by the inclusion, in our study, only patients with GIT tumors, or even by the size of the sample14.
When we compared the PG-SGA with the inflammatory markers, only INI, mPINI and albumin were significantly associated with the subjective evaluation categories. The Inflammatory-Nutritional Index (INI) was developed with the purpose of investigating the relationship between the inflammatory state and the nutritional status. In the present study, malnourished patients had significantly lower INI values when compared with well-nourished ones, a result similar to that reported in a study conducted by Alberici et al.6.
We also assessed the CRP/albumin ratio (mPINI), considered an alternative for the simplification of the original formula of the Inflammatory and Nutritional Prognostic Index (PINI) to determine the association between the nutritional status and the systemic inflammatory response in patients with gastrointestinal cancer16,19. In our study, the PG-SGA
scores were significantly associated with mPINI and albumin, demonstrating that malnourished patients had a high risk of complications and lower albumin values when compared with well-nourished individuals. This was similar to that shown in the study including patients with
GIT tumors (n=30) conducted by Lima et al.16 in which
patients considered to be undernourished by the global subjective assessment had significantly higher values of mPINI (p=0.014), as well as lower values of albumin (p=0.017) compared with well-nourished ones.
CRP is an important marker of systemic inflammatory response expressed by some tumor cells. Elevated CRP values have been demonstrated as a reliable marker of malignancy potential and of predicted prognosis in several solid tumors24. Some studies found
a positive association between altered CRP levels and weight loss in patients with GIT tumors16,19,25. In this
study, despite the altered CRP values in most cases, the association between CRP, malnutrition and mortality was not observed, mainly due to its high variability or due to the small number of subgroups. On the other hand, in a study conducted by Readet al.17 with patients
with advanced colorectal cancer, they initially found a positive correlation between PG-SGA and CRP (r=0.430; p=0.003). However, when two outliers were excluded, the association did not remain significant (r=0.278, p=0.065).
Although initially proposed as a marker for the nutritional status of patients with GIT neoplasms, mPNI is likely to reflect the degree of systemic inflammation that affects cancer patients. Pinato et al.26 suggested
the need to correlate mPNI with nutritional assessment instruments widely used in cancer patients, such as PG-SGA, with the aim of improving the results. This study performed this association and, although the mPNI values were abnormal in the sample, especially in malnourished patients, this association was not statistically significant.
As expected, we evidenced high mortality in patients with gastrointestinal tumors at more advanced stages of the disease, similarly to a previous study in esophageal cancer (n=141), in which tumor staging (TNM) was independently associated with worse prognosis in the multivariate analysis (p<0,0001)27.
the use of these markers as predictors of short-term outcomes and morbidity and mortality, and the results are still contradictory27,31-34.
Hypoalbuminemia is a consequence of systemic inflammation and is associated with a worse prognosis in cancer patients35. With the exception of albumin, no
other inflammatory marker in our study was a predictor of mortality in the multivariate analysis. Poziomyck et al.34
reported a similar result in gastric cancer patients (n=44), in whom albumin was highly capable of predicting 30-day mortality (p=0.026). Albumin has been widely used as a measure of nutritional and inflammatory statuses of cancer patients. Altered preoperative albumin levels have proven to be a better predictor of postoperative mortality for various types of cancer, including GIT tumors. However, this marker is not a reliable indicator of
nutritional assessment, because its results are influenced by non-nutritional factors6,7.
We found a high prevalence of malnutrition and systemic inflammation in patients with GIT cancer submitted to surgical resection. The results showed a significant association between nutritional status and inflammatory markers, evidenced by the worse PG-SGA scores and percentage of weight loss, in addition to the high inflammatory response. Regarding mortality, only albumin and tumor staging were independently related to death in the population. Because of the lack of studies associating inflammatory markers with nutritional assessment methods, such as PG-SGA for example, and studies evaluating the use of these markers for mortality outcomes, more research is needed to better compare and discuss such results adequately.
Objetivo: avaliar a associação entre o estado nutricional e inflamatório em pacientes com câncer do trato gastrointestinal submetidos à ressecção cirúrgica e identificar variáveis preditoras de mortalidade nestes pacientes. Métodos: estudo prospectivo de 41 pacientes com câncer do trato gastrointestinal submetidos à cirurgia entre outubro de 2012 e dezembro de 2014. O estado nutricional foi avaliado por métodos subjetivos e objetivos. A resposta inflamatória e o prognóstico foram avaliados através do Escore Prognóstico de Glasgow modificado (mGPS), razão Neutrófilo/Linfócito (NLR), Índice Nutricional Prognóstico de Onodera (mPNI), Índice Inflamatório Nutricional (INI) e razão Proteína C-reativa/Albumina (mPINI). Resultados: metade dos pacientes estava desnutrida e 27% apresentavam-se em risco nutricional. Associação positiva foi encontrada entre percentual de perda de peso (%PP) e os marcadores NLR (p=0,047), mPINI (p=0,014) e INI (p=0,015) e os níveis séricos de albumina (p=0,015), INI (p=0,026) e mPINI (p=0,026) se associaram significativamente às categorias da ASG-PPP. Na análise multivariada, a albumina foi o único marcador inflamatório independentemente relacionado ao óbito (p=0,004). Conclusão: marcadores inflamatórios foram significativamente associados com a desnutrição, demonstrando que quanto maior a resposta inflamatória, piores foram os escores da ASG-PPP (B e C) e maior o %PP nesses pacientes. No entanto, mais estudos, com o objetivo de melhorar resultados cirúrgicos e determinar o papel desses marcadores como preditores de mortalidade são necessários.
Descritores: Neoplasias Gastrointestinais. Estado Nutricional. Inflamação. Mortalidade.
R E S U M O
REFERENCES
1. Ferlay J, Soerjomataram I, Dikshit R, Eser S, Mathers C, Rebelo M, et al. Cancer incidence and mortality worldwide: sources, methods and major patterns in GLOBOCAN 2012. Int J Cancer. 2015;136(5):E359-86.
2. Silva MPN. Síndrome da anorexia-caquexia em portadores de câncer. Rev Bras Cancerol. 2006;52(1):59-7.
3. Nourissat A, Mille D, Delaroche G, Jacquin JP, Vergnon JM, Fournel P, et al. Estimation of the risk for nutritional state degradation in patients with cancer: development of a screening tool based on results from a cross-sectional survey. Ann Oncol. 2007;18(11):1882-6.
4. McMillan DC. Systemic inflammation, nutritional status and survival in patients with cancer. Curr Opin Clin Nutr Metab Care. 2009;12(3):223-6.
relationship between nutritional status and the Glasgow prognostic score in patients with cancer of the esophagus and stomach. Nutr Cancer. 2013;65(1):25-33.
6. Alberici Pastore C, Paiva Orlandi S, González MC. Association between an inflammatory-nutritional index and nutritional status in cancer patients. Nutr Hosp. 2013;28(1):188-93.
7. Barbosa-Silva MC. Subjective and objective nutritional assessment methods: what do they really assess? Curr Opin Clin Nutr Metab Care. 2008;11(3):248-54. 8. ASPEN Board of Directors and the Clinical Guidelines
Task Force. Guidelines for the use of parenteral and enteral nutrition in adults and pediatrics patients. Erratum in: J Parenter Enter Nutr. 2002;26(1 Suppl):1SA-138SA.
9. Sobin LH, Compton CC. TNM seventh edition: what’s new, what’s changed: communication from the International Union Against Cancer and the American Joint Committee on Cancer. Cancer. 2010;116(22):5336-9.
10. Ottery FD. Definition of standardized nutritional assessment and interventional pathways in oncology. Nutrition. 1996;12(1 Suppl):S15-9.
11. World Health Organization. Obesity: preventing and managing the global epidemic. Geneva: WHO; 1997. 12. Lipschitz DA. Screening for nutrition status in the
elderly. Prim Care. 1994;21(1):55-67.
13. Blackburn GL, Bristian BR, Maini BS, Schlamm HT, Smith MF. Nutritional and metabolic assessment of the hospitalized patient. JPEN J Parenter Enteral Nutr. 1977;1(1):11-22.
14. Tan CS, Read JA, Phan VH, Beale PJ, Peat JK, Clarke SJ. The relationship between nutritional status, inflammatory markers and survival in patients with advanced cancer: a prospective cohort study. Support Care Cancer. 2015;23(2):385-91.
15. Eo WK, Chang HJ, Suh J, Ahn J, Shin J, Hur JY, et al. The prognostic nutritional index predicts survival and identifies aggressiveness of gastric cancer. Nutr Cancer. 2015;67(8):1260-7.
16. Lima KVG, Maio R. Nutritional status, systemic inflammation and prognosis of patients with gastrointestinal cancer. Nutr Hosp. 2012;27(3):707-14.
17. Read JA, Choy ST, Beale PJ, Clarke SJ. Evaluation of nutritional and inflammatory status of advanced colorectal cancer patients and its correlation with survival. Nutr Cancer. 2006;55(1):78-85.
18. Poziomyck AK, Fruchtenicht AV, Kabke GB, Volkweis BS, Antoniazzi JL, Moreira LF. Reliability of nutritional assessment in patients with gastrointestinal tumors. Rev Col Bras Cir. 2016;43(3):189-97.
19. Costa MD, Vieira de Melo CY, Amorim AC, Cipriano Torres O, Dos Santos AC. Association between nutritional status, inflammatory condition, and prognostic indexes with postoperative complications and clinical outcome of patients with gastrointestinal neoplasia. Nutr Cancer. 2016;68(7):1108-14.
20. Maurício SF, da Silva JB, Bering T, Correia MI. Relationship between nutritional status and the Glasgow Prognostic Score in patients with colorectal cancer. Nutrition. 2013;29(4):625-9.
21. Daniele A, Divella R, Abbate I, Casamassima A, Garrisi VM, Savino E, et al. Assessment of nutritional and inflammatory status to determine the prevalence of malnutrition in patients undergoing surgery for colorectal carcinoma. Anticancer Res. 2017;37(3):1281-7.
22. Quyen TC, Angkatavanich J, Thuan TV, Xuan VV, Tuyen LD, Tu DA. Nutrition assessment and its relationship with performance and Glasgow prognostic scores in Vietnamese patients with esophageal cancer. Asia Pac J Clin Nutr. 2017;26(1):49-58.
23. Maeda K, Shibutani M, Otani H, Nagahara H, Ikeya T, Iseki Y, et al. Inflammation-based factors and prognosis in patients with colorectal cancer. World J Gastrointest Oncol. 2015;7(8):111-7.
24. Crumley AB, McMillan DC, McKernan M, Going JJ, Shearer CJ, Stuart RC. An elevated C-reactive protein concentration, prior to surgery, predicts poor cancer-specific survival in patients under- going resection for gastro-oesophageal cancer. Br J Cancer. 2006;94(11):1568-71.
validated inflammation-based prognostic algorithm in hepatocellular carcinoma: the prognostic nutritional index (PNI). Br J Cancer. 2012;106(8):1439-45. 27. Hirahara N, Matsubara T, Hayashi H, Takai K, Fujii Y,
Tajima Y. Impact of inflammation-based prognostic score on survival after curative thoracoscopic esophagectomy for esophageal cancer. Eur J Surg Oncol. 2015;41(10):1308-15.
28. Proctor MJ, Morrison DS, Talwar D, Balmer SM, O Reilly DS, Foulis AK, et al. An inflammation-based prognostic score (mGPS) predicts cancer survival independent of tumour site: a Glasgow inflammation outcome study. Br J Cancer. 2011;104(4):726-34. 29. La Torre M, Nigri G, Cavallini M, Mercantini P, Ziparo
V, Ramacciato G. The Glasgow prognostic score as a predictor of survival in patients with potentially resectable pancreatic adenocarcinoma. Ann Surg Oncol. 2012;19(9):2917-23.
30. Sun K, Chen S, Xu J, Li G, He Y. The prognostic significance of the prognostic nutritional index in cancer: a systematic review and meta-analysis. J Cancer Res Clin Oncol. 2014;140(9):1537-49.
31. Walsh SM, Casey S, Kennedy R, Ravi N, Reynolds JV. Does the modified Glasgow Prognostic Score (mGPS) have a prognostic role in esophageal cancer? J Surg Oncol. 2016;113(7):732-7.
32. Jaramillo-Reta KY, Velázquez-Dohorn ME, Medina-Franco H. Neutrophil to lymphocyte ratio as predictor of surgical mortality and survival in complex surgery of the upper gastrointestinal tract. Rev Invest Clin. 2015;67(2):117-21.
33. Rashid F, Waraich N, Bhatti I, Saha S, Khan RN, Ahmed J, et al. A pre-operative elevated neutrophil: lymphocyte ratio does not predict survival from oesophageal cancer resection. World J Surg Oncol. 2010;8:1.
34. Poziomyck AK, Cavazzola LT, Coelho LJ, Lameu EB, Weston AC, Moreira LF. Nutritional assessment methods as predictors of postoperative mortality in gastric cancer patients submitted to gastrectomy. Rev Col Bras Cir. 2017;44(5):482-90.
35. Hirashima K, Watanabe M, Shigaki H, Imamura Y, Ida S, Iwatsuki M, et al. Prognostic significance of the modified Glasgow prognostic score in elderly patients with gastric cancer. J Gastroenterol. 2014;49(6):1040-6.
Received in: 30/01/2018
Accepted for publication: 13/03/2018 Conflict of interest: none.
Source of funding: FIPE HCPA, Research Fund and Post-Graduate Program in Surgical Sciences, Federal University of Rio Grande do Sul, Porto Alegre, RS, Brazil.
Mailing address: Luis Fernando Moreira