Assessment of Chemical and Mechanical Properties of Polymers Aiming to Replace the
Stainless Steel in Distillation Column
Caroline Barlette da Cunhaa*, Poliana Pollizello Lopesa, Flávio Dias Mayera, Ronaldo Hoffmanna
Received: July 23, 2017; Revised: January 11, 2018; Accepted: February 26, 2018
Small scale ethanol production process faces a number of challenges that negatively impact
productivity and economic costs. The present work aims at finding alternative materials with lower
cost and suitable resistance to replace the stainless steel commonly used in distillation columns in
small scale businesses. For that we analyzed the chemical and mechanical behavior of nine different
polymeric materials. An important parameter to consider in this case is the compatibility of polymer with the ethanol, which was determined according to the ASTM D543, as well as the swelling degree
and ethanol diffusion in material being also studied in this work. Three-point flexural tests were
performed because the material when in service is subjected to forces or loads. The results show that some of the materials under test present chemical resistance and satisfactory mechanic performance after the contact with the ethanol in temperatures compatible with the distillation process.
Keywords: Distillation column, polymers, chemical resistance.
*e-mail: [email protected]
1. Introduction
Small scale production of ethanol, under 5.000 l/day,
has some drawbacks such as the low extraction of must, ethanol separation inefficiency presented in the fermented
and the separation process, which results in losses and high energy consumption.
Other points to be considered involving this activity are the high economical costs associated with the workforce and the necessity of a high investment in the equipment fabrication for the bioethanol separation process, especially the distillation columns1-3.
The distillation columns became subject of discussions and studies in the last decades, due to high maintenance and functioning costs, which can be higher than the total costs of many other processes in the micro distilleries. In order to address these issues new ways of reducing costs with equipment must be researched and developed technically and economically viable distillation columns4.
To minimize costs and improve the ethanol production process, researchers have been evaluating the use of new materials for the construction of parts of the distillation columns, that is, trays/plates5 and random packings, such
as, raschig ring of alternative material as: plastic6; glass7;
ceramics8-10, among others6. Polymers stand out due to
their low cost, low density, ease of conformation and high chemical resistance11-13.
One of the parameters to be evaluated when using a polymer in an industrial application, is its behavior with chemical agents which may impact its physical and/or
chemical resistance, potentially decreasing its lifespan.
Therefore, the polymer parts exposure to particular liquids
may result in possible degradation and swelling, dissolution
or the break of bonds that occur due to the liquid diffusion in the material structure. This diffusion entails the separation
of macromolecules and the increase of free volume, leading
to the expansion or swelling of the material and resulting in
the intermolecular force decrease, which makes the material less resistant, more ductile and with higher permeability rates14-17. Yet, some polymers can be extremely resistant to many solvents and chemical products such as water, inorganic acid and basic solutions.
In this work, an evaluation of different polymeric materials
will be made, taking into consideration their chemical and
mechanical resistance in contact with ethanol aiming to find
a polymer with desirable characteristics to be used to replace the stainless steel.
2. Experimental
2.1 Materials selection
The polymeric materials selection took as a basis polymers with lower costs than the stainless steel and with
different structures.
Thus, nine polymeric materials were selected, namely: polyamide 6 (PA6), polypropylene (PP), high density polyethylene (HDPE), polyvinyl chloride (PVC), polycarbonate (PC), Poly methyl methacrylate (PMMA), bakelite, polyurethane (PU)
aDepartamento de Engenharia Química, Universidade Federal de Santa Maria, Av. Roraima, 1000,
and the GFRP (glass fiber reinforced polymer) composite. This composite was manually laminated using E-glass fibre
(30%) with unsaturated polyester resin.
2.2 Chemical Resistance
The polymers chosen were submitted to chemical resistance testing in contact with ethanol that followed the
standard ASTM D 543 - Standard Practices for Evaluating
the Resistance of Plastics to Chemical Reagents18. All the
tests were made in the Renewable Fuel Processing Lab -
PROCORE.
The tests were made with ethanol produced from a small
scale process, at the semi-commercial pilot plant located in Universidade Federal de Santa Maria - UFSM, Rio Grande
do Sul. This plant operates in discontinuous system, in other words, with distillation in batches, generating ethanol from many raw materials. The plant produces about 48.000L of
ethanol per year and the alcohol produced is used for
self-consumption, that is for the fueling of the institution vehicles19.
Firstly, it was made a preliminary test considering only two samples of each polymer to observe their behavior in
contact with ethanol in different temperatures. The polymeric
material samples (PP, HDPE, PA6, PMMA, PC, PVC, PU, bakelite e GFRP) were weighed in an analytical balance (Brand: Marte, model AY220), and to measure the polymer
plates superficial area a stainless steel vernier caliper used.
The samples were inserted in 6 stainless steel autoclaves
composed of Teflon® reservoir with external dimensions of
15,4x4,9 cm and internal of 12,9x3,9 cm, and subsequently
submerged in ethanol 85,0% w/w, characteristic concentration of the discontinuous process used by the UFSM pilot plant. To avoid interference with the tests, the samples were placed in a wire structure, preventing a possible contact among the polymeric materials. The autoclaves were put in the oven at
distillation process characteristic temperature - 90° e 115°C, the maximum temperature reached in a distillation process in small scale is 115°C, so this temperature was chosen. They
were shaked every 24 hours during seven days. After this period new measurements of weight and area were taken. Posteriorly, the samples returned to the autoclaves and to the oven during 30 days of testing, after this period, weight and area were measured once again. The purpose of measuring the weight and area was to detect the degree of swelling, which was done through equation 120, and the increase of
area in contact with ethanol.
(1)
Where Wwet is the mass (g) of the wet material and Wdry is the mass (g) of the dry material, that is, before the contact with the liquid.
The polymers with better performance in the preliminary test, lower swelling degrees and area alteration, were selected
for a new chemical resistance testing, considering the same conditions mentioned above. For this testing seven samples for each temperature were used, but now, besides the measures mentioned, it was made the material characterization and the evaluation of the mechanical behavior.
2.3 Characterizations
To follow the polymer structure alteration during the
immersion in ethanol at concentration of 85% w/w, X-ray diffraction analysis (XRD) and Fourier transform infrared
spectroscopy (FTIR) were made.
The equipment used for the XRD analysis was under the
brand name of Rigaku, model miniflex 300, at a scanning speed of 0.5 seconds, with copper Kα radiations, wavelength (λ) of 1,54051 Å, 30kV voltage and 10mA current. The crystallinity index (CI) was obtained through equation 2,
where Ic corresponds to the area of crystalline region and Ia to the area of amorphous region, that were achieved with the support of the Origin 6.0 program21. For the PP it was
considered the area in the range of 12.5 a 23.5° and for the HDPE in the range of 18.05 a 25.01°. For the GFRP the crystallinity index was not determined because the material
was an amorphous polymer.
(2)
For the FTIR characterization equipment was used under the brand Shimadzu, model IR prestige 2l, at a scanning of 450 until 4000 and number of scans of 45. The samples were presented in the form of tablets with analytical KBr pressed to 80 tons during 10 minutes.
2.4 Mechanical properties
To check the mechanical performance of the samples after
the contact with ethanol, three-point flexural tests were made,
according to the procedure of the ASTM D 790 Standard
Test Method for Flexural Properties of Unreinforced and
Reinforced Plastics and Electrical Insulating Materials22.
For the testing, it was used the procedure A, because it is
the most common method when you want to obtain flexural
properties13. According to the ASTM D 790 standard, the
following parameters were defined for the Flexural test
specimens, according Figure 1.
The testing was made at the Laboratório de Apoio ao
Desenvolvimento e Inovação de Produtos e Processos -
LADIPP and the equipment used was EMIC, model DL 2000, with 1 KN load cell. The testing speed was calculated according to the ASTM D 790 and obtained the speed of
1.3 mm/min, being admitted in the testing the maximum
deformation permitted of 5%. The deformation rate was of 0.01 mm/mm/min, the distance between the supports was of 48mm. Besides that, it was respected the humidity of 50%
(± 5%) and the temperature about 23° C (± 2°C).
%
deg
Swelling
ree
W
W
W
100
dry wet dry
#
=
-Q V
Figure 1. Test specimens based on ASTM D79 for flexural testing.
The maximum flexural stress obtained was calculated
through equation 3, assuming a rectangular specimen
cross-section:
(3)
Where σmáx is the flexural strength, Fmáx is vertically
applied maximum load in the center of the prism, L is the
distance between the supports, b is the width of the test specimen and h is the thickness of the test specimen.
2.5 Statistical analysis
The testing was repeated seven times. The data was submitted to an analysis of variance (ANOVA) of two ways and the average values were compared using the Turkey test,
using a level of significance of 5%. The data was presented
for its average and standard deviation using the software system Statistica® 9.1, that was licensed by Universidade
Federal de Santa Maria23.
3. Results and Discussion
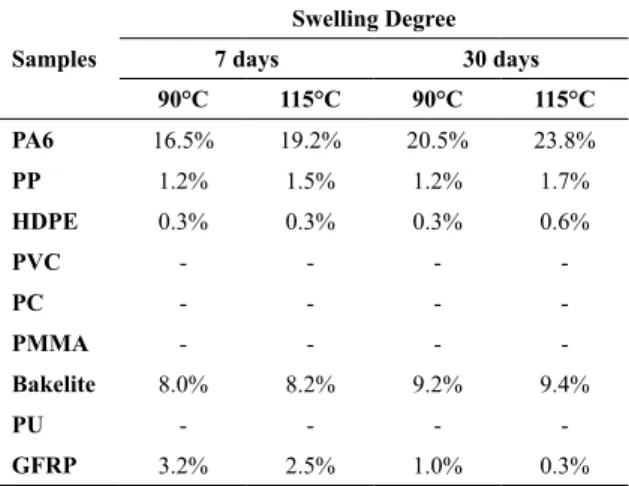
The swelling degree is observed by the chemical resistance test on the nine selected polymers, which indicates the
possible ethanol diffusion across the material structure24.
Table 1 shows that the materials with amorphous structure, as in PVC, PC and PMMA, were the ones that presented the worst performance, because the ethanol caused swelling in the samples, promoting the separation of the polymer chains and increasing the volume. Therefore, these materials were discarded at the end of the 7 days of testing. The nylon 6.0
samples presented high ethanol diffusibility in the material
structure, about 22%, while the bakelite thermoset presented
an Intermediate diffusion rate of about 9.0% for both
temperatures. The samples with better performance and
lower ethanol diffusibility values were the semicrystalline of
PP and HDPE, which presented a variation in the degree of swelling of about 1.5% e 0.5%, respectively. The unsaturated
polyester composite reinforced with fiberglass presented at
the end of 30 days of testing the decrease of swelling degree, what it is believed to be the loss of mass caused by the
possible removal of fiberglass or through the solubilization
of the polymer resin, however it was not damaged and did not deform the sample of the material tested.
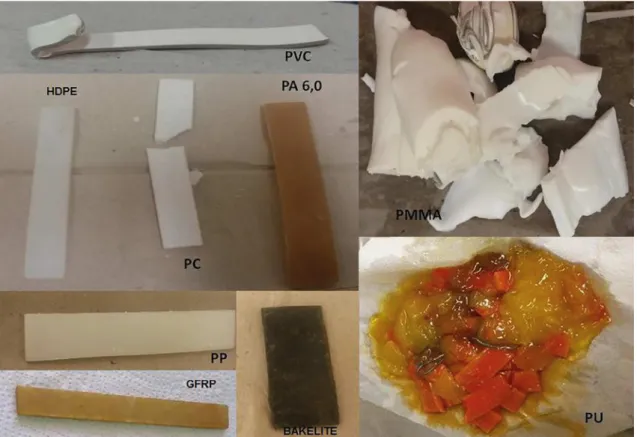
Figure 2 shows the visual aspect and the deformation occurred in some polymers tested after the chemical resistance testing in contact with ethanol.
.
.
b h
L F
2
3
max
max
2
$
v
l=
lTable 1. Swelling degree of the materials after the chemical resistance testing.
Samples
Swelling Degree 7 days 30 days 90°C 115°C 90°C 115°C
PA6 16.5% 19.2% 20.5% 23.8%
PP 1.2% 1.5% 1.2% 1.7%
HDPE 0.3% 0.3% 0.3% 0.6%
PVC - - -
-PC - - -
-PMMA - - -
-Bakelite 8.0% 8.2% 9.2% 9.4%
PU - - -
-GFRP 3.2% 2.5% 1.0% 0.3%
The Table 2 describes the materials weight variation (obtained through equation 1) for temperatures between
90 and 115°C, as well as for the periods of 7 and 30 days
of testing. Regarding the area variation values, the one that
showed more significant results was the material nylon 6.0, presenting a quite expressive extension, as well as a
high color change after the contact with ethanol (Figure 2). Another material that presented color change was the bakelite thermoset polymer.
The data obtained in Tables 1 and 2 allowed us to select the materials with better performance, being polypropylene, the high density polyethylene and the composite of polyester
resin reinforced with fiberglass. HDPE and PP are polyolefin that exhibit similar behavior, as can be observed in Table 3. However HDPE have a higher impact strength and excellent
chemical resistance but lower working temperature and tensile strength than PP.
A new chemical resistance test with ethyl alcohol was done, this time for the polymers with better performance. After the test, the weight variation of the PP, HDPE and GFRP materials was obtained, where each material had a group of seven samples, which improved the reliability of the results.
Figure 3 shows that the PP material at 90° C temperature, over the 30 days, had a diffusion of 1.4%, whereas for a temperature of 115°C the diffusion was of 2.5%. For the HDPE at 90°C, the material presented an increase of 2.9%, and 3.2% at 115°C. We concluded that the increased diffusion of ethanol in the material structure was influenced
Figure 2. Image of the tested materials after the chemical resistance test.
Table 2. Area variation for the materials after chemical resistance testing.
Samples
Área = b x h (m2)
Initial 7 days 30 days
90°C 115°C 90°C 115°C 90°C 115°C
PA 6 0.00134 0.00157 0.00154 0.00186 0.00160 0.00185
PP 0.00145 0.00151 0.00147 0.00154 0.00148 0.00154
HDPE 0.00154 0.00139 0.00154 0.00141 0.00156 0.00140
PVC 0.00143 0.00134 - - -
-PC 0.00144 0.00150 0.00135 - -
-PMMA 0.00147 0.00136 - - -
-Bakelite 0.00140 0.00138 0.00147 0.00146 0.00149 0.00146
GFRP 0.00142 0.00142 0.00141 0.00142 0.00142 0.00144
Tabela 3. Physical and chemical properties of HDPE and PP.
Property PP HDPE
Density (g/cm3) 0,905 0,959
Melting Point (°C) 175 135
Glass Transition (°C) -10 -100
Water Absortion (24 h) (%) Low 0.1 Low 0.01
Strong Acids Limited Resistance Limited Resistance
Weak Acids Resistant Resistant
Strong Alkalis Resistant Resistant
Weak Alkalis Resistant Resistant
U/V Resistance Some attack
> Discolours and embrittles
is adversely affected. For the GFRP, at 90°C temperature in the 7 days of testing, the material presented a diffusion of de 3.6%. However at the end of the 30 days the diffusion dropped to 1.1%, which happened to the 115°C temperature too, which in the 7 days of testing the diffusion was of
2.3% and in 30 days the material presented a mass loss of
-0.26%. Thus, it is believed that ethanol may be causing,
through the distancing of the polymer chains, the removal of
fiberglass or the solubilization of the polymer resin. It was
also observed a high variation degree of the set of samples through the standard deviation, that occurred due to the fact
that the fiberglass presented lack of homogeneity in total plate extension, causing this variation.
Figure 3. Variation of the materials swelling degree in different
moments of the testing.
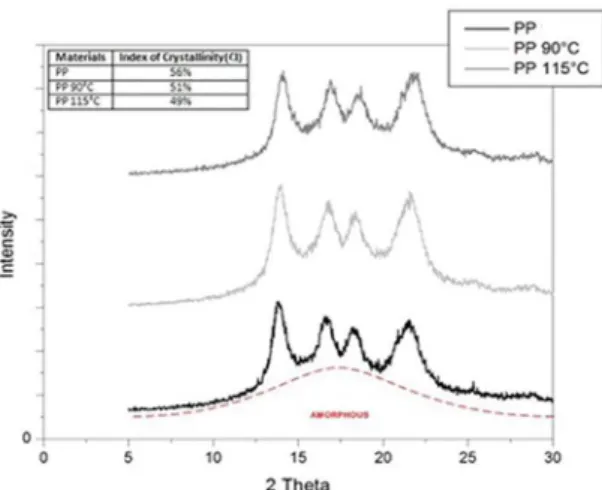
Figure 4. X ray spectrum for the polypropylene samples.
Figure 5. X-ray spectrum for the high density polyethylene samples. With the aim of observing possible structural changes
in the polymer chains, due to the ethanol diffusion on its
structure, the material was characterized by XRD and FTIR.
The pure PP presented diffraction peaks in 2θ: 13.84°, 16.63°, 18.25° and 21.49, that corresponds to the plan (110),
(040), (130) e (111) of the crystalline phase crystallite of
α of the PP. The values found were in agreement with the
ones reported in the literature25-27. It could be observed in
Figure 4 that the ethyl alcohol diffusion at 85% w/w, in both
temperatures, did not change the material structure, according
to the DRX analysis, there was not even a significant change in the range 20 by the diffusion occurred in its structure. However through the calculation of crystallinity index, it
can be observed that the presence of ethyl alcohol in the PP chains caused a little decrease in the CI of the materials after the contact with ethanol in relation to the pure material.
For the HDPE, the diffraction peaks in 2θ, are presented in: 21.55° e 23.89°, that correspond to the plans (110) e (200),
respectively, of an only phase with orthorhombic structure. The values obtained are also in agreement with the ones found in literature28,29. In relation to the HDPE, after the
contact with ethanol in 90°C and 115°C temperatures, as it is seen in the diffractogram of Figure 5, it did not present a
structural change, measured by this technique as there was
not a significant difference in the range 2θ by the diffusion
occurred in its structure. However, to determine the CI, we observed that the HDPE after the contact with ethanol, presented a little decrease of CI too, when compared to the pure HDPE.
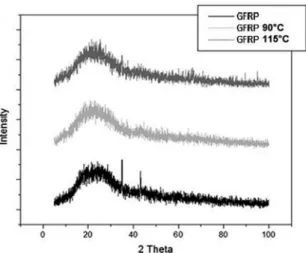
The GFRP in the x-ray diffraction peaks presented the
amorphous halo characteristic of a disorderly structure. However it presented in the pure material crystallization peaks
in the range of 2θ in 35.02º e 43.28°, which characterizes a possible superficial crystallization of the fiberglass observed
through the appearance of the peaks characteristic of the
fiberglass components30,31. Yet, the material after the contact
with ethanol, as it can be observed in Figure 6, did not present a large variation in the range of 2 thetas, it only lost the peaks
of superficial crystallization of the fiberglass. This way, it is believed that the ethanol diffusion in the empty spaces in the material chains promoted the fiberglass removal, which
in the literature by the authors MOHAMMADI et al., 2017,
HAMID; AKHBAR; HALIM, 2013, GONZALEZ-BENITO
et al., 201334-36. The bands are shown in 2920.9, 2855.1, 1469.7, 717.9 cm-1, where the vibration frequencies correspond
to the C-H alkyl group. One more time the material, after
the contact with alcohol, was quite satisfactory because it
did not expose any displacement of the functional groups
neither the appearance of the characteristic peaks of ethanol (Figure 7). Due to these facts, it is believed that ethanol may be evaporating from the structure of the materials, because
in all the samples tested a slight diffusion occurred, which
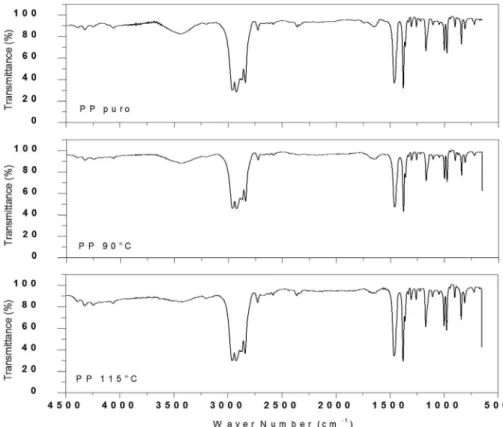
cannot be seen in the characterizations, both in the XRD and the FTIR for the PP and the HDPE, since the results for these materials are in agreement with the peaks of the pure materials, without contact with ethanol.
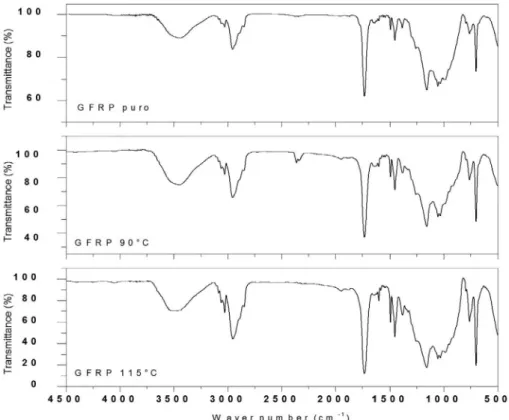
In the spectrum shown in Figure 10 for the GFRP, the
absorption associated with the O-H group in the band 3490
cm-1 and the C-H group in 2956.02 cm-1 can be identified on the material before and after the contact with ethanol in
90 and 115°C temperatures. Additionally, peaks in 1731.37
cm-1 are observed from C=O connections36-37. The bands 1451.4 cm-1 represent the CH2 and CH3 groups, respectively, and the bands around 1045 cm-1 correspond to the alcohol group38. The peak around 700 cm-1 represents the C-H group
of the aromatic ring present in the molecular structure of the polyester resin39.
The table 4 presents a compilation of all the results
obtained in the flexural testing, either for the pure materials
or for these after the contact with ethanol at à 85% w/w,
in both 90°C and 115°C temperatures. It is noted that the
values listed in the tables are an average obtained from seven samples of each polymer tested and the nine samples of the pure materials without the contact with ethanol.
The three-point flexural tests were concluded for the maximum deformation of 5% without the rupture having occurred before this deformation, except for the GFRP
that broke before the end of the testing. It is important to
highlight that the maximum flexural stress decreases after
the contact with ethanol, in all the cases. After analyzing the data with Statistica® 9.1 program, a significant difference
was observed in the flexural maximum stress value of the pure material, for the PP, considering the tests in 90°C and 115°C temperatures. However, it is not significant for PP at 90°C and at 115°C. When compared to the pure HDPE with the ones tested, it was noted a significant difference only in the HDPE after the contact with ethanol at 115°C, while for the HDPE 90°C the difference was not significant, not even when compared to the pure HDPE and to HDPE at 115ºC.
Although significant differences were observed in some
cases (p<0,05) they were just a few. Thus, through the results already obtained for the PP and HDPE polymers, it is stated that they present a good mechanical resistance of the polymers
even after slight ethanol diffusion, since this diffusion slightly
changed the crystalline structure of the materials. Figure 7. FTIR spectrum for the ethanol.
Figure 6. X -ray spectrum for the GFRP composite samples.
FTIR analysis was performed on ethanol, Figure 7, to
observe the existence of characteristic functional groups
of this solvent in the spectra obtained for the polymer materials studied.
The Figure 8 shows the comparison of FTIR spectrum for the pure polypropylene and after the contact with ethanol
in the 90 and 115°C temperatures. The bands identified for the PP among 3000 - 2700 cm-1 correspond to the grouping -CH-CH-, yet, the bands 1456.3 and 1377.1 cm-1, represent
the grouping of angular deformation CH2 and the symmetrical deformation CH3, respectively27,32,33. On the other hand, the
Figure 8. Infrared spectrum for pure PP, 90° PP and 115°C PP.
Table 4. Results of flexural strength for the materials studied.
Essay Flexural Maximum Stress (MPa) PP HDPE GFRP
Pure 46,1
a±
0,82
40,1a±
1,27 393,3
a± 34,8
90°C 41,0b±
1,09
39,1ab±
1,49 166,2
b± 15,59
115°C 41,91,21b± 37,12,39b± 142,0b± 17,52
Figure 10. Infrared spectrum for pure GFRP, 90° GFRP and 115° GFRP.
The GFRP presented a quite significant flexural maximum
stress drop, that is, the material in contact with ethanol
lost expressively its mechanical resistance, generating an
unsatisfactory result. However, when compared with the materials after the contact with ethanol, they do not present
a significant difference, as it can be seen in Table 4. The
incorporation of ethanol in this composite structure may
generate free spaces (empty) between the fiber and the polymer
resin resulting in porosity and weakening of the material,
which causes an expressive drop in the flexural resistance. Comparing the different materials under test, the one
that presented the least variation in mechanical resistance after the chemical resistance test, was the HDPE, because its standard deviation and Turkey test show that the decrease
is not significant in relation to the pure material.
4. Conclusions
The ethanol diffusion in the material structure, considering
the PP and HDPE, resulted in swelling degree values below 3.2% for both temperatures, which can be considered low when compared with the other materials tested in ethanol.
Yet, the fiberglass composite presented a mass loss at the end
of the 30 days of testing for both temperatures, which can be
explained with the occurrence of degradation of fiberglass, that was identified by XRD characterization. Regarding the
characterization of the other materials (PP and HDPE), they
did not present structural differences that could change the
analyzed properties after the contact with ethanol. Regarding the mechanical behavior of the PP and HDPE
materials in the flexural tests, these present an insignificant reduction of the maximum tensile stress in flexion compared
with the pure material values, suggests a good mechanical resistance of these materials, even after the slight ethanol
diffusion. The GFRP presented a quite expressive mechanical
resistance reduction, causing the material rupture during the testing. This result showed renders unviable the use of this composite as a material for construction of the distillation columns.
a polymeric material in the construction of the distillation columns, the tests show that the PP and HDPE materials are suitable for this purpose. However, it is necessary further
studies, exposing them to a continuous process of use
as construction materials of a distillation column for the production of bioethanol, in order to have a conclusive opinion
of which of these polymers would be more efficient for the
use in the construction of distillation columns in small scale.
5. Acknowledgments
The authors would like to thank CAPES for the financial
support.
6. References
1. Santos GR, org. Quarenta anos de etanol em larga escala no
Brasil: desafios, crises e perspectivas. [Internet]. Brasília: Ipea;
2016. Available from: <http://www.ipea.gov.br/portal/index.
php?option=com_content&view=article&id=27354>. Access in: 10/01/2017.
2. Taborda LW, Jahn SL, Lovato A, Evangelista MLS. Evaluation of the technical and economic feasibility of ethanol production in a pilot plant using sweet potatoes. Custos e @gronegócio on line. 2015;11(1):245-262.
3. Mayer FD, Feris LA, Marcilio NR, Hoffmann R. Why small-scale fuel ethanol production in Brazil does not take off? Renewable and Sustainable Energy Reviews. 2015;43:687-701.
4. Taqvi SA, Tufa LD, Muhadizir S. Optimization and Dynamics of Distillation Column Using Aspen Plus®. Procedia Engineering. 2016;148:978-984.
5. Gao X, Li X, Liu X, Li H, Yang Z, Zhang J. A novel potential application of SiC ceramic foam material to distillation: foam monolithic tray. Chemical Engineering Science. 2015;135:489-500.
6. Mohammad Mahdi M, Davood RZ, Mehdi A. Suitability of Using Brass Ferrules as Packing in a Glass Distillation Column and Presenting a New Relationship Between HETP and pressure drop. Iranian Journal of Chemistry and Chemical Engineering.
2007;26(2):9-17.
7. Soares RB, Pessoa FLP, Mendes MF. Dehydration of ethanol
with different salts in a packed distillation column. Process Safety and Environmental Protection. 2015;93:147-153.
8. Lévêque J, Rouzineau D, Prévost M, Meyer M. Hydrodynamic
and mass transfer efficiency of ceramic foam packing applied to
distillation. Chemical Engineering Science.
2009;64(11):2607-2616.
9. Salehi M, Salem A. Effect of moisture content on extrusion process of kaolinitic-illitic clay in manufacturing of ceramic
Raschig ring. Journal of Materials Processing Technology.
2008;200(1-3):232-237.
10. Muñoz AJ, Espínola F, Ruiz E. Removal of Pb(II) in a
packed-bed column by a Klebsiella sp. 3S1 biofilm supported on porous
ceramic Raschig rings. Journal of Industrial and Engineering Chemistry. 2016;40:118-127.
11. Azeem S, Zain-ul-Abdein M. Investigation of thermal conductivity enhancement in bakelite-graphite particulate filled polymeric
composite. International Journal of Engineering Science.
2012;52:30-40.
12. Wang C, Wang H, Liu Y, Huang L. Optimization of surface
treatment for flotation separation of polyvinyl chloride and
polyethylene terephthalate waste plastics using response surface methodology. Journal of Cleaner Production.
2016;139:866-872.
13. Candian LM, Dias AA. Estudo do polietileno de alta densidade reciclado para uso em elementos estruturais. Cadernos de Engenharia de Estruturas. 2009;11(51):1-16.
14. Rueda F, Torres JP, Machado M, Frontini PM, Otegui J. External
pressure induced buckling collapse of high density polyethylene (HDPE) liners: FEM modeling and predictions. Thin-Walled Structures. 2015;96:56-63.
15. Torres AAU, D'Almeida JRM, Habas JP. Evaluation of the effect
caused by a paraphinic oil on the physicochemical behavior of
high-density polyethylene pipes. Polímeros.
2010;20(5):331-338.
16. Toscano A, Pitarresi G, Scafidi M, Di Filippo M, Spadaro G, Alessi S. Water diffusion and swelling stresses in highly crosslinked epoxy matrices. Polymer Degradation and Stability.
2016;133:255-263.
17. Randová A, Bartovská L, Hovorka Š, Bartovský T, Izák P, Kárászová M, et al. New approach for description of sorption and swelling phenomena in liquid + polymer membrane systems. Separation and Purification Technology. 2017;179:475-485.
18. ASTM International. ASTM D 543-06 - Standard Practices for Evaluating the Resistance of Plastics to Chemical Reagents. West Conshohocken: ASTM International; 2006.
19. Mayer FD, Brondani M, Aita BC, Hoffmann R, Lora EES.
Environmental and Energy Assessment of Small Scale Ethanol Fuel Production. Energy & Fuels. 2015;29(10):6704-6716.
20. Washington MA, Swiner DJ, Bell KR, Fedorchak MV, Little SR, Meyer T. The impact of monomer sequence and stereochemistry
on the swelling and erosion of biodegradable poly
(lactic-co-glycolic acid) matrices. Biomaterials. 2017;117:66-76.
21. Rambo MKD, Ferreira MMC. Determination of Cellulose Crystallinity of Banana Residues Using Near Infrared Spectroscopy and Multivariate Analysis. Journal of the Brazilian Chemical Society. 2015;26(7):1491-1499.
22. ASTM International. ASTM D 790-02 - Standard Test Methods for Flexural Properties of Unreinforced and Reinforced Plastics and Electrical Insulating Materials. West Conshohocken: ASTM International; 2002.
23. Statsoft Inc. STATISTICA for Windows (data analysis software system), version 9.1. Licensed by the Federal University of Santa Maria; 2009. Available from: <http://www.statsoft.com>. Access in: 10/01/2017.
24. Li GY, Koenig JL. FTIR Mapping: Polymer Swelling and Solvent
Segregation in Benzene/Cyclohexane-Polyisoprene Rubber
25. Luo G, Li W, Liang W, Liu G, Ma Y, Niu Y, et al. Coupling
effects of glass fiber treatment and matrix modification on
the interfacial microstructures and the enhanced mechanical
properties of glass fiber/polypropylene composites. Composites Part B: Engineering. 2017;111:190-199.
26. Líbano EVDG, Visconte LLY, Pacheco EBAV. Propriedades térmicas de compósitos de polipropileno e bentonita organofílica.
Polímeros. 2012;22(5):430-435.
27. Oliveira TA, Oliveira RR, Barbosa R, Azevedo JB, Alves
TS. Effect of reprocessing cycles on the degradation of PP/ PBAT-Thermoplastic starch blends. Carbohydrate Polymers.
2017;168:52-60.
28. Rajeshwari P, Dey TK. Novel HDPE nanocomposites containing
aluminum nitride (nano) particles: Micro-structural and
nano-mechanical properties correlation. Materials Chemistry and Physics. 2017;190:175-186.
29. Liu H, Liu J, Zhou Q, Wang J. Novel polymer electrolyte based
on PVDF/HDPE blending for lithium-ion battery. Materials Letters. 2013;99:164-167.
30. López FA, Martín MI, Alguacil FJ, Rincón JM, Centeno TA,
Romero M. Thermolysis of fibreglass polyester composite and reutilisation of the glass fibre residue to obtain a
glass-ceramic material. Journal of Analytical and Applied Pyrolysis.
2012;93:104-112.
31. Martín MI, López FA, Alguacil FJ, Romero M. Development
of crystalline phases in sintered glass-ceramics from residual E-glass fibres. Ceramics International. 2014;40(2):2769-2776.
32. Mandal DK, Bhunia H, Bajpai PK, Kushwaha JP, Chaudhari CV, Dubey KA, et al. Optimization of acrylic acid grafting
onto polypropylene using response surface methodology and its biodegradability. Radiation Physics and Chemistry.
2017;132:71-81.
33. Longo C, Savaris M, Zeni M, Brandalise RN, Grisa AMC. Degradation study of polypropylene (PP) and bioriented polypropylene (BOPP) in the environment. Materials Research.
2011;14(4):442-448.
34. Mohammadi M, Ziaie F, Majdabadi A, Akhavan A, Shafaei M. Improvement of mechanical and thermal properties of high
energy electron beam irradiated HDPE/hydroxyapatite
nano-composite. Radiation Physics and Chemistry. 2017;130:229-235.
35. Hamid F, Akhbar S, Halim KHK. Mechanical and Thermal
Properties of Polyamide 6/HDPE-g-MAH/High Density
Polyethylene. Procedia Engineering. 2013;68:418-424.
36. Gonzalez-Benito J, Martinez-Tarifa J, Sepúlveda-García ME, Portillo RA, Gonzalez-Gaitano G. Composites based on HDPE filled with BaTiO3 submicrometric particles. Morphology, structure
and dielectric properties. Polymer Testing.
2013;32(8):1342-1349.
37. Sanchez EMS, Cavani CS, Leal CV, Sanchez CG. Compósito
de resina de poliéster insaturado com bagaço de cana-de-açúcar: influência do tratamento das fibras nas propriedades. Polímeros.
2010;20(3):194-200.
38. Arrieta JS, Richaud E, Fayolle B, Nizeyimana F. Thermal
oxidation of vinyl ester and unsaturated polyester resins.
Polymer Degradation and Stability. 2016;129:142-155.
39. Ikladious NE, Asaad JN, Emira HS, Mansour SH. Alkyd resins based on hyperbranched polyesters and PET waste for coating applications. Progress in Organic Coatings. 2017;102(Pt