EF
A
T
OP PRIORITY FOR INTEGRA
TED SECT
OR-WIDE POLICIES
Education
f o r A l l
I N A F R I C A
Livros Grátis
http://www.livrosgratis.com.br
Nota Bene:
The ideas and opinions expressed in this document are those of the authors and do not necessarily reflect the views of UNESCO.
The terms used in this publication and the data presented do not imply that UNESCO has adopted any particular position with respect to the legal status of the countries, territories, towns or areas, their governing bodies or their borders or boundaries.
The authors:
This report has been drawn up by the Pôle de Dakar education sector analysis team within the Regional Office for Education in Africa (BREDA), with contributions from BREDA education specialists and the UIS regional centre, under the responsibility of Dr Lalla Aïcha Ben Barka, Director of BREDA. The Pôle de Dakar for education sector analysis (www.poledakar.org) is a platform of expertise reporting to BREDA. Resulting from a partnership between the French Ministry of Foreign Affairs and UNESCO, the Pôle de Dakar has been working to support countries and technical and financial partners in the areas of education system analysis, development of strategies and monitoring of education sector policies since 2001.
The Pôle de Dakar for education sector analysis team comprised:
Mr Jean-Pierre JAROUSSE, Coordinator
Mr Jean-Marc BERNARD, Advisor in support to countries, Mr Kokou AMELEWONOU, Education policy analyst Mr Borel Anicet FOKO TAGNE, Education policy analyst Ms Claire GALL, Education policy analyst
Mr Guillaume HUSSON, Education policy analyst Mr André Francis NDEM, Education policy analyst Ms Laure PASQUIER-DOUMER, Education policy analyst Mr Nicolas REUGE, Education policy analyst
The BREDA team contributing to this report comprised:
Mr Teeluck BHUWANEE, Programme specialist Mr Aimé DAMIBA, Consultant
Ms Rokhaya FALL DIAWARA, Programme specialist Mr Magatte FAYE, Programme assistant
Mr Jacques GUIDON, Advisor to the Director Mr Hervé HUOT-MARCHAND, Sector expert Ms Fatoumata MAREGA, Programme specialist Mr Luc RUKINGAMA, Programme specialist Ms Virginie TORRENS, Sector expert Mr Patrick WATKINS, Consultant
The UIS regional centre:
Mr Thierry Lairez, Regional advisor
UNESCO/BREDA publication number:ISBN. 978-92-9091-095-4
Photography:
© Mario Bels - www.bels-mario.com © By Reg’ - [email protected]
Graphic design: Mr Régis L'Hostis, Dakar
Printing:La Rochette, Dakar
Translation French › English:Ms Marjorie Leach, Montpellier
Proofreading - French:Mr Fréderic Duchesne, Paris
Introduction
M
arking one third of the time span set in Dakar in the year 2000 for reachingUniversal Primary Education (UPE), this report, based on the most recent data available (2004/05 and more rarely 2005/06), establishes a fairly precise assessment of the trends observed in Africa and endeavours to identify the successes and failures, in order to learn useful lessons.
The Dakar Forum has undeniably changed the deal for the development of education. The changes are manifest at institutional level, first of all, and are related to government and donor commitment: in many countries, local donor groups have set up a trusting dialogue with the governments, making it possible to move towards the globalization of actions and to cover current expenditure. Secondly, much has been accomplished in terms of real progress towards the set goals. The march towards UPE has become a reality in Africa, even if, for many countries, this may not be achieved by 2015. This goes, hand in hand, with a reduction in gender inequalities in primary education and, to a lesser extent, a reduction in geographical disparities.
The assessment set out in this report is not limited to the significant changes registered in the accomplishments and mechanisms of cooperation. It also concerns the consequences of the general trend in scaling up enrolments. It attempts to answer interrogations on the evolution of the quality of learning and on the place of non-formal education and specific literacy programmes in this general trend; and finally it looks at the concerns that may arise from the rapid development of post-primary education. Beyond the mechanical effect connected to the development of primary education, there is clearly a rise in demand for education in secondary and tertiary education. The issue of the physical and financial sustainability of the development of post-primary education is raised, just like that of its economic and social sustainability. The said growth in post-primary education must rapidly lead to more explicit provision for same in the definition and evolution of “credible” education system development plans, which so far have focused mainly on securing financing for the expansion of primary education.
These plans are not to be based on a single model; this would be totally unfounded in view of the variety of country situations, both in terms of structure and enrolment dynamics, as well as of economic situations and financing modalities. They must firstly be guided by the systematic promotion of the interests of society. They do not necessarily call for common solutions due to the variety of possible modes of organization and financing, but for solutions that take the constraints mentioned earlier into account. Bearing this in mind, the report suggests some « benchmarks for action ». These concern priorities, the agenda, financing modalities and technical and institutional tools, which must be defined in order to embark upon the reforms. Thus, the debate is open and must necessarily be enlarged to take in many other dimensions; UNESCO Regional Office for Education in Africa (UNESCO-BREDA) intends to be an active participant.
DKR+7
Education
f o r A l l
I N A F R I C A
1
DAKAR +7
E D U C A T I O N F O R A L L
IN AFRICA
C
H
A
P
T
E
R
1
EDUCA
TION FOR ALL
IN AFRICA
CHAPTER 1
Institutional changes following
the Dakar Forum
1. Mechanisms for the promotion and
monitoring of Education for All at
international, regional and national levels
In order to generate strong political commitment at all levels in favour of education, the Dakar Forum (2000), drawing on experience from the Jomtien Conference, highlighted the necessity for setting up appropriate mechanisms to achieve the EFA goals. The Dakar Framework for Action has thus introduced several mechanisms for monitoring EFA at international level, organized around different aspects : political with the High-Level Group, technical with the EFA Working Group, and analytical with the EFA Global Monitoring Report. Civil society also has an important role to play, in vigilance and advocacy, especially with the Global campaign for EFA.
At African regional level, UNESCO's Regional Office for Education in Africa (BREDA) has worked towards setting up an EFA Regional Forum in sub-Saharan Africa, drawing inspiration from the EFA Working Group at international level. This mechanism comes in addition to, and ties in with, the African regional authorities on consultation, exchange and cooperation in terms of education, i.e. the Conference of African Ministers of Education (COMEDAF) under the aegis of the African Union and the Association for the Development of Education in Africa (ADEA), consolidated by two decades of education in Africa (1997-2006 and 2006-2015) launched by the African Union. The Africa Network Campaign on Education for All (ANCEFA) reinforces the mobilization for education in Africa, by acting as a spokesperson with the international community on behalf of the African national and local associations and by providing them with logistic support.
EDUCA
TION FOR ALL
IN AFRICA
CHAPTER 1
2. Definition in many countries of a global
framework for the development
of the education sector
In order to reach the goals set by the different countries for the development of their education sector, the need became clear in the 1990's to move towards a more global framework for action for the different stakeholders in the education sector; the aim being to avoid past mistakes (external support on the periphery of the national strategy with very high transaction costs, resources-oriented running of the system with no medium or long-term strategic vision, lack of intersectoral dialogue, absence of appropriate budgeting, etc.). The desire, by both the governments and their partners, to see these practices change and shift towards a more global framework of development of the education sector arose from these admissions.
The framework is founded on in-depth and shared diagnosis of the functioning of the sector conducted by 26 African countries since 2000. This diagnosis, or sector-wide analysis, makes it possible to devise, set up and redirect education sector programmes allowing for the socioeconomic and financial constraints of the sector and the countries' human development goals. By highlighting the impact of education on society and the economy, the coherence of strategic choices with the objectives set and the way in which resources are transformed into results, sector diagnosis also facilitates financial mobilization: at national level, because it serves as advocacy for education in national budget trade-offs and also at the level of the international community, because it provides arguments as to the « credibility » of the sector.
The cornerstone of a more global framework certainly lies in the generalisation of medium or long term sector-wide plans in Africa.These are the outcome of a national process based on policy choices, which define a coherent set of interdependent strategies, activities and investments with a view to reaching a set of national goals, in the framework of a precise time-frame. They enable all the actions in favour of the education system to be registered in a common framework whatever the nature of the expenditure, the source of financing or the financial channel is. They then situate the strategies in a long-term perspective, thus ensuring continuity in the development of the sector. Finally, they contribute to encouraging mutual efforts and focusing dialogue around and on the national sector-wide policy and urge technical and financial partners (TFPs) to comply with national goals, positioning the ministry of education or the government as sector leader.
Carrying out and monitoring the sector-wide plans are then facilitated by a new type of dialogue between governments, TFPs and civil society, which is usually formalized by a partnership framework document and joint monitoring reviews. The overall framework for development of the education sector is then reinforced by incorporating education expenditure in global budget programming through the medium-term expenditure frameworks. Finally, it becomes all the more legitimate through the assertive and better-coordinated presence of civil society.
1 Amounts expressed in 2005 US dollars.
2 In 2005, aid to Asia exceeded that to Africa, due to very high aid flow to the Middle East.
3 There is quite a difference between these figures and those presented in the 2007 EFA Global Monitoring Report, where the share for education rose from 10% to
3. High international financial mobilization
The year 2000 marked a change in the international community's financial support to developing countries. Following an almost continuous decline in the 1990's, Official Development Assistance (ODA) underwent a sharp increase starting in 2000 (+69% in 5
years), rising from 63.3 billion US dollars in 2000 to 107.3 billion US dollars in 20051.
Significant priority given to Africa but for how long?
Africa, and more specifically sub-Saharan Africa, still has high priority in aid flows: aid towards Africa represents around one third of total aid, making Africa the leading
beneficiary2 until 2005. However, the share of Official Development Assistance for
Africa has fallen since 2003:it represented 38% of ODA then, compared to 37% in 2004 and 33% in 2005. Even if many promises have been made by donor agencies for a more favourable geographical distribution for Africa, the share of development aid for Africa in 2005 was far from what it was in the early 1990's (44%).
Very strong international mobilization for education after the Dakar Forum but now showing a loss of impetus
While the Jomtien Conference in 1990 did not enable the mobilization of donor agencies in favour of education, the Dakar Forum in 2000, due to the strong financial commitment made by the different countries, had immediate and very extensive consequences: aid to education rose from 1.6 billion US dollars in 2000 to 6.4 billion US dollars in 2005 and the share of aid reserved for education more than doubled over the period 2000-2004, increasing from 3%
to 7%3. The strong financial mobilization for education was also observed in Africa: the share
for the education sector in global aid thus increased from 3% in 2000 to 8% in 2004.
However, in 2005, this share was cut back to 7%. The drop was even greater for
sub-Saharan Africa since the share fell from 7% in 2004 to 5% in 2005 for the education sector. This new trend raises concern as it suggests a slowdown in the priority granted to education and in the mobilizing effect of the Dakar Forum.
The distribution of ODA for education hardly takes into account EFA goal n°2 Although not perfectly defined, the distribution in ODA disbursements for education in sub-Saharan Africa can give rise to some questions, insofar as there appears to be a dwindling interest for secondary education and very little priority for primary education, which is competing directly with tertiary education in the ODA allocation. Moreover, the share of aid for education devoted to basic education does not take into account the distance separating African countries from Universal Primary Education: in countries furthest from UPE (completion rate of under 50%), their aid for education is not directed with greater priority to primary education than in countries at an intermediate distance from UPE (completion rate of between 50 and 75%).
National priorities more and more in favour of education
4 Any low-income country can be elected to the Fast Track Initiative by the donors if it has a complete Poverty Reduction Strategy Paper recognized by the World Bank and the IMF, and an education sector development plan deemed credible by the technical and financial partners' local coordination, in accordance with the Initiative's Indicative Framework.
5 Totals for 2006 do not take into account disbursements made by donors between November and December 2006.
EDUCA
TION FOR ALL
IN AFRICA
CHAPTER 1
The Fast Track Initiative's multi-donor funds for education have greatly contributed to the high mobilization for education in Africa…
The Fast Track Initiative (FTI) is in line with the continuity of the Monterrey consensus, in the rationale of effectiveness of aid and of incentives: incentives for the beneficiary countries to
set up a credible development policy for the education sector4and incentives for donors to
increase aid for education and the predictability of same. It has moreover greatly contributed to the transition from the project approach to the programme approach, by encouraging local donors to coordinate around the education sector programme of those countries elected to the Initiative. Since its creation in 2002, the FTI's role in the development of education sectors, especially in African countries, has become more and more important: seven countries were elected at the origin of the Initiative and there are 31 today, including 20 African countries. The Initiative's multi-donor funds - Catalytic Fund and Education Programme Development Fund (EPDF) - have played an important role in this evolution.
The Catalytic Fund, created in 2003, to enable low-income countries, which are donor «orphans» and have a credible education sector development programme, to benefit from transitional financing, in order to allow them due time to show performance liable to attract new donors, has become more and more important: at the time it represented 49.1 million
US dollars compared to more than the double in 2006 (101.8 million US dollars5). Amongst
the Catalytic Fund's beneficiaries, African countries predominate in their numbers and also in the amounts disbursed to them:they received two-thirds of the total amount disbursed to the Catalytic Fund's beneficiary countries between 2003 and 2006, i.e. 72
million US dollars. Africa is also the main beneficiary of the EPDF fund.This fund, set
up in November 2004, was designed, first of all, to support low-income countries in the development or revision of sustainable education sector programmes aimed at achieving quality Universal Primary Education. Africa has been allocated 12.9 million US dollars by this fund, i.e. 53% of the fund. However, a very small share (10%) of this sum has been committed and an even smaller share spent: only 6% of the EPDF fund allocated to Africa has actually been used.
35 30 25 20 15 10 5 0 Con g o (99/04) Cam er
oon (98/04) CAR (99/04) Mali (97/03)
Benin (97/04)
Burkin
a Faso (97/02)
M
ozambique (97/02) Mad
agascar (97/04) Côte d'I voir e (98/00) Lesoth o (99/03) K en ya (98/05) M auritani a (97/04) Gambi a (99/05) Burun di (97/05) Tog o (98/05) Si err a Leon e (98/03)
Value of the Fast Track indicative framework
% o
f ed
u
cati
on in publi
c e
xpen
ditur
e
1998 or closest year 2004 or closest year
Graph 1.A: Share of current expenditure on education in State expenditure excluding donations
… but the scale of FTI raises questions as to its capacity to address the goals
With the extension in the time span during which the different countries can benefit from
the Catalytic Fund6, the considerable development in the number of countries elected to the
Fast Track Initiative7, and with the promises from donors for the Catalytic Fund dwindling in
the coming years, the question of the future sustainability of the Catalytic Fund is a critical issue. Will the Fund be in a position to address the needs of all those countries for which the Fast Track Initiative has undertaken to provide financial support, particularly once countries with a very large school population will have joined the Initiative? The answer is yes on condition of substantial donor mobilization, which does not seem to be the current trend. If the Catalytic Fund's resources turn out to be insufficient, trade-offs will have to be made, either on the number of countries admitted to benefit from the Fund, or on the total amounts given to each country. In any case, it is important to decide upon trade-off criteria that would be favourable to those countries furthest from UPE, especially fragile States, and provide them with sufficient means to register true progress in terms of enrolments by 2015.
Financing EFA until 2015 does not seem sure at the present time
While the aid reallocations in favour of Africa and education have not been up to
expectations, the estimation of needs in external financing for Education for All by
2015 has been revised upwards.The latest estimations, concerning more specifically the achievement of UPE, ranged in 2005 from 5 to 7 billion US dollars per year, and around 3
billion for Africa (UNESCO BREDA 2005)8. However, these estimations are based on annual
needs between 2000 and 2015. And external aid disbursements between 2000 and 2005 have been significantly below the level of the needs estimated for achieving UPE by 2015. It is therefore a question of filling the gap, which would bring the total annual needs for this
period to 11 billion US dollars per year (UNESCO 2007)9, i.e. almost twice the total aid
observed in 2005.
Donors, especially bilateral ones, must work twice as hard as to the intensity and predictability of their financial support for the education sector in Africa, giving priority to those countries furthest away from reaching Universal Primary Education. On their side, the African countries must pursue their efforts for placing education at the centre of the debate, within the government and also with external partners and civil society.
6 At the start, the Fund enabled the countries to benefit from financing for a period of 3 years. Implementing this fund has brought to light the problems which could arise from its transitional nature and admission criteria. It was not easy to make take over by new donors happen and to foresee any change in this respect, in view of the tendency for bilateral cooperation to reduce the number of countries where it intervenes: it was therefore decided in November 2006 to allow financing in the longer term.
7 About fifteen countries should join FTI before the end of 2007; most of them are potential candidates for the Catalytic Fund.
8 UNESCO BREDA, 2005, Dakar+5 : Education for All in Africa : Paving the way for action, UNESCO, Dakar.
2
DAKAR +7
E D U C A T I O N F O R A L L
IN AFRICA
C
H
A
P
T
E
R
2
The evolution of primary
education
Seven years on from the Dakar Forum and the mobilization that
ensued at country level and with the international community, it is
now possible to establish a true quantitative assessment. It is obvious
that these major events have reinforced the upward trend in
education indicators in most African countries. Whether in terms of
primary intake, coverage or completion, progress over the 2000-2005
period corresponds on average to that registered between 1990 and
2000, i.e. a period which was twice as long. This leads to reviewing
earlier projections as to the perspectives of achieving Universal
Primary Education: although they are more optimistic than two years
ago, they are not sufficient for guaranteeing UPE by 2015 in all
African countries.
EDUCA
TION FOR ALL
IN AFRICA
10 When, instead of the simple average, the weighted GER average is taken into consideration for each country per the total school-age population, these values are 95% in 2004/05 compared to 73 % in 1990/91.
11 It is indeed calculated on new entrants to the last year of primary education, which implicitly supposes that there is zero loss during the last year.
1. 1.Education indicators in primary
education on a distinct upward trend
since 1990
All education indicators show very clear improvement since 1990. Significant progress has been made in terms of intake capacity in primary education, measured by the evolution of the gross enrolment rate (GER): on average, the GER registered at 98% in 2004/05 compared to 78% in
199010. On the one hand, five countries still have coverage levels lower than 70%; Niger and
Djibouti, with a GER of 47% and 40% respectively, are the countries with the lowest coverage. On the other hand, 25 countries showed a GER exceeding 100% in 2004/05 and 6 more a GER of between 90 and 100%.
Evolution in the apparent (gross) intake rate (AIR) and the rate of access to the last year of primary education (PCR), which gives an approximate measure of primary education
completion11, is just as remarkable: these rates rose from 85% to 95% and from 48% to 65%
respectively between 1990 and 2005. While in all the countries taken into account, only one out
of two pupils completed primary education at the beginning of the period, this has risen to two out of three today.In 2005, only Niger is still very much behind with a PCR of 28% and thirteen more countries still have a low completion rate at the present time, below 50%. These average trends do however conceal a variety of situations and it should be noted that in 2005 four countries have a lower completion level than in 1990: Burundi, Namibia, Zambia and Zimbabwe. Finally, nine countries, mainly from Northern Africa and Southern Africa, already show a completion level of over 90% and can therefore be considered as being close to UPE. It is interesting to note that on a parallel with this progress, repetition is, in general, on the decrease since 1990/91.
Djibouti
Ni
g
er
Burkin
a Faso Sud
an Erit re a Côte d'I voir e M ali CAR Ethi opi a Guin ea Sen egal Gambi a Chad Burun di Com or os M auritani a Ghan a Benin Zimbabwe N amibi a Ni g eri a Seych elles M auritius Equ atori al Guin ea Egypt Botswan a To g o South Afri ca M ozambique M or occo Swazilan d Cape V er d e Tunisi a M alawi Alg eri a T U.R. o f anzani a Con g o Zambi a Ke ny a Cam er oon Rwan d a Ugan d a Gabon Lesoth o Sao T om e an d Prin cipe M ad agascar Si err a Leon e 140% 120% 100% 80% 60% 40% 20% 0%
GER AIR PCR
Graph 2.A: Gross enrolment rate, apparent (gross) intake rate and primary completion rate, 2004/05 (or closest year)
12 For a given period, the average annual increase in percentage points is calculated as follows: (AIR at end of period - AIR at beginning of period) / Period.
EDUCA
TION FOR ALL
IN AFRICA
CHAPTER 2
A number of countries remain far from the gender parity goal, both in terms of intake and
completion. For the 41 countries where data is available, there are only 92 girls for every
100 boys getting access to school.This drops to under 90 in 14 African countries: in Niger, Chad and Central African Republic (CAR), there are less than 80 girls for 100 boys. Fewer in
numbers on entering primary school, girls also have lower survival: in the last grade, there
are 88 girls on average for 100 boys.Chad and CAR have the lowest parity indexes, with 51 and 64 girls for 100 boys respectively. In contrast, there are between seven and nine countries where more girls than boys enter and complete primary education.
2. The Dakar Forum in 2000 marked
a turning point in the dynamics
of primary education in Africa
In 2000, the international community renewed its commitments to UPE and, since that date, it seems clear that there has been a positive evolution. By comparing the two sub-periods 1990-2000 and 2000-2004 (which correspond to 1990/91-2000/01 and 2000/01-2004/05 school years), a turning point in the rate of expansion of the education systems is observed, with progress stepped up in the period following the commitments made at these summits.
Concerning enrolment, for the period following 2000, twenty-five countries
experienced a higher annual rate of increase in pupil numbers than between 1990 and 2000, while, on the recent period, 12 countries show a slowdown in the rate of growth. The opposite trend can be observed for some countries, starting in 2000: further to expansion which had led them to over 100% of GER in 2000, they have experienced a decrease, rather than a slowdown, in enrolments: this is the case for Algeria, Botswana, Cape Verde and Equatorial Guinea.
For intake, the annual increase in terms of percentage points on the apparent (gross) intake
rate has been compared for the two sub-periods12. The majority of African countries have
demonstrated a sustained increase in apparent (gross) intake rate, with higher average annual increases between 2000 and 2005 than between 1990 and 2000, except for the countries that had already reached universal access in 1990.
As for completion (see graph 2.B), the same phenomenon can be observed for most
countries, since the year 2000. On the one hand, the group of countries with a very
Graph 2.B: Average annual increase in PCR: 1990-2000 and 2000-2004, Africa region M ozambique Ethi opi a Ni g er Djibouti Chad Benin Guin ea Eritr ea Ma li M alawi 8 6 4 2 0 -2 -4 -6
PCR < 30% in 1990/91
PCR between 30% and 50% in 1990/91
PCR between 50% and 80% in 1990/91
PCR > 80% in 1990/91
Average annual growth between 1990 and 2000 Average annual growth between 2000 and 2004
Burun
di
Burkin
a Faso Rwan
d a Côte d'I voir e Sen egal CAR Ma da g as ca r Equ atori al Guin ea U.R. o f T anzani a Su d an Com o ro s Mo ro cc o M auritani a Gambi a Ugan d a To g o Sao T o m e an d Prin cipe Co ngo Gabon Swazilan d Ghan a Cam er o on Lesoth o N ige ria Alg eri a Tunisi a Ke ny a Cape V er d e Za m b ia
Zimbabwe Mauritius
Egypt South Afri ca N amibi a Botswan a
13 The data used concerns 2002/03, or closest school year.
EDUCA
TION FOR ALL
IN AFRICA
CHAPTER 2
3. Looking back at the projections regarding
the perspectives of reaching universal
education by 2015
The Dakar + 7 report provides the opportunity of looking back at the projections made in the Dakar + 5 report for primary completion on the horizon of 2015, and which it is appropriate
to update in the light of the latest school statistics13. Anticipated trends are generally
better than in the previous report, but they are still far from the goal of UPE. Moreover, it can be seen that trends vary greatly depending upon the country (graph 2.C).
M alawi Com or os Erit rea Ghan a To g o Zimbabwe M or occo Djibouti Su d an Benin Con g o M auritani a Côte d'I voir e Gambi a Swazilan d U.R. o f T anzani a Lesoth o N amibi a Cape V er d e Ni g er CAR Burkin
a Faso Chad
Burun di Ethi opi a M ozambique M ali Sen egal M ad agascar Guin ea Cam er oon
Gabon Nigeri
a Sao T om e an d Prin cipe Zambi a Botswan a Ke ny a Alg eri a Egypt M auritius Tunisi a South Afri ca Seych elles 1,00 0,75 0,50 0,25 0
PCR in 2004/05 PCR in 2014/15
Dakar+5 estimates for 2014/15
Graph 2.C: Primary completion rate on the 2014/15 horizon, revised estimates
Source: Authors' calculations based on sector analysis and UIS data
A fall in completion rate is expected in seven countries, seeming to lead them away from the goal of UPE by 2015, even if for Eritrea and Morocco, this trend is more a question of stagnation than of decline.
Very little evolution (less than five percentage points by 2015) is expected for four countries, with the situation therefore virtually stagnating in the meantime. This is cause for concern insofar as all the countries in this group have a completion level of under 75% at present.
Eight countries should register an increase of between 5 and 15 percentage points; this is however insufficient for the countries in the group overall to reach the Dakar goal by 2015. The current scenario is more optimistic for all countries in the group, with the exception of Cape Verde and the United Republic of Tanzania, which have experienced a large drop in their apparent (gross) intake rates (AIR) in recent years.
Zambia, Cameroon and Madagascar, where the scenarios are more optimistic than in the earlier report. It can be noted that while trends in countries such as Niger, CAR, Chad or Burkina Faso will probably not allow them to be on time for the Dakar goal, the pace of their evolution should enable them by then to multiply their current primary completion level by two, which obviously represents considerable progress.
3
DAKAR +7
E D U C A T I O N F O R A L L
IN AFRICA
C
H
A
P
T
E
R
3
Post-primary levels and
enrolment dynamics
14
The vast progress made in primary access and above all in primary
completion leads to wonder about the expansion of post-primary
levels. What is the status on the development of these levels, and
more particularly is there ever-increasing pressure to enter secondary
education? The idea is therefore to draw up a panorama of
post-primary secondary education in Africa and then to study the
enrolment dynamics at work.
EDUCA
TION FOR ALL
IN AFRICA
CHAPTER 3
1. Current status: many different situations
throughout the continent
General secondary: from very marginal access to almost universal access
Average gross enrolment rates in Africa registered at 49% for lower and 24% for upper general
secondary in 2004/05. Access rates are very similar : one out of two children on average
has access to lower secondary education and more than one out of three completes that level, whilst one out of four children has access to upper secondary education. Nevertheless, this situation conceals very significant disparities, since some countries have very marginal secondary access (below 20%) and others have virtually universal access (over 80%): the access rates for the 39 countries for which data is available range from 17% to 92%.
CAR Burun di Ni g er U.R. o f T anzani a Burkin a Faso M ozambique Chad Ugan d a M auritani a Côte d'I voir e Sen egal Djibouti M ad agascar Benin M ali Cam er oon Ni g eri a Guin ea Com o ro s Zambi a Si err a Leon e Erit rea Su d an Lesoth o Sao T om e an d Prin cipe Con g o Swazilan d To g o Gambi a M or occo Ghan a N amibi a M auritius Cape V er d e Alg eri a South Afri ca Egypt Botswan a Tunisi a 0% 10% 20% 30% 40% 50% 60% 70% 80% 90% 100%
Graph 3.A: Access rate to general secondary (lower) in 2004/05
Source: Authors' calculations based on sector analysis and UIS data
Since 2000, with the exception of the eight countries with a high access rate (over 70%) at that date, the access rate to lower secondary education has increased by around 10 points in all the countries, whatever the departure point. This represents a rapid increase, perhaps voluntary, perhaps not, and which can therefore be questioned as to sustainability in the short and medium term.
15 And of some countries where the share of girls was and is still over 50%.
EDUCA
TION FOR ALL
IN AFRICA
CHAPTER 3
Egypt). TVET coverage results from a policy choice to give more or less importance to this secondary education sub-sector. The share of technical and vocational pupils varies widely, reflecting very different priorities granted to this type of education: while not exceeding 2% in ten countries (Comoros, Sao Tome and Principe, Kenya, Eritrea, Sudan, Senegal, Ghana, Guinea, Zambia and Namibia), this share is over 30% in Egypt, Cameroon and Rwanda, where it reaches 36%.
Tertiary education
In recent years, tertiary education in Africa has undergone considerable expansion : the number of students is calculated at 985 per 100 000 inhabitants, but if North Africa, where tertiary education is much more widely developed than on the rest of the continent, is excluded, then the average for sub-Saharan Africa registers at 400 students per 100 000 inhabitants. There again, the average figures mask a wide variety of situations depending upon the country: out of the 37 countries where recent data is available (2004/05 or closest year), 23 have under 500 students per 100 000 inhabitants, 8 countries between 500 and 1000 students per 100 000 inhabitants and 6 countries over 1 000 per 100 000 inhabitants.
Gender disparities are still significant
In general, gender inequalities are more pronounced the higher the level of education, since they are accentuated between the two secondary levels, then between secondary and tertiary education : the share of girls overall drops from 45% in lower secondary to 42% in upper secondary and finally to 40% in tertiary education. The extent of the inequalities greatly varies from one country to another, as shown in graph 3.B. The high level of gender inequalities in secondary education, in many African countries, has shown signs of a slight reduction since 2000: the share of girls has stagnated or slightly increased in almost all countries, with the
Lesotho Cape Verde Botswana South Africa Algeria Mauritius Tunisia Sao Tome and Principe Swaziland Namibia Madagascar Egypt Sudan Cameroon U.R. of Tanzania Morocco Gambia Uganda Ghana Congo Zambia
Average
Nigeria Comoros Burundi Mozambique Senegal Burkina Faso Djibouti Sierra Leone Niger Eritrea Côte d'Ivoire Togo Mali Benin Guinea Chad
0% 10% 20% 30% 40% 50% 60%
Graph 3.B: Share of girls' in general secondary education
Source: Authors' calculations based on sector analysis and UIS data
In TVET, the share of girls is slightly lower than in general secondary, registering at 41%. It should be borne in mind that the share of girls in this level of education very much depends on the fields of study on offer. As a result, there is a wide range of parity indexes: in some countries, there are five to ten times fewer girls than boys (Comoros and Zambia) and in others there are just as many, even more (Burkina Faso, Lesotho and Ghana). Even so, it should be highlighted that girls are in the minority in the great majority of countries.
Pupil/student-teacher ratios on a downward trend
EDUCA
TION FOR ALL
IN AFRICA
CHAPTER 3
2. Has focalisation on UPE goals mechanically
increased the pressure of demand on
secondary education?
Past trends and recent trends: comparison of growth rates
No global acceleration of the growth in access rates to secondary education is noted. However, if we set aside the eight countries with an access to secondary education of over 60% in 2000, and which have therefore limited possibilities of growth in secondary education (Cape Verde, Botswana, Algeria, Mauritius, Tunisia, Namibia, Egypt and South Africa), it is noticed that for many countries, access to secondary education has increased, on average, more rapidly between 2000 and 2004 than between 1990 and 2000. It must be highlighted that amongst the 22 countries with acceleration in their growth rate, 9 show average annual growth rates of over 10%, which seems very high, especially with regard to the level of development of secondary education in these countries: the cases of Niger, Mozambique, Chad and Tanzania are typical in this respect. These countries have particularly poor levels of development in secondary education, and show very high rates of growth, over 20% per year on average for Niger and Mozambique: there is clearly an issue as to the sustainability of such a pace of expansion for these countries.
Very much the same observations are made when looking at growth in pupil totals (see graph 3.C): for countries where access to secondary education was already high, the growth rates are low and often lower than those observed over the 1990-2000 period. For the others, 10 countries show a decrease in the rate of growth in pupil numbers, compared to 20 countries where this has increased over the 2000-2004 period. There are even 13 countries with average annual growth rates in pupil numbers of over 10% between 2000 and 2005, and over 20% for Mozambique, Niger and Tanzania.
A ver ag e ann u al gr owth 2000-2004 Uganda CAR Chad Burkina Faso Burundi Tanzania Mozambique Niger Benin Côte d'Ivoire Botswana Tunisia Mauritius Namibia Algeria South Africa Egypt Mauritania Cape Verde Mali Madagascar Djibouti Senegal
LesothoSudan Eritrea Comoros Zambia Cameroon Guinea Sierra Leone Ghana Swaziland Togo Morocco Congo Gambia -5% 0% 5% 10% 15% 20% 25%
-5% 0% 5% 10% 15% 20% 25%
Average annual growth 1990-2000
Graph 3.C: Average annual rate of increase in pupil numbers in the first grade of general secondary education between 1990/01 and 2000/01 and between 2000/01 and 2004/05
All in all, if we take only those countries with access of under 60% in 2000 into account, then two-thirds of them have registered acceleration in growth rates in terms of pupil numbers or of access to secondary education: this is particularly marked for Chad, Niger, Mozambique and United Republic of Tanzania. For around ten countries with access of under 60% in 2000, there has been a slow down in growth rates, which remain high in spite of everything.
Where does the growth observed in access to lower secondary education originate? Access to secondary education results from three factors, i.e. access to primary, survival in primary and transition between primary and secondary education. Using a breakdown technique, the growth in access rates to secondary education can be expressed as the sum of the evolution of these three components, in order to see to what extent access to primary education translates into access to secondary education.
Once again, the variety of situations makes it impossible to outline country profile types. However, a number of elements seem to emerge. Firstly, the highest increases in secondary access are noted in the 12 countries with a low rate of access (under 25%) in 2000, and which had therefore plenty of leeway for making rapid progress; it is also in those countries where the primary access rates have progressed the most since 2000. It is important to underline the fact that, in these countries, the rise in access to and survival in primary education has not been compensated for by lower transition to secondary education. On the contrary, all the rates combine and there is therefore an absence of flow regulation.
The situation is very different for the other countries, where the access rate to secondary education was already a little higher in 2000 (ranging from 25% to 60%): for these countries, it can be noted that the survival rate observed in primary education is a determining factor on access to secondary education, even if this sometimes rises or sometimes falls, making it impossible to define a specific trend. In the great majority of cases, it compensates for the rise (or fall) in access to primary education, whilst there is little evolution in transition between primary and secondary education.
4
DAKAR +7
E D U C A T I O N F O R A L L
IN AFRICA
C
H
A
P
T
E
R
4
Measures, evolution and
management of the quality
of learning
Within the EFA framework, it is essential to grant just as much
importance to what pupils actually learn in the classroom as to access
and survival in school, given that learning achievements are the
ultimate aim of all education. Available data shows that the African
school is very much behind quality-wise since the average level of
pupils is low, both in absolute and relative terms. This poor average
does however conceal many disparities, from one country to another
but also within countries. It can then be asked whether this poor
performance is imputable to the expansion of the education systems,
as per the well-known saying that deterioration in the quality of
learning is the price to pay for scaling up enrolments. This argument
does not stand up to analysis, as it is shown to be possible to make
significant progress in enrolments while, at the same time,
guaranteeing a certain level of learning. In fact, it turns out that the
major problem, typical of African education systems, lies in the
considerable variation in results depending upon the schools,
highlighting the shortfall in management in terms of the quality of
learning, which puts a strain on national average scores.
EDUCA
TION FOR ALL
IN AFRICA
16 TIMSS: Trends in International Mathematics and Science Study.
17 SACMEQ: Southern Africa Consortium of Monitoring
1. Panorama
International surveys
The few countries that have participated in international programmes display performances very much below the international average, since they are generally ranked in bottom place.
Thus, for example, the five countries that participated in the TIMSS16 survey in 2003 (South
Africa, Botswana, Ghana, Morocco and Tunisia) are to be found in the last 7 out of 45 countries. It is important to underline the fact that these international surveys were designed, above all, for developed countries and have been carried out in very different contexts. Even so, these results do provide a first impression of the level of school learning and confirm the common opinion that the quality of education in Africa is poor. It is, however, worth looking into these results in more detail, as this average performance conceals very significant disparities between the different countries, which are not all faced with the same situation.
Regional programmes
SACMEQ17 and PASEC18 are two regional assessment programmes, with SACMEQ supplying
data for 14 Southern and Eastern African countries and PASEC for 9 French-speaking African countries. The analysis of results confirms, first of all, the modest level of the countries taken into account by these two programmes. For example, no country participating to PASEC tests
has an average score higher than 50/100. More refined analysis shows that performances
vary greatly from one country to another: for SACMEQ, there are huge differences between Malawi or Zambia, with average scores of close to 430, and Kenya or Mauritius, where average scores are over 550. Similarly, results in the PASEC tests show big differences between Mauritania or Central African Republic (CAR), on the one hand, and Côte d'Ivoire or Cameroon, on the other hand, which have noticeably better results (see graph 4.A).
0 10 20 30 40 50 60
46 51 44 35
35 29 28 24 19
46 41
47 55 37
33 33 28 21
Cameroon Côte d'Ivoire Burkina Faso Madagascar Senegal Chad Benin CAR* Mauritania
Mathematics French
Graph 4.A: Scores in PASEC Mathematics and French tests in 5thgrade (Score out of 100)
Sources: PASEC and the Pôle de Dakar for CAR
Moreover, within countries, pupil results are very heterogeneous and scores are very much dispersed. If we take the example of Cameroon in Mathematics, where the average score is of 46, we can note that a little more than 6% of pupils had such low scores that they are below or equal to the scores they could have obtained if they had replied randomly to the tests, while around 5% of pupils had scores of over 80 out of 100. Such a situation is far from being specific
to Cameroon and is rather one of the characteristics of the African school. Indeed, it is not
EDUCA
TION FOR ALL
IN AFRICA
CHAPTER 4
Literacy
Another way of approaching quality is to look at the probability of literacy after six years of schooling; household surveys make this possible. Measuring the probability of literacy today amongst young adults does not however inform on the quality of school today but of school in the early 1990's. In spite of that, recourse to this data provides extensive international comparisons: it is possible to compare African countries with other developing countries for example.
Once again, results confirm the problems of quality in education in Africa. In the early 1990's, the probability of literacy, after accessing the sixth grade of primary education, was estimated at around 68% in African countries, which means around one in three pupils was not literate at the end of primary education, while the probability of literacy reached 93% in 9 developing countries outside of Africa. However, there are again huge disparities, since this probability varies from under 30% to almost 100% on the African continent overall.
2. The quality/quantity trade-off,
an invalid argument
On seeing these results, one may be inclined to explain them by the rapid expansion in enrolments in the last twenty years: the relationship between scaling up enrolments and the quality of learning has therefore been examined very carefully. This issue can be studied from the angle of literacy over the 1970-1990 period or for more recent trends (end of the 1990's and early 2000's) using the SACMEQ and PASEC tests.
Over the period ranging from the early 1970's to the early 1990's, characterised by a high
growth in enrolments (the access rate to 6thgrade rose by 34%), there was moderate evolution
Angola Zambia Ghana Swaziland Mali Malawi Kenya Equatorial Guinea Côte d'ivoire Senegal Gambia Nigeria Burundi Sao Tome and Principe
Guinea-Bissau Ethiopia Rwanda Sierra Leone Togo Congo CAR Niger DRC Cameroon Gabon Benin Lesotho Mozambique Guinea Comoros Tanzania Mauritania Chad 50 60 70 80 90 100 110 120 130 140 150
50 75 100 125 150 175 200 225 250 Evolution of access in 6th grade of school (1970=100)
Evoluti on o f th e pr obability o f liter
acy with 6 years o
f sch oolin g (1970=100)
A
B
C
D
Graph 4.B: Relationship between quantitative and qualitative progress over the 1970-1990 period
Sources: DHS, MICS and QUIBB data, 2000 (or closest year) and authors' calculations
The study of recent trends leads to similar conclusions: the increase in school enrolments has not coincided with a deterioration in quality either in Cameroon or in Madagascar, where even an improvement is seen, whereas a very significant fall in Reading performance is noted in
Namibia and Malawi, along with an increase in rates of access to 6thgrade.
EDUCA
TION FOR ALL
IN AFRICA
CHAPTER 4
3. For better management and a significant
increase in time spent in school
It is not sufficient to observe that there are huge problems of quality of learning, it is also necessary to search for explanations, in order to come up with appropriate solutions. The analysis conducted in this chapter highlights the extent of the disparities between classes and schools within the African education systems. This fact seems indeed to be an African specificity, with consequences on the average performance of the systems: statistical simulations show that these disparities have considerable impact on the average of the quality of learning. There are thus significant levers for improving the quality of learning achievements that involve the reduction in disparities between classes and schools.
However, traditional factors such as teacher training, textbooks, and class size, etc. do not provide an explanation for the major part of these disparities. In fact, it seems that the time spent in school could be a determining factor in explaining these disparities: indeed, many observations in the field converge towards the fact that actual teaching time is distinctly insufficient in African schools and is also very unevenly distributed between schools and classes. The reasons are numerous and varied: they concern, on the one hand, the length and adaptation of the school year and, on the other hand, teacher and pupil absenteeism. Difficult socioeconomic conditions often place strong constraints on the populations that they are unable to break away from in order to respond to school requirements: this suggests the idea of introducing some flexibility into school calendars, in order to adapt them to local context. As for teacher absenteeism, this is a complex problem since it concerns health problems, administrative reasons (delays in assignments, travel to draw salary, etc.) and problems of assiduity.
Although complementary studies still need to be conducted, it is essential for school management to tackle the problem of time spent in school as a priority since, it must be
stressed, one can hardly hope to improve significantly the quality of learning in basic
5
DAKAR +7
E D U C A T I O N F O R A L L
IN AFRICA
C
H
A
P
T
E
R
5
What strategy for non-formal
education in the current
panorama of Education for All?
Along with the mobilization in favour of UPE, the fight against
illiteracy is increasingly focused on formal education. Today, the
financing of non-formal education programmes for illiterate adults
and for young people, with poor or non-existent schooling, has
become an even more acute issue. The aim here is to examine very
generally the relevance of non-formal education on different aspects
and then to see why and how the programmes can be assessed.
Advocacy developing today around the issue of non-formal education
has indeed little chance of being heard, if it does not also promote the
implementation of reliable programme evaluations allowing the
foundations to be laid for efficient management of the sub-sector.
EDUCA
TION FOR ALL
IN AFRICA
1. Non-formal education :
relevance and social effects
In the past, literacy and non-formal education were sectors that received little financial support from governments and external partners and today, they seem to be further marginalized even though the needs they specifically address have far from disappeared: the literacy rate calculated on the over 15 age group for the 2000-2004 period for the whole of sub-Saharan Africa registered at only 61%.
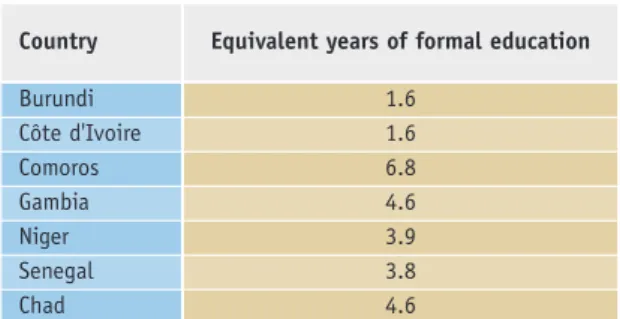
The weight of non-formal education varies greatly according to the country: around zero in most countries where formal education is well established, and between 0.3% and 26.7% in the other countries where attendance in formal education represents practically less than half that of the different types of education for the 15-49 age group. Its effectiveness will only therefore be analysed in countries where data is available and where such programmes are sufficiently represented, i.e. Burundi, Côte d'Ivoire, Comoros, Gambia, Niger, Senegal and Chad. In the absence of a direct measure of the effectiveness of specific non-formal education programmes, it is interesting to study, at least for exploratory purposes, their impact on a number of social dimensions and to compare this with those associated, in the same areas, with the absence of education or with the benefits of formal education. The data
sources used are the MICS19household surveys carried out by UNICEF between 2000 and
2002. In these surveys, non-formal education is not broken down into its different components and so covers, without distinction, adult literacy activities and complementary (for specific populations) or substitute (for a school-age population) non-formal education as well as formal education structures.
Specific beneficiaries
The population benefiting from non-formal education over the seven countries taken into consideration is relatively distinctive. It most often concerns men (except in Burundi and Comoros) and rural areas (except for Côte d'Ivoire, where most beneficiaries live in town). The beneficiaries according to the income of the head of the family are, somewhat unexpectedly, quite evenly distributed between the income quintiles: attending non-formal education is therefore not typical of being poor.
Good results in terms of sustainable literacy…
The primary objective of non-formal education programmes consists in providing the participants with sustainable literacy. On this point, the results clearly show that the probability of literacy for individuals who have followed a literacy programme is higher than for those who have had no education.
This result should however be qualified, as it is rather when the formal system is itself of poor quality in terms of sustainable literacy (low proportion of literate adults after 6 years of primary education), that the benefit of non-formal education appears high.
…not necessarily having an effect upon health attitudes Literacy is often associated with an improvement in behaviour in areas such as birth control and health. The idea is therefore to see if literacy and non-formal education programmes do have a positive impact on a number of variables related to these areas. The results do not provide clear conclusions on this point. Indeed, on the different areas taken into consideration, the practices of those who have benefited from non-formal education do not differ significantly from those who have had no education. When there is an effect, it is often country-specific and undoubtedly reflects the variability in content of non-formal education from one country to another.
Thus, it appears that non-formal education enables, above all, to gain access to literacy without, however, guaranteeing some of the externalities generally associated with it. It is also important to highlight the variety of results undoubtedly corresponding to the variety of programmes, goals, organization methods, contexts and, in all likelihood, populations. There is consequently room in the non-formal education sector for the same type of assessments as those conducted in primary education in the past.
EDUCA
TION FOR ALL
IN AFRICA
CHAPTER 5
Country Equivalent years of formal education
Burundi 1.6
Côte d'Ivoire 1.6
Comoros 6.8
Gambia 4.6
Niger 3.9
Senegal 3.8
Chad 4.6
Table 5.A: Equivalence of literacy programmes in number of years of formal study
2. Determining factors in the quality and
sustainability of adult literacy taking
Morocco as an example
An exploratory analysis of the decisive factors in the quality of learning in literacy programmes was conducted in Morocco in 2004, based on the results obtained by trainees in end of session knowledge tests. This study underlined the importance of the operators and, above all, of the trainers in differentiating results: on the one hand, as opposed to what is noted in primary education, individual trainee characteristics were not as important as those of the operators and trainers. On the other hand, the analysis did not able identification of the trainer characteristics the most likely to account for the marked differences observed in pedagogical effectiveness, that is to say that the differences have undoubtedly a somewhat strong personal dimension (teacher's personal qualities and also his/her level of involvement); taking into account the teacher effect in the beneficiaries' achievements, this would justify more active regulation (inspections/assessments,
greater transparency in terms of results…) and even maybe more rigorous selection (possibly a
posterioriin the case of annual contracts). These evaluations, followed by a selection process,
could constitute a more effective strategy for guaranteeing better results and increased mobilization for the sector.
6
DAKAR +7
E D U C A T I O N F O R A L L
IN AFRICA
C
H
A
P
T
E
R
6
Financial sustainability
in the development
of secondary
and tertiary education
The increasing number of pupils completing primary education today
20and their desire to continue education beyond this level combine to
place mechanical pressure on post-primary education. Moreover,
many arguments are put forward to justify not only an expansion in
universal education to nine or ten years but also to enable the access
of more young people to tertiary education in Africa.
The question is then to know whether post-primary education in
Africa will be able to give a positive response to a large share of this
potential demand as it has done so far? In other words, are these
rates of expansion appropriate, considering the conditions of
education observed today? Are they realistic as to the economy
considering the low job opportunities available in the productive
sectors
21on the one hand and national development priorities on the
other hand? Finally, are they financially sustainable and possible in real
terms, considering the number of places to be created and of
teaching staff to be recruited and trained, even if the financial
resources were to be available? Such are the questions that this
chapter tries to answer, by providing factual information based on the
latest available data.
20 On average, 80% of pupils completing primary education accessed lower secondary education in 2005 compared to hardly 60% in 1990.
21 See chapter 7.
EDUCA
TION FOR ALL
IN AFRICA
1. The case of general secondary education
High rates of expansion in general secondary education, whatever the scenario22
On the basis of the projections for primary completion rates in 2015 made in chapter 2 and supposing that the primary-secondary transition rate, as well as dropping out and repetition in lower secondary education, are maintained at their 2005 value, enrolments in this level,
for the whole of the 2623countries taken into account, would rise from 8 million in 2005 to
13.9 million by 2015. Even in the hypothesis of not achieving UPE in 2015, 11 of the
26 countries for which this simulation has been made, will have to multiply their secondary capacity by at least two before then, in order to enrol their pupils in the same conditions as in 2005. Burkina Faso, Niger and Chad will have to multiply their schooling supply by three. Knowing that on average the schooling conditions in terms of available places and pupil-teacher ratio are not currently very satisfactory, this result constitutes an important element to be taken into account when giving consideration to the possibilities of expansion in secondary education. On the basis of a progressive increase in transition between the two cycles with an objective of 100% by 2015, and maintaining survival rate and the proportion of repeaters at their 2005 value, enrolments in lower secondary would rise to 20.4 million, and to 22.4 million in the case of an improvement in survival and a reduction in repetition.
Supposing that UPE would be achieved by 2015, that transition rates between primary and secondary, and survival rates and the proportion of repeaters all
maintained at 2005 values, then the
number of enrolments in lower secondary for the whole of the 29 countries would rise from 9.1 million in 2005 to 25 million in 2015, i.e. multiplied by 2.8. If transition between primary and lower secondary education was then progressively increased in order to reach 100% by 2015, and survival rate and the proportion of repeaters were maintained at constant values, the number of enrolments in lower secondary would be 35.5 million, which would imply, on average, a four-fold increase of current supply. Finally, the number of enrolments in this level of education is estimated at 52.6 million supposing that
universal education of nine or ten years is achieved by 2020. Thus, universal schooling of
nine or ten years, on the 2020 horizon, would involve multiplying the supply of lower secondary education by 6 on average by then in the 29 countries.On the one hand, Burkina Faso, Burundi, Central African Republic, Chad and Niger should enrol ten times more pupils on average in 2020 than in 2005, in order to ensure universal secondary education for their populations (graph 6.B). On the other hand, less effort will be needed for countries like Swaziland, Ghana, Gambia, Lesotho and Togo but even so they would have to multiply the number of places supplied by two or three (graph 6.A).
22 In the group of countries with a completion rate lower than 75% in 2005.
EDUCA
TION FOR ALL
IN AFRICA CHAPTER 6 Lower Upper Ethiopia Djibouti Côte d'Ivoire Guinea Comoros Sierra Leone Eritrea Congo Cameroon Sudan Togo Gambia Lesotho Ghana Swaziland 1 2 3 4 5 6 7
1 2 3 4 5 6
Graph 6.A: Multiplication factor of under 5 for enrolments in secondary education - hypothesis of achieving universal education of nine or ten years Lower Upper Niger Burundi CAR Tanzania Burkina Faso Chad Uganda Malawi Mozambique Mauritania Mali Madagascar Senegal Benin 5 10 15 20 25 30
3 5 7 9 11 13 15 17 19
Graph 6.B: Multiplication factor of over 5 for enrolments in secondary education - hypothesis of achieving universal education of nine or ten years
Sources: Authors' calculations based on sector analysis and UIS data
Such rates of expansion will have high financial consequences
Further studies on the financial implications of the scenarios based on different hypotheses as to the evolution of the macroeconomic aggregates and the principal elements of educational policy show that the financial consequences for each country are far beyond what is sustainable with public financing, whatever the configuration envisaged for the development of secondary education.
2. The case of tertiary education
There is growing demand for tertiary education in Africa and this trend could continue
0 1 2 3 4 5 6 7 8 9 10 11 12 13 14 Guinea-Bissau
Zambia Zimbabwe Morocco South Africa Eritrea DRC Kenya Mauritania Niger Sao Tome and Principe Namibia Madagascar Côte d'Ivoire Gambia Malawi Libya Algeria Togo Equatorial Guinea Angola Swaziland CAR Congo Guinea Egypt Cameroon Mauritius Gabon Senegal Lesotho Sierra Leone Botswana Cape Verde Nigeria Rwanda Burundi Uganda Chad Benin Tunisia Sudan Ethiopia Mozambique Tanzania Mali Burkina Faso Ghana Comoros Djibouti
Graph 6.C: Multiplication factor of increase in enrolments in tertiary education in Africa between 2004 and 2015, taking into account current rates of expansion (simulations)
Sources: Calculations based on sector analysis, UIS and World Bank data
24 Average value for a sample of 23 African countries in 2003 (cf. Brossard M., Foko B., 2007, Coût et financement de l'enseignement supérieur en Afrique francophone, World Bank, Africa Region Human Development Series, Washington DC).
EDUCA
TION FOR ALL
IN AFRICA
CHAPTER 6
Current rates of expansion will not be financially sustainable in many countries … In order to provide a rapid evaluation of the financial viability of the perspectives of expansion in tertiary education in Africa, simulations have been made for 30 African countries for which necessary data was available, making hypotheses on the national public resources liable to be mobilized in favour of tertiary education and on total costs (current and investment) necessary for the expansion of the systems. In addition, it has been supposed that education structures would positively address the potential demand estimated earlier. These simulations
show that maintaining the current pace of expansion will represent a huge challenge
for most countries. The average annual financing need for the 30 countries overall varies between 515 and 583 million US dollars per year between 2005 and 2015, according to the modalities of financing. This shows that on the scale of 30 countries, as a whole, the alternative hypotheses concerning the mobilization of public resources for tertiary education have a limited influence on the financial gap.
The extent of the financing need encourages thinking on other financing alternatives and/or giving consideration to other models of expansion. The financial leeway will however be tight in many countries. Tertiary education is indeed in competition with the other levels of education in public resources appropriation and, for certain levels, the needs generated by the necessary progress towards UPE will lead to curbing, and even to reducing, the relative
priority for tertiary education in countries where this is relatively high. This suggests that the
different countries should pursue very ambitious policies in order to prevent deterioration in study conditions and in the quality of service in tertiary education, such as controlling enrolments by quantitative flow management on entering and within tertiary education, controlling production costs of services while maintaining or even improving the quality of services provided, developing the private sector, transferring part of the costs to the students or setting up incentive measures authorizing public institutions to develop income-generating activities.
…and raise concerns as to the physical capacity of the countries to address this demand
Apart from the budget needs required in order to run the structures, the significant
increase in enrolments will also require a very high number of qualified teachers to be trained and considerable investments.With regard to the needs in teaching staff, it is estimated that, on the basis of a constant average student-teacher ratio of 1 teacher for
23 students24, needs in teachers should rise from around 56 000 to 142 000 between 2004
and 2015 for the 30 countries as a whole. In other words, between 2004 and 2015, it will
7
DAKAR +7
E D U C A T I O N F O R A L L
IN AFRICA
C
H
A
P
T
E
R
7
Social and economic
sustainability in the
development of post-primary
education
The question of the social and economic sustainability of post-primary
education is closely linked to the individual and social returns to this
type of education. Recognition of primary education, as a basic right
and of the high social benefits (the economists'
positive externalities
)
it generates, guarantees the convergence of individual interests and
the interests of society in pursuing UPE. At post-primary level, this
convergence is not necessarily evident : the social externalities
associated with a higher level of education are largely marginal
compared to those already associated with primary education ; as for
the economic benefits, they depend crucially upon the integration of
school leavers in the job market and therefore upon the adjustment,
in quantity and in quality, of the number of those qualifying from the
different levels and fields of study to the needs of the economy. Such
an adjustment is difficult to achieve: projections in this area are
somewhat unreliable and individual behaviour patterns do not
systematically guarantee reaching community goals.
EDUCA
TION FOR ALL
IN AFRICA