Rev Bras
Cineantropom
Hum
DOI: http://dx.doi.org/10.5007/1980-0037.2018v20n4p415
review article
Systematic review of childhood and
adolescence sedentary behavior: analysis of the
Report Card Brazil 2018
Revisão sistemática do comportamento sedentário na
infância e adolescência: análise do Report Card Brasil
2018
Kelly Samara Silva1
Alexsandra da Silva Bandeira1 Priscila Cristina dos Santos1 Luís Eduardo Argenta Malheiros1 Ana Caroline F. C. de Sousa1 Valter Cordeiro Barbosa Filho2
Abstract – The aim of this study was to summarize studies examining the prevalence of sedentary behavior among Brazilian children and adolescents. A systematic review con-ducted on eight databases (PubMed, Scopus, Web of Science, LILACS, SPORTDiscus, BIREME, Scielo, and Google Scholar). The criteria applied were: original research; samples including Brazilian children and adolescents; to be a school- or population-based survey; observational studies using different measures of sedentary behavior; studies show-ing the prevalence of at least one component of sedentary behavior. Of the 205 studies included, 104 were analyzed. There was a greater concentration of studies in the southern (n=41) and northeastern (n=18) regions. The components more frequently investigated were watching TV (n=36) and screen time (n=32). Only three studies included children under seven years, and the age range more investigated was 10 to 19 years. Most of the studies used a self-reported questionnaire and showed variability in the cut-off point applied (from 2 to 4 hours/day). The prevalence of adolescents who met recommendations ranged from 9.4% to 68.0% for sedentary behavior (<2 hours/day) and from 16.8% to 67.2% for TV viewing (<2 hours/day). The prevalence ranged from 39.1% to 97.7% for computer use and from 47.7% to 98.0% for videogame use. Most of the studies reported that less than half of the adolescents met the recommendations of sedentary behavior and TV viewing. On the other hand, more than half of them devoted less than two hours a day to computer and videogame use.
Key words: Adolescent behavior; Brazil; Prevalence; Sedentary lifestyle.
Resumo – Objetivou-se sintetizar estudos que estimaram a prevalência de comportamento sedentário (CS) em crianças e adolescentes. Revisão sistemática conduzida em oito base de dados (PubMed, Scopus, Web of Science, LILACS, SPORTDiscus, BIREME, Scielo, and Google Scho-lar). Os critérios utilizados foram: artigos originais; amostras incluindo crianças e adolescentes; levantamentos de base escolar e populacional; estudos observacionais usando diferentes medida do CS; estudos mostrando a prevalência de pelo menos um componente do CS. Dos 205 estudos incluídos, 104 foram analisados. Houve maior concentração de estudos nas regiões Sul (n=41) e Nordeste (n=18). Os componentes mais investigados foram assistência à TV (n=36) e tempo de tela (n=32). Somente três estudos incluíram dados de crianças com menos de sete anos, e a maioria investigou adolescentes de 10 a 19 anos. A maioria dos estudos usou questionários e apresentou variabilidade no ponto de corte utilizado (de 2 a 4 horas). A prevalência de adolescentes que atendiam às recomendações de CS (<2 horas/dia) variou de 9,4% a 68,0%. A prevalência de adolescentes que assistiam TV (<2 horas/dia) foi de 16,8% a 67,2%. Para o uso de computador, a prevalência variou de 39,1% a 97,7%; e de 47,7% a 98,0% para o videogame. Na maioria dos estudos menos da metade dos adolescentes atendeu às recomendações de CS e de tempo de TV.
1 Federal University of Santa Catari-na. Florianópolis, SC. Brazil. 2 Federal Institute of Ceará. Campus Boa Viagem. Boa Viagem, CE. Brazil.
Received: May 30, 2018
INTRODUCTION
Sedentary behavior is defined as any human activity that requires an
ex-penditure of less than 1.5 METs to perform
1and represents most of the
activities that constitute the lifestyle of young people
2. Excessive time in
sedentary behavior has been associated with obesity
3, increased blood
pres-sure
4, and lower cardiorespiratory fitness
5. Guidelines have been created in
order to reduce negative consequences for health, with recommendation of
a maximum time of sedentary behavior of less than two hours to be
per-mitted to children and adolescents, specifically directed at screen activities
(e.g., TV viewing, playing videogames, using a computer)
4.
A study has shown that estimates of sedentary behavior in the young
population have increased significantly around the world
6. Another study
involving 5,844 children from twelve countries observed that children
spend an average of 8.6 hours in sedentary behavior, and 54.2% of them
did not meet the recommendation
6. According to a Brazilian survey, 60%
of elementary school students reported watching TV for more than two
hours a day
7. Data from several European and North American countries
have shown that 68% of girls and 66% of boys spend two or more hours a
day watching TV
8. Wide variability in the prevalence and changes of the
investigated components was found in the aforementioned studies.
Exploring the prevalence of different components (screen time, TV
viewing, sitting time) according to gender may help identify which
indica-tors are more frequent in daily activities among children and adolescents
8.
Studying these questions helps and clarifies future directions of
interven-tions and public policies aimed at reducing sedentary behavior among
boys and girls
9. Thus, the objective of the present investigation was to
summarize studies that analyzed the prevalence of sedentary behavior in
Brazilian children and adolescents up to 18 years of age.
METHODOLOGICAL PROCEDURES
Measured Outcome
In this review, sedentary behavior was characterized by an energy
expendi-ture ≤1.5 metabolic equivalent, while in a sitting, reclining or lying posexpendi-ture
1. Self-reported information (e.g. questionnaires about sedentary behavior,
TV viewing; videogames and computer use; screen time; and sitting time)
and objective measures were included.
Study Search Strategies
A systematic search was performed in the following databases: Medline
(PubMed), Scopus, Web of Science (Web of Knowledge), LILACS
(
Literatura Latino-Americana em Ciências da Saúde
), SPORTDiscus,
combinations among descriptor groups. The truncation symbols ($, * or “”)
specific for each database were also used to increase the range of searches
for the descriptor variations. Searches were conducted with the descriptors
in English and Portuguese. The searches of the electronic databases were
supplemented with a screening of the reference list of retrieved articles in
order to find potentially relevant titles.
Selection process
The initial selection was based on the titles of manuscripts, and when there
was uncertainty, on the abstract. After this step, articles were obtained in
the full text version and subsequently analyzed according to established
selection criteria, and the reference lists of the articles were evaluated. All
of these steps were performed independently and conducted by two pairs
of reviewers (PCS/AC and AB/LM), and a third pair of senior reviewers
(KS/VB) helped when there were disagreements.
Selection criteria
To be eligible for inclusion in this systematic review, studies needed to be:
(I) original research published in peer-reviewed journals (dissertations and
monographs were not included because it was impractical to systematically
search them); (II) samples including Brazilian children and adolescents
aged 0-18 years (or a mean age within this range) or a sample comprising
other age years (when data had been presented separately); (III) to be a
school- or population-based survey with information about the
methodo-logical procedures of representation of the target population (e.g., random
sampling); (IV) observational studies using different methods for sedentary
behavior assessment (e.g., self-report, structured interviews, objectively
measured sedentary behavior, and steps per day); and (V) studies showing
the prevalence of at least one component of sedentary behavior (e.g., TV
viewing, use of computer and videogames, and time in the sitting position).
Data extraction and Analysis
Data extraction was performed by four authors (PCS/AC and AB/LM),
half of the references were read by each pair, and a third author (KS or VB)
helped when the article did not report the information clearly. The
preva-lence of sedentary behavior was extracted always in a positive way according
to the established cut-off point of each article. For instance, if the article
established a cut-off point >2 hours/day of TV viewing, we extracted the
prevalence of those who spent less than 2 hours in this behavior. In addition,
articles from the same study were coupled in order to avoid duplication of
information. Therefore, information from the same study but in different
articles, such as cut-off point and strata, was reported in the review, making
it clear that they were different articles from the same investigation.
the prevalence of sedentary behavior in alphabetical order considering the
location of the studies. Additionally, data of its components (watching TV,
videogame and computer use) were presented.
RESULTS
The results are summarized in the flowchart in Figure 1. The initial search
of eight databases located 1,490 potential articles. After removal of
dupli-cate articles 1096 records remained. Next, titles and abstracts were read,
171 full papers were selected for further review, and 9 other studies were
located in the reference lists of these articles. After reviewing the full
content of the articles, 76 were excluded (see supplementary material 2)
and 104 met the inclusion criteria.
The 104 original studies included were published from 2004
10to
2018
11,12and an interval from 2001 to 2015 was observed for the year
of data collection. When different articles were found to report results
about the same investigation, the articles were grouped, for a total of 81
studies. There was a greater concentration of studies in the southern (n=
41) and northeastern (n= 18) regions, while few studies were carried out
in the southeast (n= 12), north (n= 4), or central-west (n= 3), or involved
a national scope (n= 3).
Regarding the components of sedentary behavior investigated, TV
viewing (n= 36) and screen time (n= 32) were those more investigated in
the articles included, followed by computer (n= 22) and videogame (n= 7)
use. Few studies
11,13–17investigated other components of sedentary behavior
such as indicators that did not involve screen time.
All samples were considered to be representative, ranging from 328
to 60,973 participants. Age range varied among studies. Younger
chil-dren were less investigated, with only three studies including chilchil-dren
under seven years.
18–20The age range more investigated was 10 to 19
years.
11–13,21–100Most of the studies used self-reported questionnaires, but
less than half the studies reported information about instrument
valid-ity.
9,14,17,18,30–33,36,42,52–54,59–62,65,67–70,73–75,77–81,86,93,94,97,99–106Only three studies
assessed sedentary behavior using accelerometers.
11,15,16Figure 1. Flowchart of the studies through the phases of the systematic review.
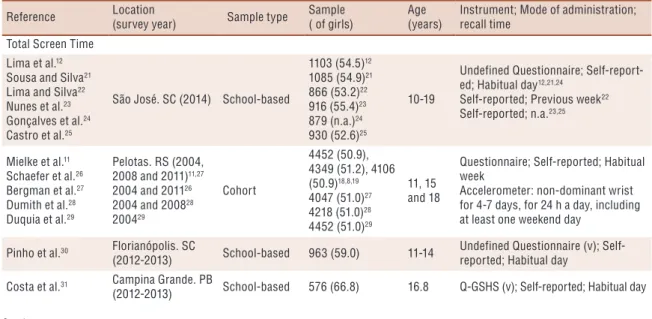
Table 1. Characteristics of the original studies about sedentary behavior among Brazilian children and adolescents included in the present review.
Reference Location (survey year) Sample type Sample( of girls) Age (years) Instrument; Mode of administration; recall time
Total Screen Time Lima et al.12
Sousa and Silva21
Lima and Silva22
Nunes et al.23
Gonçalves et al.24
Castro et al.25
São José. SC (2014) School-based
1103 (54.5)12
1085 (54.9)21
866 (53.2)22
916 (55.4)23
879 (n.a.)24
930 (52.6)25
10-19
Undefined Questionnaire; Self-report-ed; Habitual day12,21,24
Self-reported; Previous week22
Self-reported; n.a.23,25
Mielke et al.11
Schaefer et al.26
Bergman et al.27
Dumith et al.28
Duquia et al.29
Pelotas. RS (2004,
2008 and 2011)11,27
2004 and 201126
2004 and 200828
200429
Cohort
4452 (50.9), 4349 (51.2), 4106 (50.9)18,8,19
4047 (51.0)27
4218 (51.0)28
4452 (51.0)29
11, 15 and 18
Questionnaire; Self-reported; Habitual week
Accelerometer: non-dominant wrist for 4-7 days, for 24 h a day, including at least one weekend day
Pinho et al.30 Florianópolis. SC
(2012-2013) School-based 963 (59.0) 11-14
Undefined Questionnaire (v); Self-reported; Habitual day
Costa et al.31 Campina Grande. PB
Reference Location (survey year) Sample type Sample( of girls) Age (years) Instrument; Mode of administration; recall time
Lourenço et al.32 Uberaba. MG (2015) School-based 1,009 (55.0) 14-19 Questionnaire (removed from
COM-PAC); Self-reported; n.a.
Silva et al.33 Caruaru. PE (2014) School-based 481 (54.1) 14-19 Undefined Questionnaire (v);
Self-re-ported; Habitual week Pereira et al.34
Silva et al.35
Uruguaiana. RS
(2011) School-based 1,455 (50.9) 10-17
Undefined Questionnaire; Self-report-ed; n.a.
Cureau et al.101
Oliveira et al.36 Brazil (2013-2014) School-based
36,956 (60.0)101
74,589 (55.3)36 12-17
Undefined Questionnaire (v); Self-reported; Habitual day
Geremia et al.109 Bento Gonçalves.
RS (n.a.) School-based 590 (58.5) 8-18 Undefined Questionnaire; Self-report-ed; n.a.
Padro et al.37 Viçosa. MG (n.a.) Cross-sectional 676 (55.9) 10-19 Undefined Questionnaire;
Self-report-ed; n.a. Christofaro et al.39
Christofaro et al.38 Londrina. PR (2011) School-based 1231 (58.2) 15.5
Undefined Questionnaire; Self-report-ed; Habitual day
Coledam et al.40
Coledam et al.41 Londrina. PR (2012) School-based
738 (53.4)40
753 (52.5)41 10-17
Undefined Questionnaire; Self-report-ed; Habitual day
Beck et al.42 Três de Maio. RS
(2006) School-based 660 (52.0) 14-18
Undefined Questionnaire (v); Self-reported; Habitual day
Dias et al.43 Cuiabá. Mato Grosso
(2009 e 2011) School-based 1716 (49.3) 10-14
Undefined Questionnaire; Self-report-ed; Habitual week
Moraes et al.44
Moraes et al.45
Moraes and Falcão46
Maringá. PR (2007) School-based 682 (54.2)
44
991 (54.5)45,46 14-18 Undefined Questionnaire;
Self-report-ed; Habitual day
Santos et al.9 Uberaba. MG (2012) School-based 649 (52.1) 9-12 Questionnaire (v); Parental-reported
(proxy); n.a.
Vasconcelos et al.47 Niterói. RJ (2010) School-based 328 (67.2) 10-18 Undefined Questionnaire;
Self-report-ed; Habitual day
Bergman et al.48 Uruguaiana. RS
(2011) School-based 1455 (50.9) 10-17 Undefined Questionnaire; Self-report-ed; Habitual day
Lucena et al.49
Martins et al.50
Farias Junior et al.51
João Pessoa. PB
(2009) Shool-based
2874 (57.8)49,51
2859 (57.8)50 10-19
Undefined Questionnaire; Self-report-ed; Habitual week
Costa and Assis20 Florianópolis. SC
(2002) School-based 2936 (48.8) 7-10
Undefined Questionnaire; Parental-reported; Habitual day
Legnani, et al.52 Toledo. PR (2007) School-based 669 (49.9) 10-15 Q-GSHS (v); Self-reported; Previous
week
Mazaro et al.107 Sorocaba. SP (2009) School-based 680 (51) 7-11 Undefined Questionnaire;
Self-report-ed; n.a.
Legnani et al.53
Legnani et al.54
Foz do Iguacu. PR
(2005) School-based 453 (59.2) 15-18
Q-GSHS (v); Self-reported; Previous week
Oliveira et al.18 São Luís. MA (2005) School-based 592 (50.5) 3-16 SAPAC; Self-reported; Previous day
Cimadon et al.110 Bento Gonçalves.
RS (n.a.) School-based 590 (58.5) 9-18 Undefined Questionnaire; n.a.
Lancarotte et al.55 São Paulo. SP
(2010) School-based 2,125 (50.5) 10-19
Undefined Questionnaire; Self-report-ed; n.a.
Molina et al.108 Vitória. ES (2010) School-based 1,282 (58) 7-10 Undefined Questionnaire;
Self-report-ed; n.a.
Moraes et al.56 Maringá. .PR (2007) School-based 991 (54.5) 14-18 Undefined Questionnaire;
Self-report-ed; n.a.
Vasques e Lopes57 Caxias do Sul. RS
(2007) School-based 1,675 (53.2) 11-17
Undefined Questionnaire; Self-report-ed; n.a.
Reference Location (survey year) Sample type Sample( of girls) Age (years) Instrument; Mode of administration; recall time
Castro et al.58 Rio de Janeiro. RJ
(2003) School-based 1684 (52.8) 13-18+ Undefined Questionnaire; Self-report-ed; n.a.
Silva et al.59
Silva et al.104
Silva et al.61
Silva et al.62
Lopes et al.63
State of Santa Catarina (2001 and 2011)
School-based 2001: 5.028 (59.3)
2011: 6,529 (57.8) 15-19
Undefined Questionnaire (v); Self-reported; Habitual week
Suñe et al.64 Capão da Canoa. RS
(2004) School-based 719 (50.2) 11-13
Undefined Questionnaire; Self-report-ed; n.a.
TV Watching Time Lima et al.12
Sousa and Silva21
Castro et al.25
São José. SC (2014) School-based
1103 (54.5)12
1085 (54.9)21
930 (52.6)25
10-19 Undefined Questionnaire; Self-report-ed; Habitual day
Silva et al. 33 Caruaru. PE School-based 481 (54.1) 14-19 Undefined Questionnaire (v);
Self-reported; Habitual week
Munaro et al.65 Jequié. BA (2015) School-based 1,163 (57.9) 14-15 Questionnaire (v) (removed from
COMPAC); Self-reported; n.a.
Regis et al. 13 Recife. PE (2011) School-based 6,234 (59.7) 14-19 Undefined Questionnaire;
Self-reported; n.a
Silva et al. 111 Criciúma. SC (2010) School-based 1,081 (49.6) 10-14 Undefined Questionnaire;
Self-report-ed; Habitual day
Silva et al. 67 Londrina. PR (2011) School-based 1,321 (55.2) 10-16 Undefined Questionnaire (v);
Self-reported; n.a.
Bezerra et al. 69 Manaus. AM (2011) School-based 864 (54.9) 14-19 Questionnaire (v) (removed from
COMPAC); Self-reported; Habitual day Bezerra Jorge et
al. 68
Brito et al. 70
Pernambuco (2006) School-based 4,207 (40.2) 16.8 Q-GSHS (v); Self-reported; Habitual
day
Melzer et al. 19 Santos. SP (2010) School-based 357 (45.9) 3-10 YRBS questionnaire (v); Self-reported;
n.a
Fronza et al. 71 São Bonifácio. SC
(2010) School-based 283 (46.6) 10-19 Undefined Questionnaire; Self-report-ed; Habitual day
Santos Martins et
al. 72 Fortaleza. CE (2011) School-based 964 (51.5) 17-19
Undefined Questionnaire; Self-report-ed; Habitual day
Ferreira et al.73 Brazil (2012) School-based 109,104 (52.2) 13-16 Q-GSHS; Self-reported; Habitual day
Dutra et al. 102 Pelotas,.RS (2002)
Population-based 616 (n.a.) 8
PAQ-C; Parental-reported; Previous week
Silva et al. 74
Silva et al. 75 Aracaju. SE (2011) School-based 2,259 (62.3) 13-18 Self-reported; n.a.
Santos et al. 9 Uberaba. MG (2012) School-based 649 (52.1) 9-12
Questionnaire
Life habits; Parental-reported (proxy); n.a.
Vitta et al. 76 Bauru. SP (2009) School-based 524 (46.9) 10-14 Undefined Questionnaire;
Self-report-ed; n.a.
Vasconcelos et al. 47 Niterói. RJ (2010) School-based 328 (67.2) 10-18 Undefined Questionnaire;
Self-report-ed; Habitual day Lucena et al. 49
Martins et al.50
Farias Junior et al. 51
João Pessoa. PB
(2009) Shool-based 2874 (57.8)
49,51
2859 (57.8)50 10-19
Undefined Questionnaire; Self-report-ed; Habitual week
Barbosa Filho et al. 77
Barbosa Filho et al. 78 Curitiba. PR (2011) School-based
1,555 (52.6)77
1,628 (47.5)78 11-17.9 Q-GSHS (v); Self-reported; n.a.
Costa and Assis20 Florianópolis. SC
(2002) School-based 2936 (48.8) 7-10 Undefined Questionnaire; Parental-reported; Habitual day
Reference Location (survey year) Sample type Sample( of girls) Age (years) Instrument; Mode of administration; recall time
Camelo et al. 79
Hallal et al. 80
Malta et al. 81
Brazilian capitals and Federal District (2009)
School-based 59,809 (52.7)79
60,973 (n.a)80,81
13-16 79
13-15
80,81
Questionnaire (v); Self-reported; Habitual day79
Questionnaire (v); Self-reported; Habitual week 80,81
Alves et al.82 Salvador. BA (n.a) School-based 803 (50.6) 10-14 Undefined Questionnaire;
Self-report-ed; n.a.
Farias et al. 83 Rio Bran.co. AC
(2009) School-based 741 (54.1) 14-18 Undefined Questionnaire; Self-report-ed; n.a.
Vitta et al. 84 Bauru. SP (2007) School-based 1236 (51.7) 11-14 Undefined Questionnaire;
Self-report-ed; n.a.
Fermino et al. 85 Curitiba. PR (2006) School-based 1518 (59.2) 14-18 Undefined Questionnaire;
Self-report-ed; Habitual week
Rivera et al. 103 Maceió. AL (2001) School-based 1,253 (56.3) 7-17 PAQ-C (v); Self-reported; n.a.
Tenório et al. 86 Permambuco (2006) 4210 (59,8) 10-20 Q-GSHS (v); Self-reported; Previous
week
Pelegrini et al. 87 Florianópolis. SC
(2007) School-based NR (67) 14-18 Undefined Questionnaire; Self-report-ed; n.a.
Silva et al. 60 Aracaju. SE (NR) School-based 1,118 (56.7) Mean:
15,25 PAQ-C (v); Self-reported; n.a
Mielke et al.11
Wells et al. 88
Hallal et al.89
Dumith et al. 90
Pelotas. RS (2004, 2008 and 2011) 2004 e 2005
Cohort
4452 (50.9) 4349 (51.2) 4106 (50.9)11,88
4,452 (49.2)89
4431 (n.a.)90
10-1211
11, 15 and 1888
10-1289
11.0 90
Questionnaire; Self-reported; Habitual week
Accelerometer: non-dominant wrist for 4–7 days, for 24 h a day, including at least one weekend day
Self-reported; n.a. 89
Self-reported; Habitual day90
Fernandes et al. 91
Fernandes et al. 92
Presidente Prudente.
SP (2007) School-based 1630 (54.0) 11-17 Questionnaire Baecke (v); Self-report-ed: previous 4 months
Campagnolo et al. 94
Campagnolo et al.93
São Leopoldo. RS
(2002-2003) Population-based 722 (59.4) 10-19 7-DPAR (v); Self-reported; Previous week
Castro et al.(2008)58
Rio de Janeiro. RJ
(2003) School-based 1684 (52.8) 13-18+
Undefined Questionnaire; Self-report-ed; n.a.
Silva et al.59
Silva et al.104
Silva et al. 61
Silva et al. 62
Lopes et al. 63
Santa Catarina (2001
e 2011) School-based
2001: 5.028 (59,3)
2011: 6,529 (57.8) 15-19
Undefined Questionnaire (v); Self-reported; Habitual week
Detsch et al. 95 São Leopoldo. RS
(2004) School-based 495 (100.0) 14-18 Undefined Questionnaire; Self-report-ed; n.a.
Costa et al. 10 Teixeira de Freitas.
BA (2001) School-based 354 (38.4) 17-19
Undefined Questionnaire; Self-report-ed; n.a.
Computer Use Time
Mielke et al.11
Hallal et al 89
Dumith et al.90
Pelotas. RS (2004,
2008 and 2011) Cohort
4,452 (50.9), 4,349 (51.2), 4,106 (50.9)11
4,452 (49.2)89
4431 (n.a.)90
11, 15 and 1811
11-1289
mean 11.090
Self-reported; Habitual week Accelerometer: non-dominant wrist for 4–7 days, for 24 h a day, including at least one weekend day
Self-reported; n.a.89
Lima et al.12
Sousa and Silva21
Castro et al.25
São José. SC (2014) School-based 1103 (54.5)
12
1085 (54.9)21
930 (52.6)25
10-1912,21
16.125
Undefined Questionnaire; Self-report-ed; Habitual day12,21
Self-reported; n.a.25
Silva et al.33 Caruaru. PE School-based 481 (54.1) 14-19 Undefined Questionnaire (v);
Self-reported; Habitual week
Munaro et al.65 Jequié. BA (2015) School-based 1,163 (57.9) 14-15 Questionnaire (v) (removed from
COMPAC); Self-reported; n.a.
Regis et al. 13 Recife. PE (2011) School-based 6,234 (59.7) 14-19 Undefined Questionnaire;
Self-report-ed; n.a.
Reference Location (survey year) Sample type Sample( of girls) Age (years) Instrument; Mode of administration; recall time
Silva et al. 66 Recife. PE (2011) School-based 961 (61.6) 14-19 Undefined Questionnaire;
Self-reported; n.a
.Bezerra et al.69 Manaus. AM (2011) School-based 864 (54.9) 14-19 Questionnaire (removed from
COM-PAC); Self-reported; Habitual day Santos Martins et
al. 72 Fortaleza. CE (2011) School-based 964 (51.5) 17-19
Undefined Questionnaire; Self-report-ed; Habitual day
Melzer et al.19 Santos. SP (2010) School-based 357 (45.9) 3-10 YRBS questionnaire (v); Self-reported;
n.a. Barbosa Filho et
al.77 Curitiba. PR (2011) School-based 1,555 (52.6) 11-17.9 Q-GSHS; Self-reported; n.a.
Vasconcelos et al.47 Niterói. RJ (2010) School-based 328 (67.2) 10-18 Undefined Questionnaire;
Self-report-ed; Habitual day
Santos et al.9 Uberaba. MG (2012) School-based 649 (52.1) 9-12
Questionnaire
Life habits (v); Parenal-reported (proxy); n.a
Vitta et al.76 Bauru. SP (2009) School-based 524 (46.9) 10-14 Questionnaire; Self-reported; n.a.
Lucena et al. 49
Martins et al. 50
Farias Junior et al. 51
João Pessoa. PB
(2009) Shool-based 2874 (57.8)
49,51
2859 (57.8)50 10-19
Undefined Questionnaire; Self-report-ed; Habitual week
Costa and Assis20 Florianópolis. SC
(2002) School-based 2936 (48.8) 7-10 Undefined Questionnaire; Parental-reported; Habitual day
Farias et al. 83 Rio Branco. AC
(2009) School-based 741 (54.1) 14-18
Undefined Questionnaire; Self-report-ed; n.a.
Vitta et al. 84 Bauru. SP (2007) School-based 1236 (51.7) 11-14 Undefined Questionnaire;
Self-report-ed; n.a.
Fermino et al.85 Curitiba. PR (2006) School-based 1518 (59.2) 14-18 Undefined Questionnaire;
Self-report-ed; Habitual week
Pelegrini et al.87 Florianópolis. SC
(2007) School-based n.a. (67) 14-18
Undefined Questionnaire; Self-report-ed; n.a.
Silva et al. 59
Silva et al.104
Silva et al.61
Silva et al.62
Lopes et al.63
State of Santa
Cata-rina (2001 e 2011) School-based
2001: 5.028 (59,3)
2011: 6,529 (57.8) 15-19
Undefined Questionnaire (v); Self-reported; Habitual week
Castro et al.58 Rio de Janeiro. RJ
(2003) School-based 1684 (52.8) 13-18+ Undefined Questionnaire; Self-report-ed; n.a.
Detsch et al.95 São Leopoldo. RS
(2004) School-based 495 (100.0) 14-18
Undefined Questionnaire; Self-report-ed; n.a.
Videogame
Mielke et al.11
Hallal et al.89
Dumith et al.90
Pelotas. RS (2004, 2008 and 2011)
2004-200584,85
Cohort
4,452 (50.9), 4,349 (51.2), 4,106 (50.9)11
4,452 (49.2)89
4431 (n.a.)90
11, 15 and 1811
10-1289
Undefined Questionnaire; Self-report-ed; Habitual week
Accelerometer: non-dominant wrist for 4–7 days, for 24 h a day, including at least one weekend day
Self-reported; n.a89
Lima et al.12
Sousa and Silva21
Castro et al.25
São José. SC (2014) School-based
1103 (54.5)12
1085 (54.9)21
930 (52.6)25
10-1912,21
16.125
Undefined Questionnaire; Self-report-ed; Habitual day12,21
Self-reported; n.a.25
Silva et al.33 Recife. PE (2011) School-based 961 (61.6) 14-19 Undefined Questionnaire;
Self-report-ed; n.a.
Santos et al.9 Uberaba. MG (2012) School-based 649 (52.1) 9-12
Questionnaire
Hábitos de Vida (v); Parental-reported (proxy); n.a.
Reference Location (survey year) Sample type Sample( of girls) Age (years) Instrument; Mode of administration; recall time
Vasconcelos et al.47 Niterói. RJ (2010) School-based 328 (67.2) 10-18 Undefined Questionnaire;
Self-report-ed; Habitual day
Costa and Assis 20 Florianópolis. SC
(2002) School-based 2936 (48.8) 7-10 Undefined Questionnaire; Parental-reported; Habitual day
Pelegrini et al.87 Florianópolis. SC
(2007) School-based (67) 14-18
Undefined Questionnaire; Self-report-ed; n.a.
Other Sedentary Behaviors
Mielke et al.11 Pelotas. RS (2004,
2008 and 2011) Cohort
4,452 (50.9), 4,349 (51.2) 4,106 (50.9)
11, 15 and 18
Self-reported; Habitual week Accelerometer: non-dominant wrist for 4–7 days, for 24 h a day, including at least one weekend day
Regis et al.13 Recife. PE (2011) School-based 6,234 (59.7) 14-19 Undefined Questionnaire;
Self-report-ed; n.a. Silva et al.96
Silva et al.112 Aracaju. SE (2011) School-based 3,992 (61.3) 14-19
Undefined Questionnaire; Self-report-ed; Habitual day
Felden et al.113 Maravilha. SC (n.a.) School-based 516 (50.1) 10-19 IPAQ (v); Self-reported; Habitual day
Alexandre et al.97 Cuiaba. MT (2011)
Population-based 399 (59.0) 12-19
Q-GSHS (v); Self-reported; Habitual day
Barbosa et al.15 Londrina. PR (2013) School-based 370 (50.6) 4-6 Accelerometer; School day
Bezerra et al.69 Manaus. AM (2011) School-based 864(54.9) 14-19 COMPAC 2 (v); Self-reported; Habitual
day
Farah et al.98 PE (2011) School-based 4619 (60.4) 14-9 Undefined Questionnaire;
Self-report-ed; Habitual day
Hildebrand et al.16 Pelotas. RS
(2006-2007)
Cross-sectional and observational
10,793 (53)
Pelotas: 426 (47) 13-14 Accelerometer; 24 hours wear protocol
Ferreira et al.105
Azeredo et al.99
Rezende et al.114
Brazil (2012) School-based 109, 104 (52.2) 13-16 Q-GSHS (v); Self-reported; Habitual day
Guimarães et al.115 Curitiba. PR (2011) School-based 572 (57) 12-17.9 QASA (v); Self-reported; Previous
week
Guedes and Souza17 João Pessoa. PB
(2008) School-based 1,268 (50.3) 15-18 IPAQ (v); Self-reported; Previous week
In this review, the results were synthetized according to the components
of the sedentary behavior used, considering a cut-off-point of 2 hours. In
general, no specific trend was observed in the results, with 9.4%
116to 68%
53of
adolescents, for example, meeting the recommended screen time of 2 hours/
day. In summary, most of the studies reported a prevalence of less than 50%
of youths that met the recommendation. Considering sex, the prevalence was
similar for boys (range: 4.4%
46to 60.8%
53) and girls (range: 3.1%
46to 65.7%
53)
(Table 2).
For TV time, the range for adolescents who met the recommendations was
16.8%
69to 67.2%
65. For this component, most of the studies also reported a
prevalence below 50% of subjects meeting the recommendation. Among girls,
all studies showed a prevalence of less than 50% of adolescents who met the
Note. States of Brazil: AC: Acre; AM: Amazonas; SE: Sergipe; AL: Alagoas; CE: Ceará; PE: Pernambuco; BA: Bahia; MA: Maranhão; MG: Minas Gerais; MT: Mato Grosso; PR: Paraná; ES: Espírito Santo; RJ: Rio de Janeiro; SP: São Paulo; SC: Santa Catarina; RS: Rio Grande do Sul. Undefined Questionnaire (v): Undefined Questionnaire Validated; 1DPAR: 1-day physical activity record; HA-D: habitual day; HA-W: habitual week; n.a.: not available; PAR-Q: Physical Activity Questionnaire for Older Children; PR-D: previous day; PR-W: previous
week; PR-4M: previous 4 months; Q-GSHS: questionnaires based on Global School-based Student Health Survey and/or YRBS: Youth
recommendation (prevalence range: 20.5%
80to 58.4%
68) while for boys,
three studies reported a prevalence higher than 50% (prevalence range:
20.5%
71,80to 56.3%
10) (Table 2).
Regarding computer use, most studies showed a higher prevalence
of youths that met recommendations. In nine
11,19,20,33,51,65,84,87,116out of
eleven studies, the prevalence of youths that met recommendations was
higher than 50% (prevalence range: 39.1%
83to 97.7%
11). Regarding girls,
seven
12,20,51,69,84,87,116out of eight studies reported a prevalence above 50%
of subjects who met recommendations (prevalence range: 43.1%
116to
98.0%
20), whereas among boys five
20,51,84,87,116out of eight studies reported
that more than 50% met recommendations (prevalence range: 34.4%
116to
85%
20) (Table 2).
Four studies
11,20,25,87included in this review investigated videogame use.
The prevalence of youths who met recommendations was higher than 50%
in three
11,20,25of the four studies analyzed (prevalence range: 47.7%
87to
98.0%
20). Three studies
20,21,87investigated the prevalence stratified by sex:
for girls the range was of 51.6%
87to 100%
87, and for boys, the range was
of 39.8%
87to 92.0%
20of adolescents who met recommendations (Table 2).
Table 2. Description of the prevalence of sedentary behaviors among Brazilian children and adolescents.
Reference Location (survey year) Definition Prevalence of Sedentary Behavior
All Boys Girls
Total Screen Time Lima et al.12
Lima and Silva22
Nunes et al.23
São José. SC (2014) < 4 hours/day12,22,23
17.612
13.822
12.623
Sousa and Silva21
Gonçalves et al.24
Castro et al.25
São José. SC (2014) < 2 hours/day21,24,25 13.6
21
14.624
12.825
9.121 17.321
Mielke et al.11
Duquia et al.29
Pelotas. RS
(2004 and 2011)11
200429
< 4 hours/day11,29
11 years: 56.8 15 years: 47.3 18 years: 50.611
49.529
Schaefer et al.26
Bergman et al.27
Pelotas. RS (2004. 2008
and 2011)26,27 < 2 hours/day26,27
11 years: 15.5 18 years: 14.026
11 years: 25.0 12 years: 19.8 13 years: 22.627
11 years: 15.7 18 years: 13.526
11 years: 15.2 18 years: 14.626
Dumith et al.28 Pelotas. RS (2004 and
2008)28 Mean (min/day)28 25628
Pinho et al.30 Florianópolis. SC
(2012-2013) ≤ 2 hours/day 60.9 55.4 64.5
Costa et al.31 Campina Grande. PB
(2012-2013) < 2 hours/day n.a. 24.6 20.3
Lourenço et al.32 Uberaba. MG (2015) < 2 hours/day 18.1
Silva et al.33 Caruaru. PE (2014) < 2 hours/day 42.1
Pereira et al.34
Silva et al.35 Uruguaiana/RS (2011) < 3 hours/day 35.834 38.235 33.535
Oliveira et al.36
Cureau et al.101 Brazil (2013-2014)
≤ 2 hours/day 26.536
40.5101 25.636 27.736
Geremia et al.109 Bento Gonçalves. RS
Reference Location (survey year) Definition Prevalence of Sedentary Behavior
All Boys Girls
Prado et al.37 Viçosa. MG (n.a.) ≤ 2 hours/day 35.2 58.4 41.6
Christofaro et al.38
Christofaro et al.39 Londrina. PR (2011) < 2 hours/day 10.039 6.238 12.838
Coledam et al.40
Coledam et al.41 Londrina. PR (2012) < 2 hours/day 36.541 33.740 23.640
Beck et al.42 Três de Maio. RS (2006) Mean (hours/day) 4.4 ± 2.4 4.2 ± 2.5 4.5 ± 2.2
Dias et al.43 Cuiabá. MT (2009 and
2011) < 4 hours/day 41.9 43.2 40.5
Moraes et al.44 Maringá. PR (2007) Cluster: Sedentary44 n.a. 44.744 17.844
Moraes et al.45 Maringá. PR (2007) Mean (hours/day)45 n.a. 7.145 6.045
Moraes and Falcão46 Maringá. PR (2007) < 2 hours/day46 n.a. 4.446 3.146
Santos et al.9 Uberaba-MG (2012) Mean (min/day) 225.0 ± 195.0 240.0 195.0
Vasconcelos et al.47 Niterói. RJ (2010) Mean (hours/week) n.a. 41.2 ± 2.2 38.8 ± 1.4
Bergman et al.48 Uruguaiana. RS (2011) ≤ 3 hours/day 35.8 n.a. n.a.
Lucena et al.49 João Pessoa. PB (2009) ≤ 2 hours/day 20.5 15.7 23.9
Costa and Assis20 Florianópolis. SC (2002) < 2 hours/day
Public school: 22.0 Private school:
21.0
Public school: 19.0 Private school:
17.0
Public school: 25.0 Private school:
24.0
Legnani et al.52 Toledo-PR (2007) < 2 hours/day 52.3
10-12 years: 54.7 13-15 years:
43.7
10-12 years: 55 13-15 years:
56.7
Mazaro et al.107 Sorocaba-SP (2009) < 2 hours/day 35.0
Legnani et al.53
Legnani et al.54 Foz do Iguacu-PR (2005) < 2 hours/day
68.053
67.254 60.853 65.753
Oliveira et al.18 São Luís. MA (2005) ≤ 2 hours/day 46.1 n.a. n.a.
Cimadon et al.110 Bento Gonçalves. RS
(n.a.) < 5 hours/day 57.5 n.a. n.a.
Lancarotte et al.55 São Paulo-SP (2010) < 2 hours /day n.a 34.1 29.5
Molina et al.108 Vitória-ES (2010) < 4 hours/day 51.3 46.2 55
Moraes et al.56 Maringá-PR (2007) < 4 hours/day 18.3
Vasques and Lopes57 Caxias do Sul. RS (2007) < 2 hours/day 13.4 10.4 16
Castro et al.58 Rio de Janeiro. RJ (2003) < 4 hours/day 28.3 28.1 28.5
Silva et al.61
Silva et al.59
Santa Catarina State (2001 e 2011)
2011
< 2 hours/day59,61 2001: 24.0
2011: 9.461
2001: 23.2 2011: 9.161
15 years: 27.5 16 years: 25.2 17 years: 27.2 18 years: 24.9 19 years:
28.959
2001: 24.5 2011: 9.761
15 years: 27.0 16 years: 25.8 17 years: 30.1 18 years: 27.3 19 years:
29.159
Silva et al.104
Silva et al.62
State of Santa Catarina
(2001 e 2011) < 4 hours/day104,62 61.5104
37.7104
39.062
39.1104
40.462
Suñe et al.64 Capão da Canoa. RS
(2004) < 4.5 hours/day 68.6
TV Watching Time
Sousa and Silva21
Castro et al.25 São José. SC (2014) < 2 hours/day21,25
48.421
21.425 52.821 44.821
Silva et al.33 Caruaru. PE (2014) < 2 hours/day 28.3
Munaro et al.65 Jequié – BA (2015) < 2 hours/day 67.2
Reference Location (survey year) Definition Prevalence of Sedentary Behavior
All Boys Girls
Regis et al.13 Recife-PE (2011) < 4 hours/day 86.5
Silva et al.111 Criciúma- SC (2010) Mean (min/day) n.a. 6.0 ±3.0 6.0 ±3.0
Silva et al.67 Londrina-PR (2011) < 4 hours/day 55.0 55.6 54.5
Bezerra et al.69 Manaus. AM (2011) ≤ 2 hours/day n.a. Weekdays: 39.3
Weekends: 40.3 Weekdays: 44.3Weekends: 36.0
Bezerra et al.68
Brito et al.70
Pernambuco State (2006) ≤ 2 hours/day≤ 4 hours/day6870
Weekdays: 59.268
Weekend: 50.168
81.370
Weekdays: 60.368
Weekend: 46.068
83.570
Weekdays: 58.468
Weekend: 52.968
79.870
Melzer et al.19 Santos. SP (2010) < 2 hours/day 16.8
Fronza et al.71 São Bonifácio. SC (2010) < 2 hours/day Weekdays: 23.3
Weekend: 21.6 20.5 26.5
Martins et al.72 Fortaleza. CE (2011) < 3 hours/day 48.9 49.5 50.5
Ferreira et al.73 Brazil (2012) ≤ 2 hours/day 36.3 n.a. n.a.
Dutra et al.102 Pelotas. RS (2002) < 2 hours/day 40.6 n.a. n.a.
Silva et al.74
Silva et al.75 Aracaju. SE (2011) < 2 hours/day74,75 n.a.
33.2 74
33.875
29 74
29.1 75
Santos et al.9 Uberaba. MG (2012) n.a. n.a.
Weekdays: 120 min/day Weekend: 180 min/day Weekdays: 120 min/day Weekend: 180 min/day
Vitta et al.76 Bauru- SP (2009) < 2 hours/day 29.2 29.2 29.5
Vasconcelos et al.47 Niterói. RJ (2010) Mean (hours/week) 24.2 20.3 ± 1.3 26.1 ± 1.1
Martins et al.50
Farias Junior et al.51 João Pessoa. PB (2009) ≤ 2 hours/day
26.850
Weekdays: 33.051
Weekend: 42.251
25.850
Weekdays: 33.351
Weekend: 41.351
27.750
Weekdays: 34.351
Weekend: 42.751
Barbosa Filho et al.77
Barbosa Filho et al.78 Curitiba. PR (2011) < 3 hours/day
23.577 71.278 22.477 68.678 24.677 73.778
Costa and Assis20 Florianópolis. SC (2002) < 2 hours/day
Public school: 32.0 Private school: 40.0 Public school: 34.0 Private school: 43.0 Public school: 30.0 Private school: 37.0 Camelo et al. 79
Hallal et al.80
Malta et al. 81
Brazil (2009) ≤ 2 hours/day
35.079 20.880 20.581 37.079 20.680 20.681 33.279 20.580 20.581
Alves et al.82 Salvador. BA (n.a.) < 3.3 hours/day 48.7 n.a. n.a.
Farias et al..83 Rio Branco. AC (2009) < 2 hours/day 60.1 n.a. n.a.
de Vitta et al.84 Bauru. SP (2007) ≤ 2 hours/day 27.0 28.9 25.5
Fermino et al.85 Curitiba. PR (2006) ≤ 4 hours/day 70.0 71.6 68.8
Rivera et al.103 Maceió. AL (2001) ≤ 3 hours/day 35.0
Tenório et al.86 Permambuco State
(2006) < 3 hours/day 59.1 46.0 52.9
Pelegrini et al.87 Florianópolis. SC (2007) < 2 hours/day 43.5 53.6 41.6
Silva et al.60 Aracaju. SE (n.a.) Mean (hours/day) n.a. 5.50 ±3.54 5.70 ±4.16
Mielke et al.11 Pelotas. RS (2004. 2008
and 2011) < 4 hours/day
11 years: 70.3 15 years: 76.9 18 years: 98.2
Wells et al.88 Pelotas. RS (2004. 2008
and 2011) ≤ 2 hours/day 27.1 29.9 24.5
Reference Location (survey year) Definition Prevalence of Sedentary Behavior
All Boys Girls
Hallal et al.89 Pelotas. RS (2004. 2008
and 2011) Tertil
1st tertile: 1579 (35.6) 2nd tertile 1401
(31.6) 3rd tertile 1457
(32.8)
Dumith et al.90 Pelotas. RS (2004. 2008
and 2011) Mean (min/day) 197.0 190.0 203.0
Fernandes et al.91
Fernandes et al.92
Presidente Prudente. SP (2007)
TV viewing (use fre-quency: % low use=
never and seldom) n.a
70.891
11.292
56.091
6.492
Campagnolo et al.94
Campagnolo et al.93
São Leopoldo. RS
(2002-2003) ≤ 2 hours/day
94
≤ 4 hours/day93
24.994 59.093 24.394 59.793 25.494 58.393
Castro et al.58 Rio de Janeiro. RJ (2003) < 4 hours/day 44.3 49.7 39.5
Silva et al.61
Lopes et al.63
Santa Catarina State
(2001 e 2011) < 2 hours/day
61,63 2001: 23.2
2011:38.561
2001: 23.3 2011: 41.461
2001 Week: 52.8
Weekend: 29.463
2011: Week:74.1
Weekend: 51.063
2001: 23.3 2011: 36.261
2001 Week: 49.3
Weekend: 26.163
2011: Week: 63.7
Weekend: 49.363
Detsch et al.95 São Leopoldo. RS (2004) ≤ 10 hours/week n.a. n.a. 67.5
Costa et al.10 Teixeira de Freitas. BA
(2001) < 2 hours/day 52.5 56.3 46.6
Computer Use Time
Mielke et al.11
Pelotas. RS (2004. 2008
and 2011) < 2 hours/day 15 years 78.811 years 97.7
18 years 73.4
Hallal et al.89 Pelotas. RS (2004. 2008
and 2011) < 1 hour/day 90.3
Dumith et al.90 Pelotas. RS (2004. 2008
and 2011) Mean (min/day) 17 20 13
Lima et al.12
Castro et al.25 São José. SC (2014)
< 4 hours/day12,25 44.712
31.325
Sousa and Silva21 São José. SC (2014) < 2 hours/day21 37.721 50.421
Silva et al.33 Caruaru. PE (2014) < 2 hours/day 43.7
Munaro et al.65 Jequié. BA (2015) < 2 hours/day 72.7
Regis et al.13 Recife.PE (2011) < 4 hours/day 90.5
Silva et al.66 Recife-PE (2011) Mean (hours/day) 5.5 (±2.1) 5.5 (±2.1) 5.5 (±2.1)
Bezerra et al.69 Manaus. AM (2011) ≤ 2 hours/day n.a. 48.0 57.2
Martins et al.72 Fortaleza. CE (2011) < 3 hours/day 78.2 45.0 55.0
Melzer et al.19 Santos. SP (2010) < 2 hours/day 79.0
Barbosa Filho et al.77 Curitiba. PR (2011) < 3 hours/day 64.3 57.9 70.0
Vasconcelos et al.47 Niterói. RJ (2010) Mean (hours/week) n.a. 11.9 (±1.3) 10.6 (±0.9)
Santos et al.9 Uberaba. MG (2012) Median (minutes/day) n.a. Weekdays: 15
Weekend: 30
Weekdays: 30 Weekend: 30
Vitta et al.76 Bauru. SP (2009) < 2 hours/day 43.1 41.9 44.5
Farias Junior et al.51 João Pessoa. PB (2009) ≤ 2 hours/day Weekdays: 61.3
Weekend: 60.8
Weekdays: 54.4 Weekend: 53.2
Weekdays: 66.4 Weekend: 66.3
Costa and Assis20 Florianópolis. SC (2002) < 2 hours/day
Reference Location (survey year) Definition Prevalence of Sedentary Behavior
All Boys Girls
Farias et al.83 Rio Branco. AC (2009) < 2 hours/day 39.1 n.a. n.a.
Vitta et al.84 Bauru. SP (2007) ≤ 2 hours/day 68.3 58.2 76.9
Fermino et al.85 Curitiba. PR (2006) ≤ 4 hours/day 77.3 71.3 81.4
Pelegrini et al.87 Florianopolis. SC (2007) < 2 hours/day 82.5 83.7 82
Silva et al.61 Santa Catarina State
(2001 and 2011) < 2 hours/day
2001: 62.1 2011: 39.4
2001: 58.9 2011: 34.4
2001: 64.6 2011: 43.1
Lopes et al.63 Santa Catarina State
(2001 and 2011) ≤ 1 h
2001 Weekdays: 30.2
Weekend: 13.2 2011 Weekdays: 52.0
Weekend: 29.8
2001 Weekdays: 28.8
Weekend:9.7 2011 Weekdays: 44.2
Weekend: 30.3
Castro et al.58 Rio de Janeiro. RJ (2003) < 4 hours/day 89.4 82.8 95.2
Detsch et al.95 São Leopoldo. RS (2004) ≤ 6 hours/week n.a. n.a. 82.8
Videogame
Mielke et al.11
Hallal et al..89
Dumith et al.90
Pelotas. RS (2004. 2008 and 2011)
2004-200589,90
< 2 hours/day11
< 1 hour89
Mean minutes/d90
11 years 93.5 15 years 92.8 18 years 94.611
90.389
36 min/d90
55 min/d90 18min/d90
Lima et al.12 São José. SC (2014) < 4 hours/day12 84.6
Sousa and Silva21
Castro et al.25 São José. SC (2014) < 2 hours/day21,25 72.025 75.021 92.521
Silva et al. 33 Recife. PE (2011) Mean (hours/day) 2.37 ± 2.50 3.25 ± 2.55 1.82 ± 2.30
Santos et al.9 Uberaba. MG (2012) Median (minutes/day) n.a.
Weekdays: 30
Weekend: 60 Weekdays: 0Weekend: 0
Vasconcelos et al.47 Niterói. RJ (2010) Mean (hours/week) n.a. 8.9 ± 1.0 2.1 ± 0.3
Costa and Assis20 Florianópolis. SC (2002) < 2 hours/day
Public school: 98.0 Private school:
93.0
Public school: 85.0 Private school:
92.0
Public school: 96.0 Private school:
100.0
Pelegrini et al.87 Florianópolis.SC (2007) < 2 hours/day 47.7 39.8 51.6
Other Sedentary Behaviors
Mielke et al.11 Pelotas. RS (2004. 2008
and 2011) Mean (hours/day) 11.5 (±1.5)
Regis et al.13 Recife. PE (2011)
< 4 hours/day (sitting down with no
screen) 85.4
Silva et al.96
Silva et al.112 Aracaju-SE (2011)
≤ 2 hours/day (sum of sitting time: TV viewing, videogame play, computer use, chatting with friends, play cards or domino)
53.3 50.657.511296
57.596
50.6112
Felden et al.113 Maravilha. SC (n.a.) Mean minutes/day
(sitting time) 382.2 ± 234.1 352.1 ± 225.8 413.6 ± 238.9
Alexandre et al.97 Cuiaba. MT (2011)
≤ 2 hours/day (sum of sitting time: TV viewing, videogame play, computer use, chatting with friends, play cards or domino)
45.1 n.a. n.a.
Reference Location (survey year) Definition Prevalence of Sedentary Behavior
All Boys Girls
Barbosa et al.15 Londrina. PR (2013) Mean minutes/week n.a. n.a. n.a.
Farah et al.98 Pernambuco (2011)
< 3 hours/day (sum of sitting time: TV viewing, videogame play, computer use, chatting with friends, play cards or domino)
49.1 61.6 38.4
Hildebrand et al.16 Pelotas-RS (2006-2007) Mean minutes/day 389.0 (±132.0)
Ferreira et al.105
Azeredo et al.99
Rezende et al.114
Brazil (2012)
< 3 hours/day (sum of sitting time: TV viewing, videogame play, computer use, chatting with friends,
play cards or other sitting activities)
38.0 40.9 35.4
Guimarães et al.115 Curitiba. PR (2011)
Median (minimum – maximum in minutes)
(sum of time in sedentary activities:
electronics, educa-tional, transportation,
cultural, social)
n.a.
12-13.9 years: 4800
(1590-12055) 14-15.9 years:
5215 (2224-8235) 16-17.9 years:
5458 (1336-8880)
12-13.9 years: 5305
(1940-10050) 14-15.9 years:
5065 (1605-10050) 16-17.9 years:
5135 (1785-9424)
Guedes and Souza17 João Pessoa. PB (2008)
Median Sitting (min./ week)
(time spent studying, working, relaxing, leisure, domestic activities)
n.a.
15 years: 2380 16 years: 2730 17 years: 3500 18 years: 4620
15 years: 3360 16 years: 4200 17 years: 5250 18 years: 6790
DISCUSSION
This systematic review included data from 105 studies involving representative
samples of Brazilian children and adolescents. Most of the studies showed
that less than half the participants met the recommendations of total screen
and TV time; however, more than half the participants met the
recommen-dations regarding computer or videogame use. Thus, the findings revealed:
i) a higher concentration of studies in the southern and northeastern regions
of Brazil; ii) few studies with children less than seven years of age; iii) the
components more investigated were TV time and screen time; iv) there was
higher methodological variability of the components assessed, measurement
tools and cut-off points used to examine the sedentary behavior.
In the last ten years, the number of publications on this subject has
increased and consequently also their quality, based on sophisticated
instru-ments and statistical analyses
11,16. This scenario has also been observed in
Brazil
117,118. The first Brazilian studies on sedentary behavior focused on TV
viewing time
10,95, followed by studies analyzing other screen components such
as computer
87, videogames
12, and sitting time
13. Moreover, a considerable
imbalance of published data was observed among the various Brazilian
regions. Ramires et al.
118suggested the need to implement research centers
in the Center-West and North regions of the country with the objective
of guaranteeing the dissemination of knowledge.
In the present review, there was wide variation in the proportion of
young people who complied with the recommendation of less than two
hours daily among studies (screen time: 9.4% to 68.0%; TV: 16.8% to
67.2%; computer: 39.1% to 97.7%; videogame: 47.7% to 98%). Part of this
fluctuation can be explained by the use of different questionnaires (some
of them not validated), as reported in a previous study
119. Other
meth-odological aspects have also been reported in another review
117, including
the variability among the components of sedentary behavior investigated
and the cut-off points (e.g. ≤ 2 hours, 3 hours and ≤ 4 hours) used. These
differences impair the examination of the trend of sedentary behavior over
the years; as well as the comparison of estimated prevalence.
Specifically for screen time and TV, most of the studies that used a
cut-off point of ≤ 2 hours a day (screen time: 17 of 20 studies; TV: 15 of
19) reported that less than half the boys and girls met the
recommenda-tions. Regarding screen time, the sum of the use of electronic devices may
contribute to the failure to comply with recommendations. Perhaps the
cut-off point for screen time should be different, considering that we have
grouped a total time of use into screen activities. In contrast to
comput-ers and videogames, most Brazilian households have access to television,
which may explain the lower variability in the proportion of TV viewing
among studies
120.
In contrast, for computer and videogames, studies with a cut-off point
of ≤ 2 hours a day (computer: 9 of 11 studies, videogame: 3 of 4) reported
that more than 60% of adolescents comply with the recommendation.
De-spite the growing use of computers and videogames by adolescents
116, these
electronic devices are not yet accessible to most Brazilian households
120.
Another aspect that can contribute to the greater variability of these
com-ponents in Brazilian data might be social and income inequality
43,116,121.
Considering the use of computer for boys and girls, five out of eight
studies reported that more than half the boys met the recommendation,
whereas for girls seven out of eight studies reported that more than half
met the recommendation. For videogames, two out of three studies
re-ported that more than half the boys complied with the recommendation,
and for girls all studies (three) reported this result. Regarding computers,
other studies also showed that boys spend more time using computers
than girls
63,122, mostly with games
122. Girls spent more time on social
networking sites, listening to music, and online reading
123Several factors
can influence these differences between genders, such as the lack of social
interaction and the violence present in the context of games, which may
be related to less use by girls
124.
due to the high heterogeneity of the components of sedentary behavior
investigated, the instruments and cut-off points used (problems that could
be avoided with the inclusion of more delimited criteria); absence of
as-sessment of risk bias, and the choice to analyze only studies that used a
cut-off point of less two hours (current recommendations), although all
other studies were described in the tables.
In summary, less than half the children and adolescents met the
recom-mendations of screen time and TV viewing, and most of them followed
the recommendations regarding time spent using the computer or
vide-ogames. Only computer use differed between genders, with boys meeting
recommendations less than girls.
We suggest that studies be conducted in the northern and
central-western regions of Brazil to determine the reality of these populations,
as well as studies with preschool children. In addition, we recommend
standardizing and validating questionnaires and the use of cut-off points
according to international guidelines. New components of sedentary
be-havior could also be investigated such as cell phones and tablets, as well as
the type of subject consumed or activity chosen during the time in front
of the screens. Finally, attention is drawn to the high prevalence of young
people who do not meet the recommended use of screen time, and even
exceed this time in a single component.
Acknowledgments
We would like to acknowledge the financial support provided by CAPES
(Coordination of Improvement of Higher Level Personnel) as individual
grants to AS Bandeira and PC Santos, and by CNPq (Ministry of Science
and Technology, Brazil) as individual grants to LEA Malheiros.
COMPLIANCE WITH ETHICAL STANDARDS
Funding
This research did not receive any specific grant from funding agencies in
the public, commercial, or not-for-profit sectors. This study was funded
by the authors.
Conflict of interest statement
The authors have no conflict of interests to declare.
Author Contributions
REFERENCES
1. Pate RR, O’Neill JR, Lobelo F. The evolving definition of “sedentary.” Exerc Sport Sci Rev 2008;36(4):173-8.
2. Koedijk JB, van Rijswijk J, Oranje WA, van den Bergh JP, Bours SP, Savelberg HH, et al. Sedentary behaviour and bone health in children, adolescents and young adults: a systematic review. Osteoporos Int 2017;28(9):2507-19.
3. Tremblay MS, Colley RC, Saunders TJ, Healy GN, Owen N. Physiological and health implications of a sedentary lifestyle. Appl Physiol Nutr Metab Physiol 2010;35(6):725-40.
4. Tremblay MS, Leblanc AG, Kho ME, Saunders TJ, Larouche R, Colley RC, et al. Systematic review of sedentary behaviour and health indicators in school-aged children and youth. Int J Behav Nutr Phys Act 2011; 8:98.
5. Sandercock GRH, Ogunleye AA. Screen time and passive school travel as independ-ent predictors of cardiorespiratory fitness in youth. Prev Med 2012;54(5):319-22.
6. Leblanc AG, Katzmarzyk PT, Barreira TV, Broyles ST, Chaput JP, Church TS, et al. Correlates of Total Sedentary Time and Screen Time in 9-11 Year-Old Children around the World: The International Study of Childhood Obesity, Lifestyle and the Environment. Plos One 2015;10(6):e0129622.
7. Instituto Brasileiro de Geografia e Estatística, editor. Pesquisa nacional de saúde do escolar, 2015. Rio de Janeiro: IBGE; 2016. Available from: <https://biblioteca. ibge.gov.br/visualizacao/livros/liv97870.pdf> [2018 may 18]
8. Hallal PC, Andersen LB, Bull FC, Guthold R, Haskell W, Ekelund U. Global physical activity levels: surveillance progress, pitfalls, and prospects. Lancet 2012;380(9838):247-57.
9. Santos A, Andaki ACR, Amorim PR dos S, Mendes EL. Factors associated with sedentary behavior in 9- to 12-year-old school children. Motriz: J Phys Ed 2013;19(3):25-34.
10. Costa MCO, Silva MCM, Santos JS, Teles C, Souza KEP de, Melo BO. Estilo de vida de adolescentes: consumo alimentar, de bebida alcóolica e atividade física em Teixeira de Freitas - Bahia. Rev Baiana Saúde Pública 2004;28(2):151-66.
11. Mielke GI, Brown WJ, Ekelund U, Brage S, Gonçalves H, Wehrmeister FC, et al. Socioeconomic position and sedentary behavior in Brazilian adolescents: A life-course approach. Prev Med 2018;107(2):29-35.
12. De Lima TR, Silva DAS. Prevalence of physical activity among adolescents in southern Brazil. J Bodyw Mov Ther 2018;22(1):57-63.
13. Regis MF, de Oliveira LMFT, dos Santos ARM, Leonidio A da CR, Diniz PRB, de Freitas CMSM. Urban versus rural lifestyle in adolescents: associations between environment, physical activity levels and sedentary behavior. Einstein 2016;14(4):461-7.
14. Felden ÉPG, Filipin D, Barbosa DG, Andrade RD, Meyer C, Beltrame TS, et al. Adolescentes com sonolência diurna excessiva passam mais tempo em comporta-mento sedentário. Rev Bras Med Esporte 2016;22(3):186-90.
15. Barbosa SC, Coledam DHC, Neto AS, Elias RGM, Oliveira AR de. Ambiente escolar, comportamento sedentário e atividade física em pré-escolares. Rev Paul Pediatr 2016;34(3):301-8.
16. Hildebrand M, Kolle E, Hansen BH, Collings PJ, Wijndaele K, Kordas K, et al. Association between birth weight and objectively measured sedentary time is medi-ated by central adiposity: data in 10,793 youth from the International Children’s Accelerometry Database. Am J Clin Nutr 2015;101(5):983-90.
17. Guedes DP, Souza MV, Ferreirinha JE, Silva AJRM. Physical activity and deter-minants of sedentary behavior in Brazilian adolescents from an underdeveloped region. Percept Mot Skills 2012;114(2):542-52.
19. Melzer MRTF, Magrini IM, Domene SMÁ, Martins PA. Factors associated with abdominal obesity in children. Rev Paul Pediatr 2015;33(4):437-44.
20. Costa FF da, Assis MAA. Nível de atividade física e comportamentos sedentários de escolares de sete a dez anos de Florianópolis-SC. Rev Bras Ativ Fís Saúde 2011;16(1):48-54.
21. Sousa GR, Silva DAS. Sedentary behavior based on screen time: prevalence and associated sociodemographic factors in adolescents. Cien Saude Colet 2017;22(12):4061-72.
22. Lima TR, Silva DAS. Clusters of negative health-related physical fitness indica-tors and associated facindica-tors in adolescents. Rev Bras Cineantropom Desempenho Hum 2017;19(4):436-49.
23. Nunes HEG, Gonçalves EC de A, Vieira JAJ, Silva DAS. Clustering of Risk Fac-tors for Non-Communicable Diseases among Adolescents from Southern Brazil. Plos One 2016;11(7):e0159037.
24. Gonçalves ECA, Silva DAS. Factors associated with low levels of aerobic fitness among adolescents. Rev Paul Pediatr 2016;34(2):141-7.
25. Castro JAC, Nunes HEG, Silva DAS, Castro JAC, Nunes HEG, Silva DAS. Prevalence of abdominal obesity in adolescents: association between sociodemo-graphic factors and lifestyle. Rev Paul Pediatr 2016;34(3):343-51.
26. Schäfer AA, Domingues MR, Dahly DL, Meller FO, Gonçalves H, Wehrmeister FC, et al. Correlates of self-reported weekday sleep duration in adolescents: the 18-year follow-up of the 1993 Pelotas (Brazil) Birth Cohort Study. Sleep Med 2016;23:81-8.
27. Bergmann GG, Bertoldi AD, Mielke GI, Camargo AL, Matijasevich A, Hallal PC. Atividade física, tempo de tela e utilização de medicamentos em adolescentes: coorte de nascimentos de Pelotas, Rio Grande do Sul, Brasil, 1993. Cad Saúde Pública 2016;32(4):e00011715.
28. Dumith SC, Garcia LMT, da Silva KS, Menezes AMB, Hallal PC. Predictors and health consequences of screen-time change during adolescence--1993 Pelotas (Brazil) birth cohort study. J Adolesc Health 2012;51(Suppl. 6):S16-21.
29. Duquia RP, Dumith S de C, Reichert FF, Madruga SW, Duro LN, Menezes AMB, et al. Epidemiologia das pregas cutâneas triciptal e subescapular elevadas em adolescentes. Cad Saúde Pública 2008;24(1):113-21.
30. Pinho MGM de, Adami F, Benedet J, Vasconcelos F de AG de. Association be-tween screen time and dietary patterns and overweight/obesity among adolescents. Rev Nutr 2017;30(3):377-89.
31. Costa IFAF da, Medeiros CCM, Costa FDAF da, Farias CRL de, Souza DR, Adriano WS, et al. Adolescentes: comportamento e risco cardiovascular. J Vasc Bras 2017;16(3):205-13.
32. Lourenço CLM, Pires MR, Leite MAF de J, Sousa TF de, Mendes EL. Deslo-camento passivo para escola e fatores associados em adolescentes. J Phys Educ 2017;28:e2831.
33. Silva AO da, Oliveira LMFT de, Santos MAM dos, Tassitano RM. Tempo de tela, percepção da qualidade de sono e episódios de parassonia em adolescentes. Rev Bras Med Esporte 2017;23(5):375-9.
34. Pereira TA, Bergmann ML de A, Bergmann GG. Fatores associados à baixa aptidão física de adolescentes. Rev Bras Med Esporte 2016;22(3):176-81.
35. Silva T, Oliveira H, Bergmann M, Bergmann G. Associação entre atividade física e tempo de tela com o nível socioeconômico em adolescentes. Rev Bras Ativ Fís Saúde 2015;20(5):503-13.
36. Oliveira JS, Barufaldi LA, Abreu G de A, Leal VS, Brunken GS, Vasconcelos SML, et al. ERICA: use of screens and consumption of meals and snacks by Brazilian adolescents. Rev Saúde Pública 2016;50(suppl. 1):7.