Somatic cell count obtained by Ekomilk Scan
®and correlations
with other methods of analysis
Contagem de células somáticas obtidas pelo equipamento Ekomilk Scan® e suas correlações com outros métodos de análise
Ana Carolina Siqueira Gonçalves1 Luiz Carlos Roma Júnior2
Rafaela Torrezan Privatti3 Márcia Saladini Vieira Salles4
Claudia Cristina Paro de Paz5 Lenira El Faro Zadra5 Ana Maria Centola Vidal6*
ISSNe 1678-4596
INTRODUCTION
The somatic cells present in milk are alveolar cells desquamation (2 to 20% of total), and defense cells (80 to 98%) known as leukocytes or white blood cells (macrophages, neutrophils and lymphocytes) passing to the milk in response to an injury suffered by the mammary gland. When
there is an inflammatory response of the mammary
gland, there is an increase in neutrophil counts, this response is known as mastitis, a major disease of worldwide dairy industry (BRITO, 1999; SANTOS & FONSECA, 2007).
For the SCC analysis defined by IN 62 a
limit of 500x103 cells.mL-1 (BRASIL, 2011); which
although above international standards, (average of
1Faculdade de Ciências Agrárias e Veterinárias, Universidade Estadual Paulista “Júlio de Mesquita Filho” (UNESP), Jaboticabal, SP, Brasil. 2Instituto de Zootecnia, Nova Odessa, SP, Brasil.
3Departamento de Engenharia de Alimentos, Faculdade de Zootecnia e Engenharia de Alimentos, Universidade de São Paulo (USP),
Pirassununga, SP, Brasil.
4Instituto de Zootecnia, Ribeirão Preto, SP, Brasil. 5Instituto de Zootecnia, Sertãozinho, SP, Brasil
6Departamento de Medicina Veterinária, Faculdade de Zootecnia e Engenharia de Alimentos, Universidade de São Paulo (USP), 13635-900, Pirassununga,
SP, Brasil. E-mail: [email protected]. *Corresponding author.
ABSTRACT: The study aimed to evaluate the equipment Ekomilk Scan® as an alternative to somatic cell count (SCC) in milk. For this individual cow milk samples of various ages and different stages of lactation in northeastern state of São Paulo region were collected. The
analyzes performed were divided into variables related to the equipment: repeatability and reproducibility, and variables that could influencing
the results as: use of preservatives, temperature, time between collection and analysis, breed and milk composition, besides analysis to relate
the Ekomilk Scan® with the standard method-direct microscopy and reference-flow cytometry. As the result, for samples analysis, it shouldn’t be
added preservative and these should be conducted on the same day of collection; however, temperature sample did not significantly influence
results. Furthermore, Ekomilk Scan® did not show good correlation of results with the method of direct microscopy; however, it was necessary
to generate equations for a positive correlation between flow cytometry and Ekomilk Scan®. Therefore, it is concluded that the equipment tested is not accurate but it can be an alternative for SCC monitoring in productive units since it uses calibration equations of results.
Key words: monitoring, udder health, alternative method, somatic cell count.
RESUMO: O estudo objetivou avaliar o equipamento Ekomilk Scan® como uma alternativa para a contagem de células somáticas (CCS) no leite. Para isso, foram colhidas amostras individuais de leite de vaca de várias idades em diferentes estágios de lactação na região nordeste do estado de São Paulo. Foram realizadas análises referentes ao equipamento como repetibilidade e reprodutibilidade, e de variavéis que
poderiam influenciar no resultado. Dentre elas: uso de conservante, temperatura, tempo entre a colheita e análise, raça e composição do leite,
além de análises visando correlacionar o Ekomilk Scan® com o método padrão-microscopia direta e de referência-citometria de fluxo. Como
resultado, foi observado que para as análises das amostras não se deve acrescentar conservante e estas devem ser realizadas no mesmo dia da
colheita, porém a temperatura da amostra não possui influencia significativa nos resultados. O Ekomilk Scan® não demonstrou boa correlação
dos resultados com o método de microscopia direta e citometria de fluxo, sendo necessário gerar equações para uma correlação positiva entre os métodos. Assim, conclui-se que o equipamento testado não apresenta resultados precisos, contudo pode ser uma alternativa para o monitoramento da CCS em unidades produtivas desde que utilize equações de calibração dos resultados.
Palavras-chave: monitoramento, saúde da glândula mamária, método alternativo, contagem de células somáticas.
200x103 cells.mL-1) is already a major advance for
sector because the analysis provided the knowledge of milk quality and health of the mammary gland.
The reference method recognized by International Dairy Federation (IDF), for determination of SCC in milk is direct microscopy, microscopic method described by PRESCOTT & BREED (1910) is classical and is based on a milk rate homogeneously distributed in an area known, followed by drying, coloring, and counting by observing in an optical microscope (MARSHALL,
1992). Number of cells counted in the defined area
is multiplied by the duty cycle of the microscope and expressed as number of cells per milliliter (IDF, 1991). However, this technique requires much time to be performed, with a wide variation in interpretation between different observers, not the most recommended method to monitor the quality of milk from herds with large numbers of animals, but it becomes necessary for calibration of other methods (PRATA, 1998).
Flow cytometry is a standard method used by the Brazilian Network Control of the Milk Quality of the Ministry of Agriculture, Livestock and Supply, which is based on the fact that the stained cells are carried by a liquid being excited by
a laser beam. The stained nuclei emit fluorescence, light pulses which are amplified by a multiplier
photo, counted and converted into concentration of somatic cells (CECALAIT, 1993). This is an automatic method, expensive, easily processed and used in most developed countries. The various models adapts to the different requirements of laboratories; although, there are some limitations as the price of equipment and maintenance according to region (GODKIN, 2000).
In this context, alternative methods to obtain SCC result for more affordable, less laborious and easily handled by producers and/or small dairy are so important for monitoring milk production, to improve health of the mammary gland and consequently the quality of milk produced, as Ekomilk Scan® equipment. It is a portable
and affordable equipment, which popularized its acquisition in different dairy farms and dairy laboratories. The principle on which the method is based is the viscosity and it uses a surfactant - Ekoprim® reagent - which dissolves the cell
membrane and, on contact with the genetic material acquires a gelatinous consistency, increasing the viscosity of milk. There is a proportional relationship between the viscosity of the milk and the number of somatic cells in the milk tested. Thus
the equipment measures the flow time through the
capillary homogenizer milk sample and determines the number of somatic cells in accordance with this time. Range of detection of this count is between 90-1.500 cells.mL-1, corresponding to time 10 to 50
seconds, respectively. Both values -time and SCC- are output on the device display.
The aim of the present study was to evaluate the SCC results obtained by the Ekomilk Scan® equipment comparing them with standard
and reference methods, and test the associated variables. This research also aimed to determine the effectiveness and reliability of the equipment in their analysis, in order to introduce another SCC method of choice, contributing to the control of the health of the mammary gland and to obtain milk quality.
MATERIALS AND METHODS
The experiment was divided to evaluate each variable with possible interference in test results whether variables inherent in the equipment such as test repeatability and reproducibility of
different operators in the analysis are influencing
the outcome, temperature, time between harvest and analysis, different breeds and milk composition and comparison of Ekomilk Scan® equipment with methods: standard and official reference in order
to verify its reliability, which generated different sampling, number of samples, treatment used and the method of analysis statistically used. It should be
clarified that all samples were sampling individually
by autosampler, cows of different ages and lactation
stages from the first complete milking of animals.
Use of preservative in the sample
In this step 10 samples were collected from crossbred dairy cows and then they were
subdivided into two vials. In the first was added
bactericidal preservative Bronopol® but not in the second one, due to evaluation the influence of the
preservative in the SCC analysis of milk by Ekomilk Scan®. Results were evaluated by the Tukey test at 5% level of significance (p<0.05).
Storage temperature
Thirty three samples were collected from cows milk crossbred and then each sample cow was divided into three vials to be tested in three different storage temperatures by analyzing the Ekomilk Scan®: kept under refrigeration (2-8°C), kept on
time required to reach the desired temperature and perform the tests. This analysis was performed using
the Tukey test, with significance level of 5% (p<0.05)
and the means were compared.
Time between sampling and analysis
For these analyses were collected 33
samples of crossbred cow milk to assess the influence
of time between sampling and milk analysis in Ekomilk Scan® result. Samples were analyzed on
three separate days: D0 (the same day of collection), D1 (24 hours after sampling) and D2 (48 hours after sampling). Those samples analyzed 24h and 48h were maintained refrigerated at 4-8°C. Tukey test
with significance of 5% was used to analyze the influence statistically of time between sampling and
the analyzed results.
Breed
A total of 357 samples were collected from cows of Holstein, Jersey, Gyr and crossbred
cow milk to be analyzed by flow cytometry and by
Ekomilk Scan® to compare results and determine
possible variations according to the analyzed breed. Statistical analyzes were performed using the
Tukey test (p<0.05) and the analysis of correlation coefficient (R2).
Milk composition
This phase aimed to evaluate the effects of milk composition on the results obtained by Ekomilk Scan® and 73 samples of Jersey cow milk were
collected. Results were statistically analyzed using regression analysis.
Repeatability
This step refers to tests performed on the same material but at short intervals of time in the same laboratory by the same operator and with the same equipment. Thus, it was used to carry out this test three samples from crossbred cows, each representing a SCC value range: high, medium and low. Each sample was repeated 17 times, totaling 51 analyzes through Ekomilk Scan® equipment,
with other variables held under the same conditions.
Coefficients of variation in the ratio of their average
and standard deviation were analyzed.
Reproducibility
This analysis refers to the same test on a single sample, performed by different laboratories, using different operators performing the same test on a single sample. Thus, samples of 10 crossbred
animals were analyzed by Ekomilk Scan® having
three persons operators, but under the same analysis conditions. Result of each operator was analyzed
statistically by Tukey test (p <0.05) comparing the
results with others.
Comparison of methods
For this evaluation it was collected 122 samples of crossbred cow milk in Schott bottles with 500mL capacity. Each sample was divided into three smaller vials to the analysis with different methods and subsequent comparison of the results: Ekomilk Scan®, Flow Cytometry and Microscopy Direct.
The samples that aimed analysis by
flow cytometry methodology were added with
bactericidal preservative Bronopol® and the same
were sent to the laboratory of the Milk Clinic of Animal Science Department from the Escola Superior de Agricultura “Luiz de Queiroz”, Piracicaba-SP, that uses Somacount 300 equipment from Bentley Instruments Inc., at electronic
counting of somatic cells by means of flow
cytometry method (IDF, 1995).
However, samples that were used to SCC by the method of direct microscopy were kept in the refrigerator, without preservative until the test. For this an aliquot of 10µL from milk sample was distributed in an area of one cm² on a microscope slide, repeating the procedure in their duplicates. Then the slide was dried at room temperature for 24 hours (PRESCOTT & BREED, 1910). After the smear the blade was subjected to the staining using the technique Moats (MOATS, 1972). To perform the reading, the cell count present in 120 visual fields made up of blades was made using an immersion objective (100x and 10x objective). For the final result the average was obtained from two counts and multiplies by the previously computed microscope factor, expressing the result in the number of somatic cells per mL of milk (ZENG et al., 1999).
The third part of the initial division of the sampling was referred for analysis by Ekomilk Scan® equipment. For this the samples to be
processed and the reagent used in the analysis were kept at 20-22°C temperature range, according to the manufacturer determinations. For analysis, they were added with a pipette, 10mL of the milk sample and were subsequently added 5mL of reagent solution to the mixer balloon equipment. After the continued unrest, the machine releases the milk
that flows through a capillary and subsequently
Statistical analysis for the comparison of somatic cell count prediction methods were performed using the somatic cell score (SCS) by the SAS® statistical program. The SCS was obtained by the equation ECS = log2 (SCC/100) + 3 (SHOOK, 1982). Initially, the analysis was performed to select the factors that should be included in the statistical model, using the GLM SELECT procedure. This procedure selects the most important factors that affect cytometry. After selecting the factors to be included in the model, the regression analysis was performed by GLM Procedure.
Then the analysis was performed to compare the results of the somatic cell scores obtained by the Ekomilk Scan® analyzer, standard and reference
methods by the GLM and CORR procedure.
RESULTS AND DISCUSSION
Variables influencing the outcome Use of preservatives
In this experiment it was tested the addition of a preservative most commercially used Bronopol® (BERTRAND, 1996) to preserve the
sample, due to its antibacterial effect (CHEMICAL LAND21, 2004), and thus providing the extension of the period between sampling and the test performance because according to MEYER et al. (2002), samples of raw milk intended to SCC and the determination of components can be analyzed within 10 days if the preservatives and refrigeration were used. However, the test was not successful, because with the addition of Bronopol® there wasn’t any change in viscosity
between milk and Ekoprim surfactant samples formed an inconsistent and scarce liquid which prevented the reading made by Ekomilk Scan®.
Thus, it is impossible to use the Bronopol® with
bactericidal effects and preservative to the test Ekomilk Scan®.
Storage temperature and time between sampling and analysis
According to ZAGO et al. (2006), with the aim of preventing the multiplication of bacteria and all the physical and chemical changes resulting from this multiplication, the ideal means of preserving the milk samples for several days before the analysis is the refrigeration, with the temperature as close as possible of the freezing point, without this occurring. In the present study, the average milk SCC in the three temperature ranges tested 2-8°C, 20-22°C and 30-32°C, showed no statistically
significant differences (p> 0.05), which were (493,
476 and 536) thousand cells.mL-1, respectively.
Manufacturer’s own Ekomilk Scan® attentive in
instructions that the sample and the surfactant must be in 22°C temperature, but results showed that the samples may be any temperature ranging from
2 to 32°C without significant effect. However, the
variation in temperature Ekoprim surfactant has
not been studied and this would cause a significant
effect on the average.
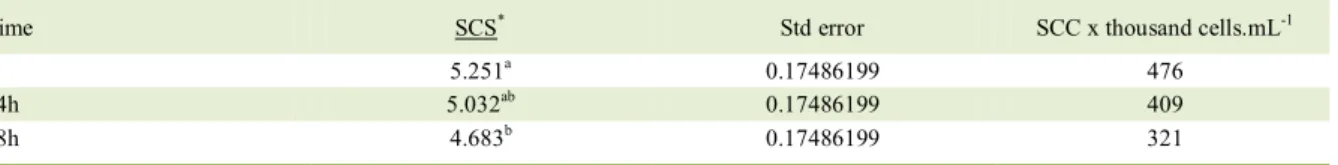
The time between sampling and analysis was also studied and the results showed visible effects of time in statistical analysis. According to table 1, there is a decrease from baseline of SCC due to the time between sampling and analysis, for in D0 (the same day of sampling) SCC reported was 476x103 cells.mL-1, followed by 409x103
cells.mL-1 and 321x103 cells.mL-1 to D1 (24 hours
sampling) and D2 (48 hours after sampling), respectively. Results are similar to those reported by MEYER et al. (2002) that also observed a decrease from baseline of SCC when related to storage temperature and time between sampling and analysis of milk samples. Percentage of SCC
Table 1 - Comparison of the somatic cell score (SCS) and equivalent somatic cell count (SCC) in different evaluation time (0, 24 and 48 hours).
Time SCS* Std error SCC x thousand cells.mL-1
0 5.251a 0.17486199 476
24h 5.032ab 0.17486199 409
48h 4.683b 0.17486199 321
drop observed in this study (approximately 32%) is worrisome since some producers stock their production in 48 hours, during which the Brazilian law permits this storage of the product in the farm (expansion tank) however most exceeds this time limit, keeping milk for more than 48 hours on their farms. BRITO et al. (2003) reported that only 60% of total milk samples from the states of Minas Gerais, Espírito Santo and Rio de Janeiro
come to the laboratory five days after sampling.
Thus, to reach the laboratory, samples can be with SCC with underestimated values, which can lead
to misclassification by the industry as suitable
causing damage to this and as SCC is a question of the technical regulation of identifying quality of raw milk refrigerated proposed by the Ministry of Agriculture, Livestock and Supply (BRASIL, 2011). In addition to the industry, producer may also be affected because this will have a false indicator of the herd mammary glands health. Thus, it is recommended to perform the analysis of milk on the same day of collection.
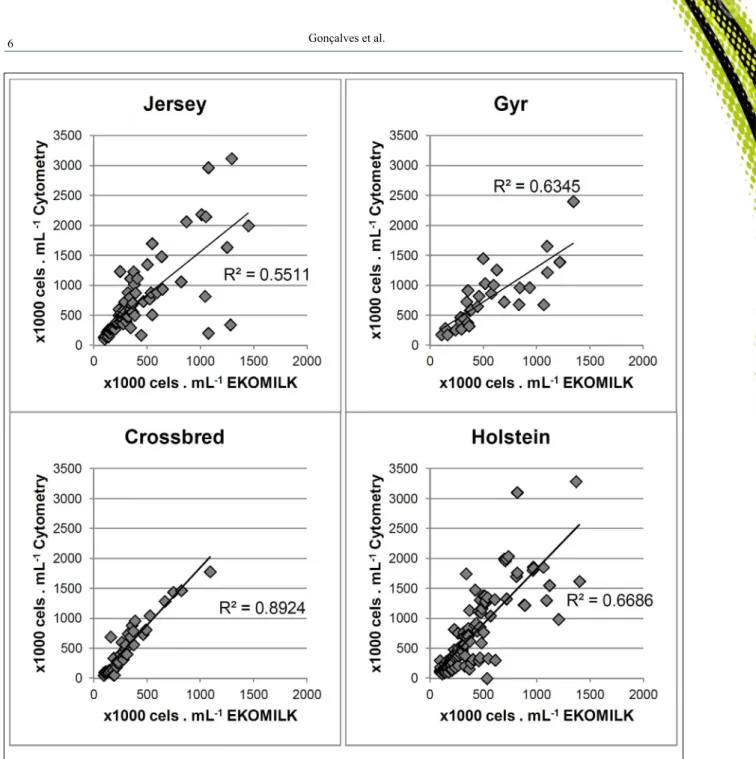
Breed and milk composition
This variable was tested to study if it is necessary to identify the sample before processing to check if it is from pure breed or crossbred or even samples from the expansion tank. There
wasn’t statistically significant effect on the comparison of results obtained in flow cytometry
and Ekomilk Scan® (Figure 1). Conversely, when comparing the correlation coefficients (R) these
were higher for samples from crossbred animals, followed Gir and Holstein and the lowest R was reported for the Jersey breed and a possible explanation for this could be because of the high content of fat and protein in milk composition of these animals and consequently great relationship with increasing viscosity. However, when looking for some component of milk in which could result
in a statistically significant difference in the outcome, nothing was significant at 5% confirming that no milk component significantly interfered
with the result of Ekomilk Scan®. According to the interpretation of Pearson correlation coefficients
performed by MALETTA (2014), Jersey, Gyr and Holstein of this experiment have marked correlation (R between 0.41 to ± 0.70) among the methods of analysis, while that for crossbred races, this comparison was considered high (R of 0.71 to ± 1.00). DOHOO & MEEK (1982) did not recommend the inclusion of breed effect in studies on SCC, disagreeing with JAARTSVELD
et al. (1983) who observed a significant difference
between two breeds evaluated in their study.
Variables associated equipment Repeatability
This analysis sought the consistency of the results when the test repeated, it was based on milk samples data in three SCC ranges: low, medium
and high, they presented the following coefficients
of variation (CV), respectively: 17.2; 4.2 and 7. By observing the CV there is low variation between the maximum and minimum values in SCC, especially in relation to medium and high SCC range. It was observed that in samples with low SCC range
was higher coefficient of variation, which can be
explained by the proximity of these samples to the minimum detectable limit for issuing results of Ekomilk Scan® (Table 2).
Reproducibility
Analysis was carried out to measure the ability of the method to produce consistent results when performed independently and under the same conditions. There was not significant statistically difference between the three operators tested because the SCC average of each was very close: Operator 1 SCC-378, Operator 2 SCC-352 and operator 3 SCC-344 thousand cells.mL-1. This result indicated that
the operator does not require minimum system requirements to use the equipment and does not require advanced professional training for the analysis in Ekomilk Scan®. This becomes a great
value to the dairy farms and laboratories that can purchase the equipment without the need to hand specific work, because as shown the method does not require high demands, at least fidelity to the protocol to be followed.
With low variation of results when the
test is repeated, combined with no significant
difference when changing the equipment operators, the Ekomilk Scan® is a necessary equipment;
it presents concise results when conducted independently, but under the same conditions. However, the device must be calibrated correctly; otherwise, the test may have high reproducibility, but consistently produce erroneous results.
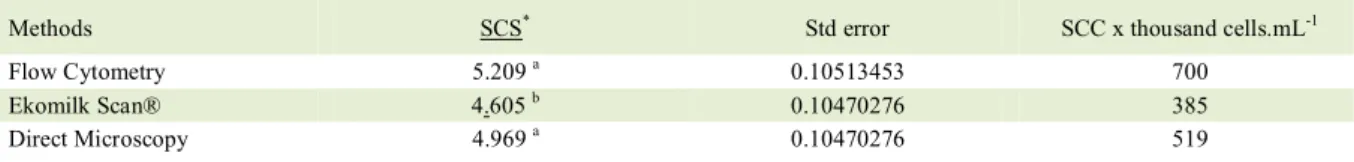
Method comparison
When comparing the standard and reference methods with Ekomilk Scan®, this differed significantly in average value of SCC when compared to flow
As the result of flow cytometry and
Ekomilk Scan® differ significantly analysis was
performed to make any equation that adequate the values of Ekomilk Scan® in order to impart high correlation between the results of flow cytometry.
Thus, three equations were generated:
I) CYTOMETRY = - 715.52 + 106.56 x TIME - 9.66 x FAT - 150.08 x PROTEIN
II) CYTOMETRY = - 1076.20 + 105.72 x TIME - 50.01 x FAT
III) CYTOMETRY = - 682.88 + 106.57 x TIME - 169.69 x PROTEIN
At first it is necessary to know the values
of fat and protein in the sample. For this equation, the
correlation coefficient was 0.94, which is considered high according to MALETTA (2014), and coefficient Figure 1 - Correlation coefficients (R) of the methods of analysis of milk samples from cows Holstein, Jersey, Gyr and crossbred in relation
of variation was 22%. Conversely, when it doesn’t known variables such as fat or protein, equations II and III must be used, both having correlation
coefficient of 0.94 and variation coefficient of 23%
and 22% in the second and third equation. The time entered in these equations is the value in seconds
corresponding to the time of flow of milk through the
capillary Ekomilk Scan®, and that presents a positive
linear relationship with the SCC. This value was used instead SCC due to the absence of detection limit time, unlike that in SCC values below 90 and above 1500 are not detected by the device.
Finally, flow cytometry - electronic method - was used as a gold standard to define the presence
of subclinical mastitis using a cutoff of 200x103
cells. mL-1, as recommended by the National Mastitis
Council (NMC), for individual milk samples. From
this pattern we calculated the sensitivity, specificity, and the kappa coefficient to verify the correlation
between the test and the Ekomilk Scan®. As a result, it is observed a sensitivity of 88.04% and specificity
of 86.21%. The kappa index for the analysis of agreement between the methods was of 0.68 which according to MEDEIROS et al. (2008), being a substantial agreement between tests. Results are higher than those reported by ARAÚJO et al. (2012)
who tested qualitatively another alternative method for the SCC (Somaticell®) and reported a sensitivity and specificity of 70% and 77%, respectively.
CONCLUSION
Results presented by Ekomilk Scan® equipment don´t relate significantly to the standard
and reference methods and need adequation in order to impart high correlation between results. Although, Ekomilk can be used as an alternative for monitoring the SCC in production units due to the ability to quickly estimate the result. It is portable and easily transported to different environments,
allowing analysis in the field, rechargeable in
12-volt sockets included in vehicles, and performs the somatic cell count in a time of 3 to 4 minutes. The Ekomilk Scan® does not require skilled operator to perform the analyzes; however, requires auxiliary materials such as pipettes, bath equipment, distilled water and others. Moreover, their analysis must be done on the same day of collection and without use of preservatives, regardless of the sample temperature. So, Ekomilk Scan® can be an alternative for the
producer to monitor the health of the mammary gland of cows in productive units.
Table 2 - Average, minimum and maximum, coefficient of variation and standard error of somatic cell count and somatic cell score of 17 samples for each SCC level, analyzed in triplicate, as a function of SCC range.
Range ---SCC x thousand cell.mL-1---
---SCS---Average Min. Max. Average Min. Max. CV Std Error
Low 211 146 254 4.055 3.545 4.344 6.53 0.064
Intermediate 765 704 820 5.935 5.815 6.035 1.02 0.014
High 1044 916 1200 6.381 6.195 6.584 1.59 0.024
Min. – minimum values; Max. – maximum values; CV – coefficient of variation; Std error – standard error.
Table 3 - Comparison of the somatic cell score (SCS) and equivalent somatic cell count (SCC) using different methods.
Methods SCS* Std error SCC x thousand cells.mL-1
Flow Cytometry 5.209 a 0.10513453 700
Ekomilk Scan® 4.605 b 0.10470276 385
Direct Microscopy 4.969 a 0.10470276 519
*Averages followed by the same letters in the same column do not differ from each other (P> 0.05), while averages followed by
different
ACKNOWLEDGEMENTS
The authors are grateful to the Coordenação de Aperfeiçoamento de Pessoal de Nível Superior (CAPES) for
granting a scholarship to the first author.
DECLARATION OF CONFLICTING INTERESTS
The authors declared no potential conflicts of interest with
respect to the research, authorship, and/or publication of this article.
REFERENCES
ARAÚJO, V.M. et al. Avaliação de testes rápidos para análise da contagem de células somáticas de leite cru de tanques. Acta Veterinaria Brasilica, v. 6, n. 4, p.321-324, 2012. Available from: <https:// periodicos.ufersa.edu.br/index.php/acta/article/view/2851/5148>. Accessed: Mar. 3, 2014. doi: 10.21708/avb.2012.6.4.2851.
BERTRAND, J.A. Influence of shipping container, preservative
and breed on analysis of milk components of shipped samples.
Journal of Dairy Science, v. 79, n. 1, p.145-148, 1996.
Available from: < https://ac.els-cdn.com/S0022030296763464/1- s2.0-S0022030296763464-main.pdf?_tid=dce495f3-48db-418c-a5ab-b177211f5009&acdnat=1525143635_60fc7283 0f 2ecd56d4e538e4396bdd3e>. Accessed: Jan. 22, 2014. doi: 10.3168/jds.S0022-0302(96)76346-4.
BRASIL. Instrução Normativa nº 62. Secretaria de Defesa Agropecuária, Ministério da Agricultura Pecuária e Abastecimento. Diário Oficial da União, Poder Executivo, Brasília, DF. 30 de dezembro de 2011.
BRITO, J.R.F. O que são e como surgem as células somáticas no leite. In: MARTINS, C. E.; COSTA, C.N.; BRITO, J.R.F. et al. MINAS LEITE I. Qualidade e produtividade de rebanhos leiteiros, 1999, Juiz de Fora. Anais... Juiz de Fora: p.35-39.
BRITO, N.M.; JUNIOR, O.P.A.; POLESE, L.; RIBEIRO, M.L. Validação de métodos analíticos: estratégia e discussão. R. Ecotox. Meio Ambiente, v. 13, p.129-146, 2003.
CECALAIT (Centre d’études et de contrôle des analyses en industrie laitière). La lettre de CECALAIT, n. 7, 1993.
CHEMICAL LAND21. 2-BROMO-2-NITRO-1,3-PROPANEDIOL. 2004. Available from: <http://www. c h e m i c a l l a n d 2 1 . c o m / a r o k o r h i / s p e c i a l t y c h e m / p e r c h e m / BRONOPOL.htm.>. Accessed: Nov. 12, 2012.
DOHOO, I.R.; MEEK, A.H. Somatic cell counts in bovine milk. The Canadian Veterinary Journal, v. 23, p.119-125, 1982. Available
from: <https://www.ncbi.nlm.nih.gov/pmc/articles/PMC1790153/ pdf/canvetj00281-0015.pdf>. Accessed: Jan. 24, 2014.
GODKIN, A. Qualidade do leite ao redor do mundo: o papel da CCS. In: II Simpósio Internacional sobre Qualidade do Leite. 2000. Curitiba, PR, Anais... Curitiba: p.09-20. 2000.
JAARTSVELD, F.H.J. et al. Somatic cell counts in milk of dairy cows in relation to stage of lactation, age, production level and
presence of pathogens. Netherlands Milk and Dairy Journal, v. 37, p.79-90, 1983.
MALETTA, C.H.M. Dicionário de Epidemiologia. Coopmed, Belo Horizonte, MG, p. 141, 2014.
MARSHALL, R.T. Standard methods for the examination of dairy products. Baltimore: American Public Health Association, Baltimore, MD, p.546, 1992.
MEDEIROS, E.S. et al. Avaliação do exame microbiológico, California Mastitis Test e Somaticell® no diagnóstico da
mastite subclínica em bovinos leiteiros. Medicina Veterinária,
Recife, v. 2, n. 2, p.16-22, 2008. Available from: <http://www. revistavet.byethost13.com/modules/mastop_publish/files/
files_487344803e8bb.pdf?i=1>. Accessed: Dec. 20, 2012.
MEYER, P.M. et al. Methods of milk storage and age of sample in milk components percentage, somatic cells count and urea nitrogen. Journal of Dairy Science, v. 85, n. 1, p.285, 2002.
MOATS, W.A. A comparison of three staining methods for microscopic count of bacteria in milk. Journal of Milk and Food Technology, v. 35, n. 8, p.496-98, 1972. Available from: <http:// jfoodprotection.org/doi/pdf/10.4315/0022-2747-35.8.496>. Accessed: Jan. 14, 2012. doi: 10.4315/0022-2747-35.8.496.
IDF. Milk-Enumeration of somatic cells. Standard 148ª. International Dairy Federation, Brussels, 1991.
IDF. Milk-Enumeration of somatic cells. Standard 148ª. International Dairy Federation, Brussels. p.8, 1995.
PRATA, L.F. Fundamentos de ciências do leite. Jaboticabal: Funep, 1998, 287p.
PRESCOTT, S.C.; BREED, R.S. The determination of the number of the body cells in milk by a direct method. The Journal of Infectious Diseases, v. 7, p.632-640, 1910. Available from: <http:// www.jstor.org/stable/30071855?seq=1#page_scan_tab_contents>. Accessed: Jan. 14, 2012. doi: 10.1093/infdis/7.5.632.
SANTOS, M.V.; FONSECA, L.F.L. Estratégias para o controle da mastite e melhoria da qualidade do leite. Manole: Barueri, p.314, 2007.
SHOOK, G.E. Approaches to summarizing somatic cell count which improve interpretability. In: National Mastitis Council Annual Meeting, 21., 1982, Pennsylvania. Proceedings... Madison: National Mastitis Council, 1982. p.150-166.
ZAGO, C.A. et al. Estudo de proteína instável: efeito do conservante e do armazenamento sobre o pH de amostras de leite. In: 58º Reunião Anual da SBPC. Anais Eletrônicos… Florianópolis, SC. 2006. CD.
ZENG, S.S. et al. Comparative study of the effects of testing laboratory, counting method, storage and shipment on somatic cell counts in goat milk. Small Ruminant Research, v. 31, p.103-107, 1999.
Available from:
<https://ac.elscdn.com/S0921448898001333/1s 2 . 0 S 0 9 2 1 4 4 8 8 9 8 0 0 1 3 3 3 m a i n . p d f ? _ t i d = 3 b 3 6 b b b 7 -2 d -2 4 - 4 e a f - b f a 5 - 6 c b 7 d a 6 3 f a 9 e & a c d n a t = 1 5 -2 5 1 9 5 5 6 -2 _
f770c323cf888fb16a111d01a23afd1a>. Accessed: Jan. 17, 2012.