R. Bras. Zootec., 47:e20160351, 2018
https://doi.org/10.1590/rbz4720160351
© 2018 Sociedade Brasileira de Zootecnia ISSN 1806-9290
www.sbz.org.br
Breeding, genetics, and reproduction
Genetic parameters for milk traits, somatic cell, and total bacteria count
scores in Brazilian Jersey herds
Mayara Andressa Sabedot1, Gabrieli de Souza Romano1, Victor Breno Pedrosa2, Luís Fernando Batista Pinto1*
1 Universidade Federal da Bahia, Escola de Medicina Veterinária e Zootecnia, Departamento de Zootecnia, Salvador, BA, Brasil. 2
Universidade Estadual de Ponta Grossa, Departamento de Zootecnia, Ponta Grossa, PR, Brasil.
ABSTRACT - This study aimed to estimate the heritability of milk yield (MY), fat percent (F%), fat yield (FY), protein
percent (P%), protein yield (PY), somatic cell score (SCS), and total bacterial count score (TBCS) as well as to estimate the genetic correlations among these traits, using a dataset from 5,918 lactations of Jersey cows in Brazil. The covariance components were estimated by restricted maximum likelihood using the PEST and VCE6 programs. The average values obtained for MY, F%, FY, P%, PY, SCS, and TBCS were 5017.5 kg, 4.3%, 192.3 kg, 3.3%, 173.0 kg, 5.9, and 2.9, respectively, while the heritability values were 0.16, 0.55, 0.18, 0.61, 0.25, 0.21, and 0.08, respectively. The genetic correlations ranged from low to high magnitude,
with positive values from 0.06 (TBCS-PY) to 0.72 (FY-PY), and negative values from −0.04 (F%-TBCS) to −0.44 (P%-TBCS).
The Jersey breed from Brazil shows genetic variability for all traits analyzed in the present study, and our results suggest that higher genetic gain will be achieved when F% and P% are used as selection criteria. In addition, it is important to use SCS as a selection criterion since the selection for MY and PY may lead to higher SCS or TBCS values, which are undesirable. This was the first study to estimate genetic parameters for milk quality (PY, P%, FY, F%) and udder health (SCS, TBCS) traits in Jersey cows from Brazil. This information is useful for breeding schemes and contributes to better characterize these parameters in tropical region, since few studies were developed with the Jersey cattle in this environment.
Key Words: genetic correlation, heritability, mastitis resistance, selection
Received: October 24, 2016
Accepted: June 11, 2018
*Corresponding author: luisfbp@gmail.com
Copyright © 2018 Sociedade Brasileira de Zootecnia. This is an Open Access article distributed under the terms of the Creative Commons Attribution License (http://creativecommons.org/licenses/by/4.0/), which permits unrestricted use, distribution, and reproduction in any medium, provided the original work is properly cited.
Introduction
Jersey cows are of great importance to the milk industry and market (Jamrozik and Schaeffer, 2012), and it is internationally regarded as a specialized breed for milk yield (MY), with high fat, protein, and total solids contents (Stocco et al., 2017). High values for these traits indicate milk quality, and increasing the milk, protein, and fat yields has long been a selection objective in Jersey breed.
Udder health problems, such as mastitis, cause great economic losses to the cattle industry. Thus, mastitis resistance is also an important objective for dairy cattle selection (Govignon-Gion et al., 2016). In addition, the associated economic costs due to mastitis also negatively impact the welfare of cows, resulting in changes in behavior
(Sepúlveda-Varas et al., 2016) and stress parameters (Roches et al., 2017). This is an additional justification for identifying the selection criteria for improving resistance to mastitis in dairy cattle. Somatic cell score (SCS) is one of the main selection criteria for resistance to mastitis and is obtained from the transformation of somatic cell count (SCC). According to García-Ruiz et al. (2016), the inclusion of SCS in genetic evaluations of dairy cattle in the United States from 1994 onward changed the average breeding value from +0.014 (1981-1985) to −0.035 (2011-2015).
Material and Methods
Milk recordings taken between 1970 and 2011 of 12 herds (Figure 1), belonging to the Brazilian Jersey Breeders Association were assessed in this study. All farms adopted a confinement feed system, and the first lactation Jersey cows were evaluated for 305-day MY (kg), F%, FY (kg), P%, and PY (kg), SCS in cells/mL, and TBCS in cfu/mL (Table 1). The 305-day adjustment for MY followed the correction factors recommended by Everett and Carter (1968). A preview screening of the dataset was performed, and the values that were beyond three standard deviations from the average were discarded. Data from cows with a calving age <20 months and >48 months were removed. Lastly, the contemporary groups that had less than three observations were not considered. The pedigree file had 8,992 animals, including 207 sires and 1994 dams, constituting five generations.
The SCS was obtained from the transformation of the SCC using the following equation: 2 3
100 SCC SCS=log +
,
according to Shook (1993). The TBCS was determined from the transformation of the total bacterial count (TBC) using the equation TBCS=log10
(
TBC+0.5)
, according to Brito et al. (2000).An analysis of variance (ANOVA) was performed for each trait to test the significance of the fixed effects and evaluate the ANOVA assumptions. A model containing the fixed effects of herd (12 levels), year (42 levels), season of birth (2 levels – December to May and June to November), and covariates age of cow at calving (linear and quadratic) and lactation length (linear) was adjusted in ANOVA, using SAS (Statistical Analysis System, version 9.3). All the factors described above were significant (P<0.01) for all traits. Then the fixed effects were posteriorly used to obtain the contemporary groups based on herd-year-season interactions.
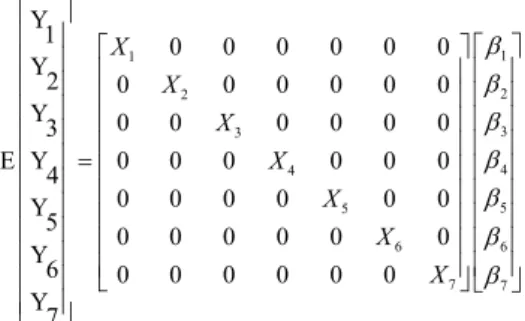
For the estimation of variance components, an animal model with multi-trait approach was used, in which all the traits were jointly evaluated. In a matrix format, the model was represented by y = Xb + Za + e, in which y is the vector of the traits analyzed; b is the vector of solutions for the fixed effects, containing the contemporary group and covariates age of cow at calving and lactation length; a is the vector of solutions for the random additive genetic effect; X and Z are incidence matrices for fixed effects and additive genetic effects, respectively; and e is the vector of the random residual.
The components of the models for analyzes could be simply represented as follows:
0 0 ; an
0 d 0 = = y Xb a G
E a V
e R
e
The multi-trait model could be represented as follows:
1 1 2 2 3 3 4 4 5 5 6 6 7 7 Y
1 0 0 0 0 0 0
Y
2 0 0 0 0 0 0
Y 0 0 0 0 0 0
3
E Y 0 0 0 0 0 0
4
0 0 0 0 0 0
Y 5
0 0 0 0 0 0
Y
6 0 0 0 0 0 0 Y 7 X X X X X X X β β β β β β β =
in which, the subscripts 1, 2, 3, 4, 5, 6, and 7 represent MY, F%, FY, P%, PY, SCS, and TBCS, respectively. The (co) variance matrix for genetic effects is G = G A, in which A is the relationship matrix and G0 is the additive genetic (co)variance matrix (of order 7) as follows:
G =
2
1 1,2 1,3 1,4 1,5 1,6 1,7
2
1,2 2 2,3 2,4 2,5 2,6 2,7
2
1,3 2,3 3 3,4 3,5 3,6 3,7
2
1,4 2,4 3,4 4 4,5 4,6 4,7
2
1,5 2,5 3,5 4,5 5 5,6 5,7
1,6 2,6 3,6
1,7 2,7 3,7
g g g g g g g
g g g g g g g
g g g g g g g
g g g g g g g
g g g g g g g
g g g
g g g
σ σ σ σ σ σ σ
σ σ σ σ σ σ σ
σ σ σ σ σ σ σ
σ σ σ σ σ σ σ
σ σ σ σ σ σ σ
σ σ σ
σ σ σ
2 6 6,7 4,6 5,6
2
4,7 5,7 6,7 7
g g
g g
g g g g
σ σ
σ σ
σ σ σ σ
R = I R0 is the residual (co)variance matrix (of order 7) between the seven traits. The covariance components required to estimate the genetic parameter were estimated by the restricted maximum likelihood (REML) with the programs VCE6 (Groeneveld et al., 2010) and PEST (Groeneveld, 2006). 8% 14% 36% 42% 0 500 1000 1500 2000 2500 3000
1970-80 1980-90 1990-00 2000-11
Nu mb er of co ws Decades
Results
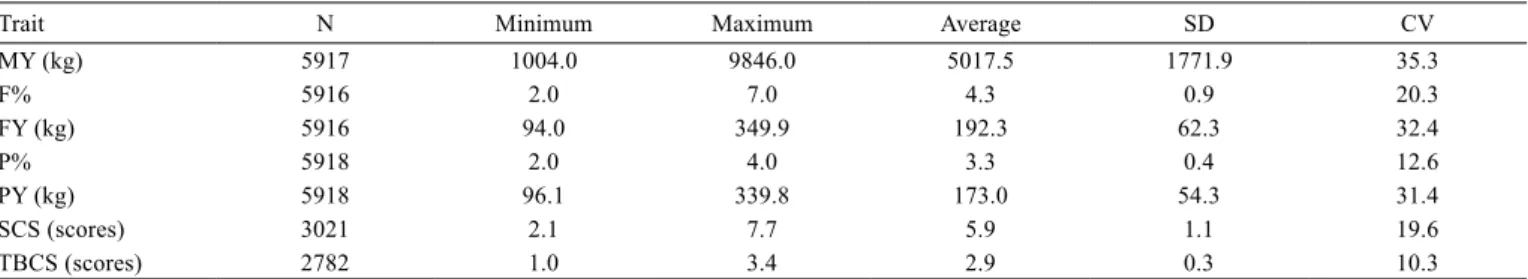
The MY adjusted for 305 days had an average value and standard deviation of 5017.5 and 1771.9 kg, respectively (Table 1). The FY and F% had average (standard deviation) values of 192.3 (62.3) kg and 4.3 (0.9) %, respectively, while the PY and P% were 173.0 (54.3) kg and 3.3 (0.4) %, respectively. The SCS average (standard deviation) values of 5.9 (1.1) were higher than TBCS 2.9 (0.3).
Heritability ranged from low to high (Table 2), indicating that selection using breeding values can result in a genetic gain. The heritability for MY was of low magnitude (0.16±0.02), while the heritability for FY and PY can be considered as low (0.18±0.02) and moderate (0.25±0.02), respectively. However, the heritability for F% (0.55±0.02) and P% (0.61±0.01) were both high. Finally, the heritability for SCS and TBCS were moderate (0.21±0.03) and low (0.08±0.02), respectively.
Genetic correlations between production traits (milk, fat, and protein) ranged from 0.16 to 0.72 (Table 3). Positive genetic correlations were observed among score traits (SCS, TBCS) and MY and PY, with values ranging from 0.06 to 0.28. On the other hand, negative genetic correlations were observed among score traits and F%, FY, and P%, with values ranging from −0.04 to −0.44. The SCS and TBCS had moderate genetic correlation (0.54).
Discussion
The average value observed for milk production in the present study (5017.5 kg) was greater than the average values reported in other studies about Jersey breed in Tropical region. Missanjo et al. (2013) found average of 4468.0 kg for Jersey in Zimbabwe, while Rincón et al. (2015) and Zambrano et al. (2014) reported 4234.0 L/lactation and 3857.0 L/lactation for Jersey in Colombia. Our results for fat (192.3 kg and 4.3%) and protein (173.0 kg and 3.3%) traits were also very similar to those reported by Missanjo et al. (2013), who found 199 kg and 4.42% for fat traits and 158 kg and 3.52% for protein traits. Results of Jersey herds from Colombia, reported by Rincón et al. (2015) (P% = 3.44% and F% = 4.66%) and Zambrano et al. (2014) (P% = 3.44% and F% = 4.71%) were also similar to those of the present study. In addition, our average value for SCS (5.9) was close to the value estimated by Missanjo et al. (2013) for Jersey in Zimbabwe (5.54) and higher than the values reported by Zambrano et al. (2014) (3.98) and Rincón et al. (2015) (4.22) in Jersey from Colombia.
On the other hand, Paulson et al. (2015) reported more expressive average values (milk: 8949.37 kg; fat: 425.47 kg; protein: 321.60 kg; and SCS: 2.77) for Jersey breed in the United States. Thus, the average values found in the present study show that, although Brazil occupies a
Table 3 - Estimate of genetic (upper diagonal) and phenotypic (lower diagonal) correlations among the traits
MY F% FY P% PY SCS TBCS MY 0.66 0.28 0.32 0.28 0.18 0.28
F% 0.01 0.53 0.46 0.36 −0.15 −0.04
FY 0.78 0.66 0.16 0.72 −0.12 −0.13
P% −0.01 −0.01 −0.02 0.36 −0.32 −0.44
PY 0.81 0.90 0.91 0.01 0.23 0.06 SCS 0.45 0.11 0.12 0.02 0.78 0.54 TBCS 0.13 0.31 0.02 0.13 0.83 0.17
MY - milk yield adjusted at 305 days of lactation; F% - fat percentage; FY - fat yield; P% - protein percentage; PY - protein yield; SCS - somatic cell score; TBCS - total bacterial count score.
Table 2 - Estimates of additive genetic (σa
2), residual (σ e
2), and
phenotypic (σp
2) variance components and heritability
(h2) for economic traits in the Jersey cows in Brazil
Trait σa
2 σ
e
2 σ
p
2 h2
MY 514338.70 2607000.00 3121338.70 0.16±0.02 F% 0.3668 0.2940 0.6608 0.55±0.02 FY 622.9 2912.0 3534.9 0.18±0.02 P% 0.08534 0.05490 0.14024 0.61±0.01 PY 670.7 1957.0 2627.7 0.25±0.02 SCS 0.020730 0.07659 0.09732 0.21±0.03 TBCS 0.1006 1.076 1.176 0.08±0.02
MY- milk yield adjusted at 305 days of lactation; F% - fat percentage; FY - fat yield; P% - protein percentage; PY - protein yield; SCS - somatic cell score; TBCS - total bacterial count score.
Table 1 - Number of observations (N), minimum, maximum, average, standard deviation (SD), and coefficient of variation (CV) for all traits
Trait N Minimum Maximum Average SD CV
MY (kg) 5917 1004.0 9846.0 5017.5 1771.9 35.3
F% 5916 2.0 7.0 4.3 0.9 20.3
FY (kg) 5916 94.0 349.9 192.3 62.3 32.4
P% 5918 2.0 4.0 3.3 0.4 12.6
PY (kg) 5918 96.1 339.8 173.0 54.3 31.4
SCS (scores) 3021 2.1 7.7 5.9 1.1 19.6
TBCS (scores) 2782 1.0 3.4 2.9 0.3 10.3
prominent position in the world rank of milk production, the productivity of Jersey herd in Brazil is more similar to that in underdeveloped countries such as Zimbabwe and Colombia, compared with that in developed countries such as USA. This result indicates the need to implement Jersey breeding programs that lead to the selection of animals based on estimated genetic breeding values.
In previous studies carried out with the Jersey breed in other countries (Sharma et al., 1983; Missanjo et al., 2013; Rincón et al., 2015; Zambrano et al., 2014) estimates of heritability for MY ranging from low to moderate were found. The value found in the present study (0.16±0.02) was similar to those reported by Sharma et al. (1983) and Rincón et al. (2015), who found the heritability for MY in the Jersey breed of 0.14 and 0.15, respectively. However, higher values were reported by Missanjo et al. (2013) (0.38) and Zambrano et al. (2014) (0.34). These differences between studies may be due to factors related to data analysis (e.g., dataset size, model, and method of analysis), as well as to the genetic (e.g., numbers of sires and dams, and inbreeding coefficient) and environmental (nutritional, reproductive, and health management) factors. Therefore, comparing the heritability between different studies is a difficult and often impossible task.
The low heritability estimated in the present study may be due to the use of 305-day MY. Sharma et al. (1983) detected a heritability of 0.14 using 305-day MY but estimated 0.26 with the use of test-day record method. Only one previous study was conducted with the Jersey breed in Brazil and used the test-day record from the 5th to 305th day as MY and found heritability estimates ranging from 0.81 (5thtest-day) to 0.20 (305thtest-day) (Dionello et al., 2006). Therefore, the heritability for MY in the Brazilian Jersey may be greater than the estimate obtained in the present study. Nevertheless, the heritability estimates for MY in the present study indicates a genetic variability that can be exploited in selection schemes.
For Jersey breed, estimates of heritability for FY ranging from low to moderate have been reported (Gacula Jr. et al., 1968; Musani and Mayer, 1997; Campos et al. 1994; Roman et al., 2000; Missanjo et al., 2013). Gacula Jr. et al. (1968) and Musani and Mayer (1997) reported heritability values of 0.10 and 0.08, respectively, while Roman et al. (2000) and Missanjo et al. (2013) reported values of 0.31 and 0.39, respectively. In the present study, the FY heritability (0.18±0.02) indicates that genetic variability can be used during selection. However, the genetic gain per generation would be small. On the other hand, in the present study, the F% had large heritability (0.55±0.02), which confirmed previous values reported
for the Jersey breed. Campos et al. (1994), Roman et al. (2000), Missanjo et al. (2013), and Rincón et al. (2015) estimated F% heritability as 0.53, 0.53, 0.47, and 0.46, respectively. Therefore, genetic gains per generation with selection for F% should be higher than the selection for FY.
In previous studies with Jersey breed cows, the estimates of PY heritability ranged from low to high. A low value was estimated by Roman et al. (2000) (0.17), moderate values were estimated by Sharma et al.(1983) (0.26) and Ahlborn and Dempfle (1992) (0.24), while Campos et al. (1994) detected a high value (0.43). In the present study, the heritability for PY of 0.25±0.02 indicated a genetic variability that could be used during selection and that the genetic gain per generation should be moderate. In the present study, P% had large heritability (0.61±0.01), which confirmed previous values reported for the Jersey breed. Campos et al. (1994), Roman et al. (2000), Sharma et al. (1983), and Missanjo et al.(2013) estimated P% heritability as 0.66, 0.53, 0.50, and 0.49, respectively. Therefore, genetic gains per generation with selection for P% should be higher than the selection for PY.
As expected, F% and P% presented higher heritability values when compared with yield traits (Table 2). Previous studies with the Jersey breed obtained a similar difference between yields and percents. Missanjo et al. (2013) reported 0.39 for both FY and PY but estimated 0.47 and 0.49 for F% and P%, respectively. Roman et al. (2000) reported 0.31 and 0.17 for FY and PY, respectively, but estimated 0.53 for both F% and P%. Similar results have been observed in other dairy cattle breeds (Bastin et al., 2013; Van Engelen et al., 2015; Sneddon et al., 2016). Therefore, available data for fat and protein traits suggest higher genetic variability for percents than for yields and that greater gains could be obtained by selecting for F% and P%.
to reduce mastitis occurrence. In this study, we estimated the heritability of SCS at 0.21±0.03, which indicates a genetic variability for selection, but that the genetic gain per generation would be moderate. The SCS has been little studied in Jersey cattle, and previous estimates of heritability were low and ranged from 0.01 to 0.11 (Missanjo et al., 2013; Zambrano et al. 2014; Rincón et al., 2015). However, estimates of heritability reported for the Holstein breed by Weller and Ezra (2004) (0.25), Dube et al.(2008) (0.19), and Wasana et al. (2015) (0.22) in the first lactation of cows in Israel, South Africa, and South Korea, respectively, are closer to that detected in this study. The definition of a selection criterion depends on several factors, such as its association with the selection objective, ease of measuring it, genetic correlations with other selection criteria, and its heritability. Considering only heritability, SCS is a potentially useful criterion for selection for improving the resistance of Brazilian Jersey cows to mastitis.
This study is the first to report an estimate of heritability for TBCS in the Jersey breed, perhaps because TBCS has more environment causes. According to Lopes Júnior et al. (2012), the magnitude of peak total bacterial count depends on the percent of infected mammary quarters, strain of bacteria, and stage of infection. However, it is known that high values of TBCS may be a consequence of the presence of mastitis in cows (Jeffrey and Wilson, 1987). Thus, TBCS must be evaluated to determine its potential as a selection criterion for increasing mastitis resistance in cows. In the current study, the heritability for TBCS was low (0.08±0.02), indicating genetic variability that could be used during selection. However, the genetic gain per generation would be expected to be small. Considering that the SCS has a greater heritability and greater association with the selection objective (to reduce the frequency of mastitis in the herd), we do not recommend the use of TBCS as a selection criterion.
The positive genetic correlation between MY and F% (0.66) and P% (0.32) found in the present study indicates that the selection to increase the volume of milk produced will also increase F% and P%, especially F%, whose genetic correlation with milk volume was higher. Similar results were reported by Ahlborn and Dempfle (1992), who estimated genetic correlation between MY and P% at 0.33, while Missanjo et al. (2013) found a genetic correlation of 0.62 between MY and F%, both positive values similar to those reported in the present study. However, negative values for genetic correlation between MY and F% (−0.56) and P% (−0.56), as reported by Sharma et al. (1983), are more common in the literature for milk production.
We expected higher values of genetic correlation between MY and PY and FY. Sharma et al.(1983), Ahlborn and Dempfle (1992), Campos et al. (1994), and Missanjo et al. (2013) studied the Jersey breed and reported values ranging from 0.60 to 0.98 for the genetic correlation between MY and FY, while the genetic correlation between MY and PY ranged from 0.59 to 0.98 in these studies. In the present study, the genetic correlation between MY and FY (0.28) and PY (0.28) were lower than in previous studies with Jersey breed. The present study was performed on a small data set, distributed across four decades, which may have influenced the (co)variance and, consequently, interfered with the estimates of correlation between milk and solid traits. However, the positive values indicate that the selection aimed at increasing MY would also increase FY and PY.
Fat and protein traits (percent or yield) had positive genetic correlations ranging from 0.16 to 0.72 (Table 3). Campos et al. (1994) reported similar results, with positive values between 0.11 and 0.79 for genetic correlation between yields and percentages of protein and fat. Thus, selection aimed at increasing any of these variables would likely cause an increase in the others, which is desirable.
Genetic correlations between MY and SCS and TBCS were positive and low, similar to that reported in previous studies with dairy cows. Rincón et al. (2015) found values of 0.09 for this correlation in the Jersey breed, while Monardes et al. (1984) and Pritchard et al. (2013) reported a genetic correlation between SCS and MY in Holstein cattle of 0.35 and 0.12, respectively. A few studies, such as Missanjo et al. (2013), have reported values of −0.38 for genetic correlation between MY and SCS in the Jersey breed. Moreover, Oltenacu and Broom (2010) emphasized that selection aimed at increasing MY favors the occurrence of mastitis. The small value observed in most of the studies indicates that different genes act in the control of MY and SCS. In that case, selection to increase MY should not increase, at least in the short term, the frequency of mastitis in herds. To reduce the occurrence of mastitis, we propose that other environmental factors must also be investigated.
between SCS and the PY (−0.04) and FY (−0.02), but with values close to zero; while Pritchard et al. (2013) found positive genetic correlations between SCS and the PY (0.13) and FY (0.07). The reduced value of most of these correlations indicates only little association between the genes that increase these milk solids and genes that increase susceptibility to mastitis.
The positive and moderate genetic correlation between SCS and TBCS (0.54) indicates that both traits are partially under the effect of the same set of genes. This result supports the use of SCS as a selection criterion to increase the resistance to mastitis in Jersey cows in Brazil because TBCS has a lower heritability than that estimated for SCS in the current study (Table 2). In addition, SCS has a closer relationship with the objective to be achieved, which is the reduction of mastitis occurrence in herds.
Conclusions
The Jersey breed from Brazil shows genetic variability for all traits analyzed in the present study, and our results suggest that higher genetic gain will be achieved when fat and protein percentages are used as selection criteria. In addition, it is important to use somatic cell score as a selection criterion since selection for milk and protein yields may lead to higher somatic cell score or total bacterial count score values, which are undesirable.
Acknowledgments
The authors thank the Brazilian Jersey Breeders Association, for the dataset, and the Coordenação de Aperfeiçoamento de Pessoal de Nível Superior (CAPES), for the scholarship granted to Mayara Andressa Sabedot.
References
Ahlborn, G. and Dempfle, L. 1992. Genetic parameters for milk production and body size in New Zealand Holstein-Friesian and Jersey. Livestock Production Science 31:205-219. https://doi. org/10.1016/0301-6226(92)90018-Y
Bastin, C.; Soyeurt, H. and Gengler, N. 2013. Genetic parameters of milk production traits and fatty acid contents in milk for Holstein cows in parity 1-3. Journal of Animal Breeding and Genetics 130:118-127. https://doi.org/10.1111/jbg.12010
Brito, J. R. F.; Brito, M. A. V. P. and Verneque, R. S. 2000. Contagem bacteriana da superfície de tetas de vacas submetidas a diferentes processos de higienização, incluindo a ordenha manual com participação do bezerro para estimular a descida do leite. Ciência Rural 30:847-850. https://doi.org/10.1590/S0103-84782000000500018 Campos, M. S.; Wilcox, C. J.; Becerril, C. M. and Diz, A. 1994.
Genetic parameters for yield and reproductive traits of Holstein and Jersey cattle in Florida. Journal of Dairy Science 77:867-873. https://doi.org/10.3168/jds.S0022-0302(94)77021-1
Dionello, N. J. L.; Silva, C. A. S.; Costa, C. N. and Cobuci, J. A. 2006. Estimação de parâmetros genéticos utilizando-se a produção de leite no dia do controle em primeiras lactações de vacas da raça Jersey. Revista Brasileira de Zootecnia 35(suppl):1646-1652. https://doi.org/10.1590/S1516-35982006000600010
Dube, G.; Dzama, K. and Banga, C. B. 2008. Genetic analysis of somatic cell score and udder traits in South Africa Holstein cows. South African Journal of Animal Science 38:1-11.
Everett, R. W. and Carter, H. W. 1968. Accuracy of test interval method of calculating dairy herd improvement association records. Journal of Dairy Science 51:1936-1941. https://doi. org/10.3168/jds.S0022-0302(68)87317-5
Gacula Jr., M. C.; Gaunt, S. N. and Damon-Jr., R. A. 1968. Genetic and environmental parameters of milk constituents for five breeds. II. Some genetic parameters. Journal of Dairy Science 51:438-444. https://doi.org/10.3168/jds.S0022-0302(68)87003-1 García-Ruiz, A.; Cole, J. B.; VanRaden, P. M.; Wiggans, G. R.;
Ruiz-López, F. J. and Van Tassell, C. P. 2016. Changes in genetic selection differentials and generation intervals in US Holstein dairy cattle as a result of genomic selection. Proceedings of the National Academy of Science of the United State of America 113:E3995-E4004. https://doi.org/10.1073/pnas.1519061113 Govignon-Gion, A.; Dassonneville, R.; Baloche, G. and Ducrocq,
V. 2016. Multiple trait genetic evaluation of clinical mastitis in three dairy cattle breeds. Animal 10:558-565. https:// doi.org/10.1017/S1751731115002529
Groeneveld, E. 2006. PEST User’s manual. Institute of Animal Science press, Neustadt. Available at: <ftp://ftp.tzv.fal.de/pub/ pest/doc/pest-manual-Apr-2006.pdf>. Accessed on: Jan. 28, 2016.
Groeneveld, E.; Kovač, M. and Mielenz, N. 2010. VCE User’s
guide and reference manual version 6.0. Institute of Farm Animal Genetics press, Neustadt. Available at: <ftp://ftp.tzv.fal.de/pub/ vce6/doc/vce6-manual-3.1-A4.pdf>. Accessed on: Jan. 28, 2016. Guimarães, J. L. B.; Brito, M. A. V. P.; Lange, C. C.; Silva, M. R.; Ribeiro,
J. B.; Mendon, L. C.; Mendon, J. F. M. and Souza, G. N. 2017. Estimate of the economic impact of mastitis: a case study in a Holstein dairy herd under tropical conditions. Preventive Veterinary Medicine 142:46-50. https://doi.org/10.1016/j.prevetmed.2017.04.011
Jamrozik, J. and Schaeffer, L. R. 2012. Test‐day somatic cell score, fat‐to‐protein ratio and milk yield as indicator traits for sub‐clinical
mastitis in dairy cattle. Journal of Animal Breeding and Genetics 129:11-19. https://doi.org/10.1111/j.1439-0388.2011.00929.x Jeffrey, D. C. and Wilson, J. 1987. Effect of mastitis-related
bacteria on total bacterial count of bulk milk supplies. Journal of the Society of Dairy Technology 40:23-26. https://doi. org/10.1111/j.1471-0307.1987.tb02829.x
Lopes Júnior, J. E. F.; Lange, C. C.; Brito, M. A. V. P.; Santos, F. R.; Silva, M. A. S.; Moraes, L. C. D. and Souza, G. N. 2012. Relationship between total bacteria counts and somatic cell counts from mammary quarters infected by mastitis pathogens. Ciência Rural 42:691-696. https://doi.org/10.1590/S0103-84782012000400019
Missanjo, E.; Imbayarwo-Chikosi, V. and Halimani, T. 2013. Estimation of genetic and phenotypic parameters for production traits and somatic cell count for Jersey dairy cattle in Zimbabwe. ISRN Veterinary Science 2013:ID470585. https://doi.org/10.1155/2013/470585 Monardes, H. G.; Hayes, J. F. and Moxley J. E. 1984. Heritability of
lactation cell count measures and their relationships with milk yield and composition in Ayrshire cows. Journal of Dairy Science 67:2429-2435. https://doi.org/10.3168/jds.S0022-0302(84)81591-X
Oltenacu, P. A. and Broom, D. M. 2010. The impact of genetic selection for increased milk yield on the welfare of dairy cows. Animal Welfare 19(suppl 1):39-49.
Paulson, J.; Salfer, J.; Newell, S.; Santi, E.; Seykora, T.; Litherland, N.; Endres, M.; Janni, K.; Reneau, J.; Broadwater, N.; Schwartau, C.; Rozeboom, G; Hudson, C. S.; Salfer, L. and Schmidt, S. 2015. Learning about dairy. Available at: <https://www.extension.umn. edu/youth/mn4-H/events/project-bowl/docs/PB-Learning-About-Dairy-Booklet.pdf>. Accessed on: Feb. 19, 2018.
Philipsson, J.; Ral, G. and Berglund, B. 1995. Somatic cell count as a selection criterion for mastitis resistance in dairy cattle. Livestock Production Science 41:195-200. https://doi.org/10.1016/0301-6226(94)00067-H
Pritchard, T.; Coffey, M.; Mrode, R. and Wall, E. 2013. Genetic parameters for production, health, fertility and longevity traits in dairy cows. Animal 7:34-46. https://doi.org/10.1017/S1751731112001401 Rincón, F. J.; Zambrano, A. J. and Echeverri, J. 2015. Estimation
of genetic and phenotypic parameters for production traits in Holstein and Jersey from Colombia. Revista MVZ Córdoba 20(Supl):4962-4973.
Roches, A. B.; Faure, M.; Lussert, A.; Herry, V.; Rainard, P.; Durand, D. and Foucras, G. 2017. Behavioral and patho-physiological response as possible signs of pain in dairy cows during Escherichia coli mastitis: a pilot study. Journal of Dairy Science 100:8385-8397. https://doi.org/10.3168/jds.2017-12796
Roman, R. M.; Wilcox, C. J. and Martin, F. G.2000. Estimates of repeatability and heritability of productive and reproductive traits in a herd of Jersey cattle. Genetic and Molecular Biology 23:113-119. https://doi.org/10.1590/S1415-47572000000100021 Sepúlveda-Varas, P.; Proudfoot, K. L.; Weary, D. M. and Keyserlingk, M.
A. G. 2016. Changes in behavior of dairy cows with clinical mastitis. Applied Animal Behaviour Science 175:8-13. https://doi.org/ 10.1016/j.applanim.2014.09.022
Sharma, A. K.; Rodriguez, L. A.; Mekonnen, G.; Wilcox, C. J.; Bachman, K. C. and Collier, R. J. 1983. Climatological and genetic
effects on milk composition and yield. Journal of Dairy Science 66:119-126. https://doi.org/10.3168/jds.S0022-0302(83)81762-7 Shook, G. E. 1993. Genetic improvement of mastitis through selection
on somatic cell count. Veterinary Clinics of North America: Food Animal Practice 9:563-577. https://doi.org/10.1016/S0749-0720(15)30622-8
Sneddon, N. W.; Lopez-Villalobos, N.; Davis, S. R.; Hickson, R. E.; Shalloo, L. and Garrick, D. J. 2016. Estimates of genetic and crossbreeding parameters for milk components and potential yield of dairy products from New Zealand dairy cattle. New Zealand Journal of Agricultural Research 59:79-89. https://doi.org/10.1080 /00288233.2015.1131723
Stocco, G.; Cipolat-Gotet, C.; Bobbo, T.; Cecchinato, A. and Bittante, G. 2017. Breed of cow and herd productivity affect milk composition and modeling of coagulation, curd firming, and syneresis. Journal of Dairy Science 100:129-145. https://doi. org/10.3168/jds.2016-11662
Van Engelen, S.; Bovenhuis, H.; Dijkstra, J.; Van Arendonk, J. A. M. and Visker, M. H. P. W. 2015. Genetic study of methane production predicted from milk fat composition in dairy cows. Journal of Dairy Science 98:8223-8226. https://doi.org/10.3168/ jds.2014-8989
Wasana, N.; Cho, G.; Park, S.; Kim, S.; Choi, J.; Park, B.; Park, C. and Do, C. 2015. Genetic relationship of productive life, production and type traits of Korean Holsteins at early lactations. Asian-Australasian Journal of Animal Sciences 28:1259-1265. https:// doi.org/10.5713/ajas.15.0034
Weller, J. I. and Ezra, E. 2004. Genetic analysis of the Israeli Holstein dairy cattle population for production and nonproduction traits with a multitrait animal model. Journal of Dairy Science 87:1519-1527. https://doi.org/10.3168/jds.S0022-0302(04)73303-2 Zambrano, J. C.; Rincón, J. C. and Echeverri, J. J. 2014. Parámetros